Map: Detroit Annexation and Wayne County 1922

Map-of-WayneCounty-1922

Map from“A History of River Rouge, Michigan” by Frances E. Manor

“On January 1, 1922, a portion of Hamtramck Township was incorporated as the City of Hamtramck.

On April 3, 1922, a portion of Ecourse Township was incorporated as the City of RIver Rouge.

On May 3, 1922, a portion of Ecourse Township was annexed to the City of Detroit.

On November 10, 1922, a portion of Greenfield Township was annexed to the City of Detroit.

On November 21, 1922, a portion of Greenfield Township was annexed to the City of Detroit.”

Map: Landscape Park in Detroit Context

Archipelago Detroit 10

This is the final product of the research and mapping that Lars Gräbner, of Volume One Studio and the University of Michigan Taubman College, completed in 2010. The concepts that came out of his research are in full bloom with this map that demonstrates the landscape park with existing Detroit infrastructure and planned future developments (such as M1 Rail).

More from Lars Gräbner:

The synoptic representation of Detroit’s landscape park.

These maps were featured in Mapping Detroit (Chapter 8: Mapping the Urban Landscape: Revealing the Archipelago) available from the WSU Press.

Map: Urban Agriculture in Detroit 2014

detroit_urban_ag

I created this map to be included with an article, titled “Urban Agriculture: It’s not a Food Desert, it’s about Food Sovereignty,” that I contributed to the Progressive Planners Network publication.

Without running any statistics, there are some obvious overlaps in where people are and the locations of gardens and farms. In particular, there is a higher density of people (and incomes) on the Westside and similarly a higher density of gardens.

The data is based on information shared by Keep Growing Detroit and the US Census Bureau.

Map: The Landscape Park and Energy Production in Detroit

Archipelago Detroit 09

In 2010, Lars Gräbner of Volume One Studio and the University of Michigan Taubman College, began conducting a mapping study of Detroit in order to conceptualize a future for the city.

More from Lars Gräbner:

“The establishment of the urban productive landscape park allows for a range of landuses and activities (ranked by intensity of intervention):

  1. wet land restoration
  2. energy crop production
  3. solar fields
  4. recreational opportunities
  5. cultural amenities

Transition areas:

  • urban farming and neighborhood gardens
  • ‘rural’ living in low density areas
  • recreational amenities close to residents

A minimum of 5,000 households could be supplied with heat, while electricity could be produced for an equivalent of 30,000 households per year*, provided all of the available 10,000 hectares (38.6 sq miles) of the Landscape Park were put to production.

If additionally a minimum of 50% of the transitional areas contribute also to the energy production, at least 6,300 homes can be heated and 38,000 homes can be supplied with electricity total.

*Average home electricity use per year: 6,139 kWh and the average annual fuel usage in Michigan is 35,520 kWh (1,212 therms/gal)

These maps were featured in Mapping Detroit (Chapter 8: Mapping the Urban Landscape: Revealing the Archipelago) available from the WSU Press.

Map: If the Detroit River Flooded

Screen Shot 2016-01-29 at 4.20.39 PM

This is a purely hypothetical map from the same group that created the flawed “Detroit Elevation Map.” This map is based on water level rising by 600 feet (183 meters). They’ve utilized Nasa’s 90m resolution SRTM data and modeled it based on potential sea level rise.

If the 2014 floods were any indicator, the river and sea level rise are the least of our flooding worries.

See also: 1981 Flood Insurance Map


Map: Ecological Urban Intervention Zones


Archipelago Detroit 08

In 2010, Lars Gräbner of Volume One Studio and the University of Michigan Taubman College, began conducting a mapping study of Detroit in order to conceptualize a future for the city.

More from Lars Gräbner:

“The levels of urban intervention range from the opportunity for entire restructuring processes and clearance from structures (darkest color) to reinterpreting low density neighborhoods (lightest color).

These maps were featured in Mapping Detroit (Chapter 8: Mapping the Urban Landscape: Revealing the Archipelago) available from the WSU Press.

Map: Detroit’s Racially Concentrated Areas of Affluence and Poverty

rcap-detroit

A while back The Atlantic included these maps from researchers at the University of Minnesota in an article titled, “Where the White People Live.” The red areas are racially concentrated areas of affluence and the blue are racially concentrated areas of poverty.

According to the research:

“Detroit [region] has 55 racially concentrated areas of affluence and 147 racially concentrated areas of poverty, […]. Detroit’s racially concentrated areas of affluence are just 1.1 percent black. Its racially concentrated areas of poverty, by contrast, are 76 percent black.”

The research also tracked federal dollars in these areas and found that three times more federal money is spent in racially concentrated areas of affluence, effectively subsidizing the segregation of housing, mobility, and place.

La Riviere du Detroit 1764

detr1764

No collection about maps of Detroit would be complete without what might be one of the most reproduced early maps of Detroit. This map is also assumed to be the first printed map of Detroit.

The map is titled, “map of Detroit’s settlement and French fortification” and it is easy to pick out the French ribbon farms along the river. The map was created by Jacques Nicolas Bellin, who was the official French royal hydrographer and ingéniuer géographe de la marine et du Dépot des Cartes et Plans. His responsibilities included the creation of atlases of sailing charts for military, royal, and commercial use. This map in particular was first published in his “Le Petit Atlas Maritime” in Paris (1764), however Detroit had already changed significantly from the time the map was created.

A lesser known fact is that this Bellin’s map was based on the 1749 land survey work of Gaspard-Joseph Chaussegros de Lery who was first commissioned for engineering work to New York in 1742. Later he was transferred from Montreal to Detroit in 1749 where he assisted in the engineering and planning of Fort Detroit.

Map: Restoring Detroit’s Ecology

Archipelago Detroit 07.jpgIn 2010, Lars Gräbner of Volume One Studio and the University of Michigan Taubman College, began conducting a mapping study of Detroit in order to conceptualize a future for the city.

More from Lars Gräbner:

“The restoration of the hydrologic system is guided by the levels of opportunity, generated in this series of maps (phasing).

First priority: restoration of wetlands in areas of highest potential for urban intervention.

Gradual expansion of the landscape in areas of high levels of opportunity.”

These maps were featured in Mapping Detroit (Chapter 8: Mapping the Urban Landscape: Revealing the Archipelago) available from the WSU Press.

Map: Driving on $50 from Detroit

5-cost-of-driving-Detroit-1a16

The people at HowMuch.net created these maps to visualize just how far you can get with our current record low gas prices. Their estimates are based on a car that can get 24 miles per gallon and gas price estimates from GasBuddy.

From Detroit we could reach nearly all major cities on the East Coast. Our key location where we can drive South into Canada allows us amply opportunity to explore our neighbor to the North. The opposite is also true, our friends on the East Coast or to the North can easily reach us on $50 of gas.

Map: Detroit Birth Rate 1922

Screen Shot 2016-02-17 at 7.53.45 AM.png

This map comes from the Detroit Department of Health’s report titled “A birdseye view of Detroit’s health status for the year 1922.” The city existed as 23 districts with “populations sufficiently large to make the comparison of rates worth while.”

The report was put together via typewriter and hand drawn maps. It even looks like the colors were painted on with watercolor.


Map: Returning to Nature with Detroit’s Streams

Archipelago Detroit 06.jpgIn 2010, Lars Gräbner of Volume One Studio and the University of Michigan Taubman College, began conducting a mapping study of Detroit in order to conceptualize a future for the city.

More from Lars Gräbner:

“The identification of existing and former rivers, streams and creeks with their wetland zones allows the establishment of a new structural base for the ecological urban intervention.

These maps were featured in Mapping Detroit (Chapter 8: Mapping the Urban Landscape: Revealing the Archipelago) available from the WSU Press.

Map: Detroit’s Connors Creek Sewer System 1895

connors-creek-sewer

Many of Detroit’s early waterways have become it’s current sewer system.

In the late 1910s, the Creek had become a dumping ground for area residents. Thanks to the railroads that the area’s founder, P.W. Norris, secured for the area, industry was increasing and the river retained little of its former usefulness as a key component of rural mills and irrigation systems.  By the mid 1920s, much of the Creek was already diverted underground either to build factories on top of it or to turn into sewers. Today, the only aboveground section is a half-mile stretch before the Creek meets the Detroit River.  However, even this section has changed.  The course of the river’s mouth was completely altered in the early 2000s when a new water treatment plant was built: the direction of the creek was rotated and it no longer even actually flows into the river.  Instead, the Creek ends in little more than a small pond attached to the river; the flow essentially stops once it enters the treatment plant.  Both the treatment plant and the sewer are evidence of the many changes that have been instituted in Detroit, which have knowingly (and intentionally) changed the appearance of the area.

Source: Silas Farmer and Co., “New Map and Guide of the City and Environs of Detroit,” Map, 1895, M 4114 D4 1891-1900, University of Michigan Bentley Historical Library.

Map: Locals and Tourists in Detroit

Screen Shot 2016-02-08 at 8.39.58 AM

I was reminded that Erica Fischer didn’t just bring us the Racial Dot maps or the recent Geotaggers Atlas, they also dug into Twitter data to determine where “locals” and “tourists” frequent. Where “locals” are blue, the main artery roads are well marked. It appears that WSU and UDM students constitute “locals” largely due to their limited travel patterns. Similarly, “locals” seem to visit or live in New Center rather than Downtown. The Downtown and Corktown areas are bright red from all the “tourist” activity.

Map: Detroit’s Vacant and Residential Archipelago 2010

Archipelago Detroit 05

In 2010, Lars Gräbner of Volume One Studio and the University of Michigan Taubman College, began conducting a mapping study of Detroit in order to conceptualize a future for the city.

More from Lars Gräbner:

The superimposition of data of actual vacant parcels and residential buildings onto the analytical map of levels of structural loss by census block groups allows the evaluation of intervening actions with higher precision and intention.

These maps were featured in Mapping Detroit (Chapter 8: Mapping the Urban Landscape: Revealing the Archipelago) available from the WSU Press.

Map: Detroit Zoning in Pastel

detroit-zoning

There is no point to this map besides showing zoning data in fun pink and pastel colors. Enjoy!

A few years back I was given a parking ticket because something about residential zoning, curb cuts, and sidewalks. The truth was that the “residential” lot was a gravel parking lot used by DMC labs to park their courier vans. Turns out there are special requirements for curbside parking along residential zoned land parcels.

Many of Detroit’s large and small parks are zoned “residential” (i.e. See Palmer Park in Zone 29) rather than “parks and rec” like Rouge Park.


Detroit Elevation Map


www.floodmap.net

This “elevation map” of Detroit utilizes NASA’s 90m resolution SRTM data in order to assume topography. As is readily evident, the map shows building heights rather than any topography or land elevation as there is minimal change in elevation across Detroit. Although, it does look pretty.

Downtown and Lafayette Park (see below) show obvious increases in elevation based on skyscrapers.

www.floodmap.net2


Map: Post-Industrial Greenways in Detroit

Archipelago Detroit 04

In 2010, Lars Gräbner of Volume One Studio and the University of Michigan Taubman College, began conducting a mapping study of Detroit in order to conceptualize a future for the city.

More from Lars Gräbner:

The relationship between current and former industrial sites and the proposed greenway system demonstrates a potential for a cultural access to the post-industrial landscape park.

The potential for adaptive re-use can be envisioned in a network of combined live-work and cultural corridors, highly connected to the landscape park.

These maps were featured in Mapping Detroit (Chapter 8: Mapping the Urban Landscape: Revealing the Archipelago) available from the WSU Press.

Map: Rating Accessibility of Detroit’s Pedestrian Bridges

pedbridges6

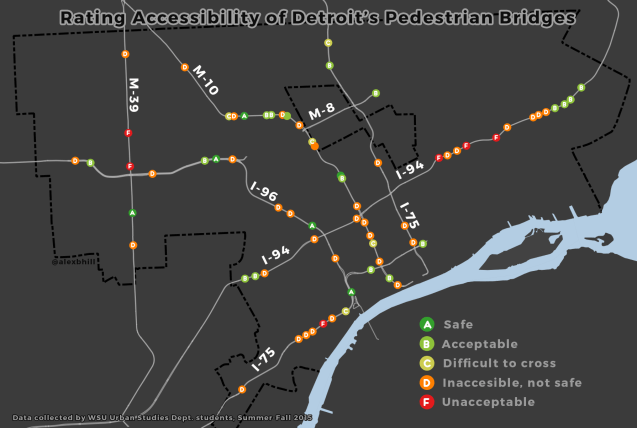
I had the pleasure of working with the 71X research team to visualize the data that they had collected on Detroit’s pedestrian (only) bridges. The student research team surveyed all 71 pedestrian bridges in Detroit.

From the 71X Team:

This is an independent study—an awareness-builder, too—introducing one side of a three-pronged problem in the City of Detroit. The intersection of accessibility, public health and safety. The team is comprised of Urban Studies’ students and community organizers working toward a more accessible Motor City. We study infrequent public transit and below standard “non-motorized” infrastructure with a commitment, again, to a prosperous Metro Area. From our vantage, Detroit is a big, three hundred and fifteen year old city severed into over a hundred neighborhoods. What is easily noticeable is its one-of-a-kind, sunken expressway network. It snakes through town, and detaches the city from itself. Interstates 75, 94, 96, and State Highways 8, 10 and 39 were carved out in the 1940s, 50s, and 60s by planners who we view, “misforecasted” the outcome of their design. (No, that’s not a word.) We feel planners, Big Auto, and regional leadership placed a low priority on a walkable city, safe for kids and accessible to elders and people with disabilities.

Today, low income residents traveling between neighborhoods—including those who cannot afford to lease (26%) or insure (approx. $5,000/yr.) a car—rely on public transport, six-to-eight-lane surface roads, and 71 pedestrian bridges to get where they need to be, on time. To the 5.3 million people of the country’s 11th largest Metro, the foot bridges we visited are an afterthought. There is no context for why bridges exist, where they do, and whether they are necessary (they are). We were curious to see how these points of connection, perform: what do residents have to say? Is each bridge equally maintained? What is the maintenance schedule?

Results:

  • The structural integrity of 33 bridges, or 46%, is compromised. These structures are in operation yet each had observable issues ranging from crumbling and disintegrating concrete to significantly rusted support beams, down signage and missing fencing and railing.
  • 36 of the 71 bridges, or 51%, are inaccessible. These structures do not have ADA-compliant curbs or cannot be climbed by people in wheelchairs.
  • 14 bridges, or 20%, connect service drives where cars speed and pedestrians are met with dangerous sight lines.
  • 46 bridges, or 65%, contain trash, glass, graphic imagery and gang-inspired graffiti.
  • 64 bridges, or 90%, are part of a critical route for walking to a transit stop.
  • 7 of the bridges, or 10%, are closed.

Conclusions:

The study did not aim to count unique users or trips per bridge. It is clear to see Detroit residents do rely on pedestrian bridges year-round. We found that instead of a byway connecting separate, isolated districts as would be assumed by the conventional observer, due to state of varying disrepair and underlying economic realities of the city neighborhoods, these bridges serve as unpredictable barriers, and in some cases, islands for criminal behavior. Residents are wary of crossing bridges due to safety concerns. Bridges serve as unpredictable barriers, and in some cases, islands for drug trade. Teenagers hurl objects—bottles and rocks—onto fast-moving traffic below.

Our combined 335 hours in the field included meeting hard-working residents and block club organizers. The feedback we collected supports our claim that there is a dire need for a collaboration between government and community to ensure safe, welcoming pedestrian bridges are a high priority in Detroit. Our report communicates a need for regional leadership to declare safe, welcoming pedestrian bridges are a high priority in Detroit. As the lead agency shaping the future of our State’s transportation system, our report is a request to MDOT to let us help employ a whatever-it-takes approach to upgrading city pedestrian bridges. Let’s protect each law-abiding citizen the same.

Feedback:

Find your City Council district on this map (click here) and complete the form for your district!
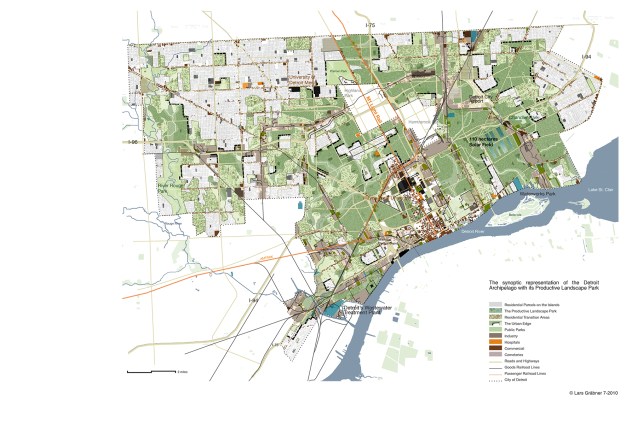
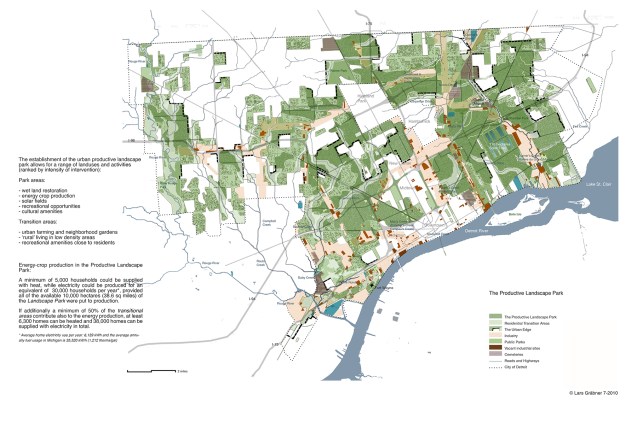
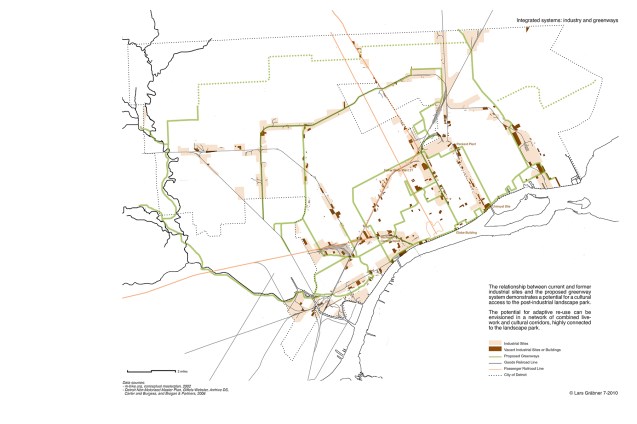
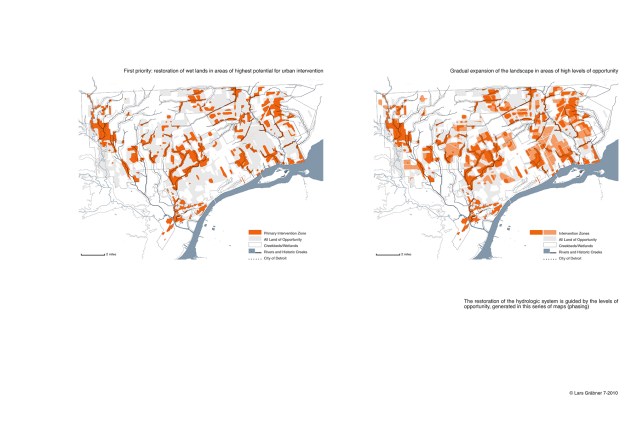
Map: Geotaggers’ Atlas of Detroit

12604917_10102170526040468_8705157365548129118_o

Erica Fischer has done it again. They became well known for this city map series on racial dot density, which has become widely used after their project in 2000.

They’ve now released the “Geotaggers’ World Atlas” via Mapbox by utilizing Flickr photos from the past decade. Now they just needs to include photos geotagged on Instagram. Looks like Detroit’s tourist economy is centered Downtown, Corktown (Michigan Central Station), some New Center, and definitely the Packard Plant.

HT @TerryParrisJr