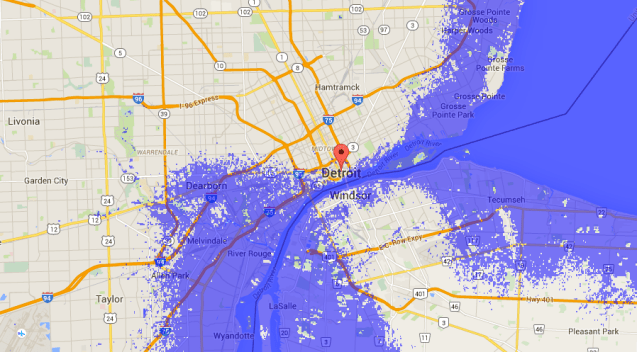
This is a purely hypothetical map from the same group that created the flawed “Detroit Elevation Map.” This map is based on water level rising by 600 feet (183 meters). They’ve utilized Nasa’s 90m resolution SRTM data and modeled it based on potential sea level rise.
If the 2014 floods were any indicator, the river and sea level rise are the least of our flooding worries.
See also: 1981 Flood Insurance Map

Is there a good map of normal flooding 🤔 I’ve been trying to find a good place to move, but don’t want to be anywhere near flooding 😕 and is this map showing potential flooding in a distant future date.
The University District or Boston Edison