NOTE: These are not “redlining” maps, but just one piece of the story of home disenfranchisement of Black Americans. Read more on HOLC lending in Detroit. Read more: Before Redlining and Beyond.

Part of Detroit’s history of racial discrimination is comprised on housing discrimination, which in turn contributed to job discrimination, interpersonal racism, and continued racial inequity of opportunity. These areas of Detroit were targeted for “urban renewal” in the 1960s which displaced thousands of black residents to public housing complexes. Today these areas of Detroit have more vacancy (see map) than others either because the redlined properties were managed by slumlords whose properties deteriorated (see map) more quickly or from renewal efforts that didn’t consider the displacement of black residents.
The racial divisions we see in our neighborhoods today are the result of deliberate actions taken in the past. (State of Opportunity)
This segregation of housing, which was legal up until the 1980s, also furthered school segregation and the inadequate education of Detroit’s black children. More from State of Opportunity:
One of the clearest visual representations of how racist policies shaped our neighborhoods comes from a mapping project launched in the 1930s by the federal Home Owners’ Loan Corporation. The HOLC was created in 1933 in response to the Great Depression as a way to help stabilize the housing market in the U.S. It did so by refinancing home mortgages and reshaping the entire residential lending industry. Along the way, HOLC commissioned so-called “Residential Security Maps” for more than 200 U.S. cities. These maps served as a guide for home lenders, including banks and the Federal Housing Administration.
You can find other HOLC maps online at: urbanoasis.org
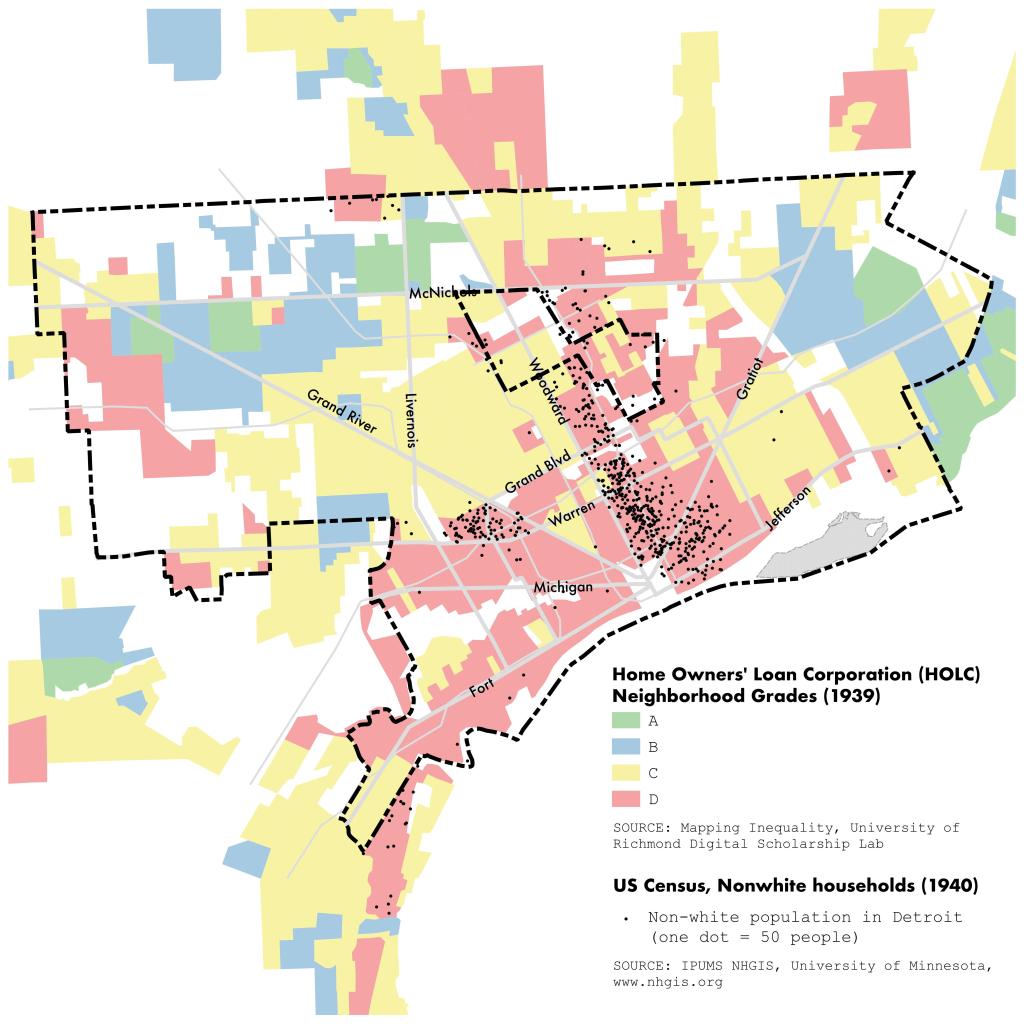
Check out this great map mashup of redlining 1939 and black neighborhoods in 1940 from Paul Szewczyk:

UPDATE: 01/14/22
I was able to recreate Paul’s image mashup with data from the 1940 Census from NHGIS and digitized HOLC areas from the University of Richmond “Mapping Inequality” project.
Notably these are not “redlining” maps, but one piece of the story of home disenfranchisement of Black Americans. Read more at Before Redlining and Beyond.

Pingback: Map: Gentrification is not simply Data | DETROITography
Pingback: Flint’s structural racism: This is why providing poisoned water to the city’s citizens seemed like a reasonable idea | Newslair
Pingback: Map: Detroit Neighborhood Markets “Blue-lining” 1932 | DETROITography
Pingback: Eight Mile and the Emergence of Segregation - Dr Duncan Robertson
Pingback: Why Detroit Matters, Part 6: Building a More Equitable Future | SmithGroupJJR
Pingback: Infrastructures of Hope – RADICAL HOPE
Pingback: Mapping the Green Book in Detroit 1938 – 1963 | DETROITography
Pingback: #22: on + on – kate glavan
Pingback: The blackest city in the US is facing an environmental justice nightmare – TheTop10News
Pingback: The blackest city in the US is facing an environmental justice nightmare | US news - News
Pingback: The blackest city in the US is facing an environmental justice nightmare – Radical News Feeds
Pingback: Six Years Later, Flint Still Doesn’t Have Clean Water
Pingback: Decolonising Geography – Geogramblings
Pingback: Marxists in Detroit!?! – Detroiter in Poland
Pingback: Are You Aware? Black History Month 2021, Part IV: Made in Detroit - Voices of MWEG
Pingback: Paul Jones III, 23, might just be Detroit Twitter's best follow | DETOUR
Pingback: Map: Retail Redlining and COVID-19 Vaccine Availability | DETROITography
Pingback: Map: Distribution of HOLC Mortgages in Detroit 1940 | DETROITography
Pingback: Map: Redlining compared to Social Vulnerability in Detroit | DETROITography
Pingback: Highland Park Part III: Ford Gave, and Ford Hath Taken Away [ Detroit Urbanism ] – The Laborious Truth
Pingback: 7 Historical Facts About Detroit’s Suburban Sprawl [ Detroit Urbanism ] – The Laborious Truth
Pingback: 'Data Feminism': A fresh take on ‘Data is the new oil’ -