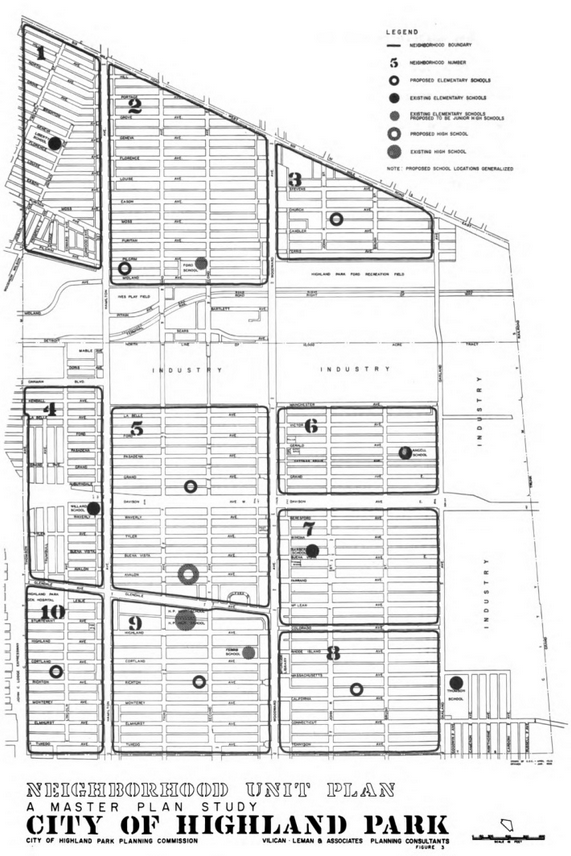
This site is usually about Detroit, but it’s impossible to disconnect understandings of Detroit from that of Highland Park (the left side of Detroit’s bow-tie).
I found this map to be interesting as I’ve considered historical divisions of neighborhoods in Detroit, but had never thought about it for Highland Park. This 1958 Master Plan Study broke the city into ten neighborhood units apart from the large industrial areas.
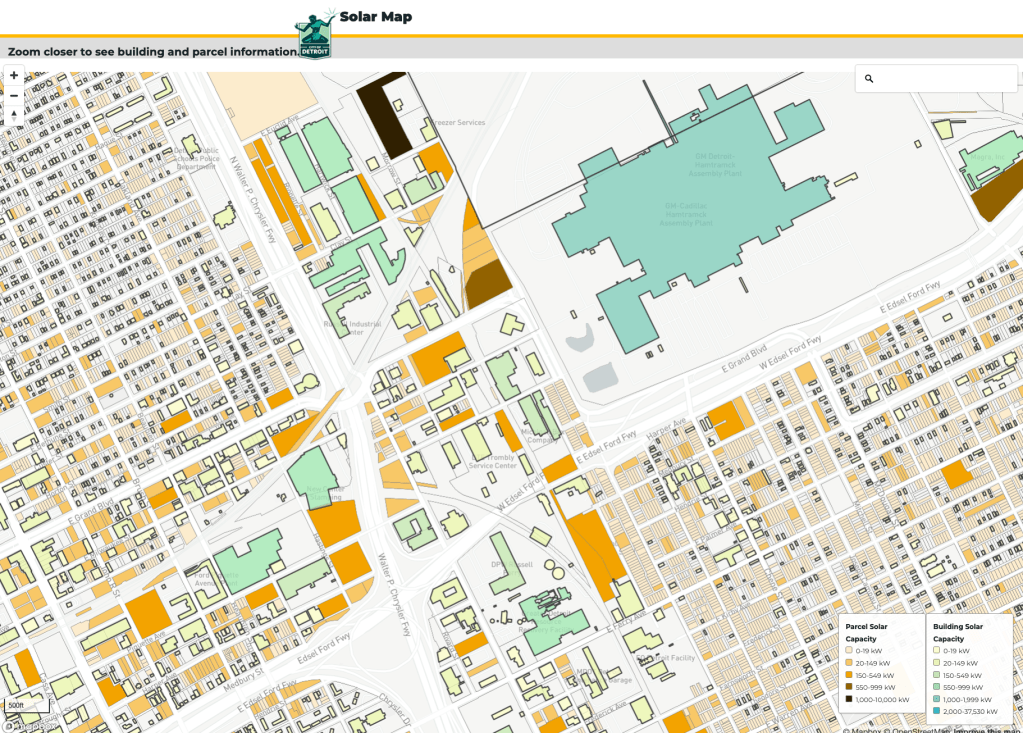
Detroit has solar potential, maybe? This map is only viewable at a very close zoom level. It seems to show that solar is most likely a possibility along commercial corridors and industrial zones. However, very few of these spots have the highest ratings for opportunity. One spot that stood out was the Detroit-Hamtramck Plant aka Poletown Plant aka Factory Zero. Good thing they have a lot of solar potential at the desired net-zero facility.
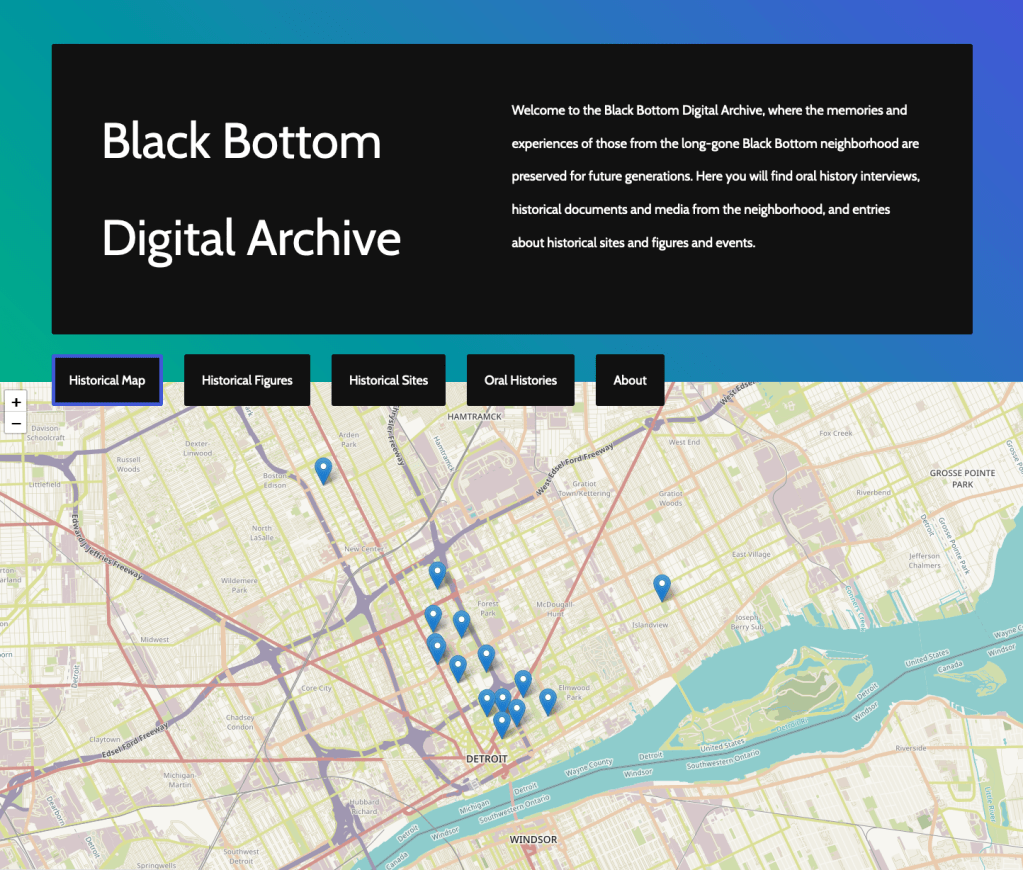
The Black Bottom Digital Archive is an outgrowth of Black Bottom Archives and the Black Bottom Street View projects. The most critical and essential element of the digital archive is its collection of oral histories from Black Bottom. A photograph archive was made to document the area before it was razed in favor of new housing developments (notably Lafayette Park), but few stories remain.
Black Bottom Archives is preserving those stories and mapping out historical sites.
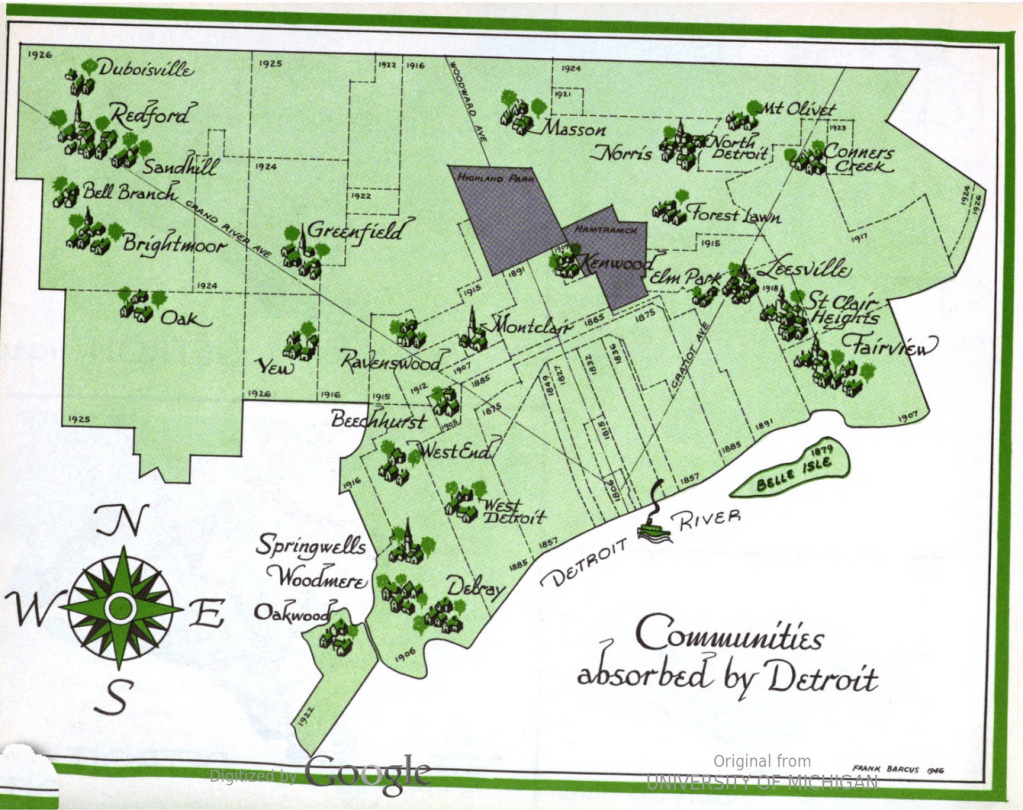
The content in this map was recreated in 2003 as a historical reference to place names in Detroit, but the original was included in the 1947 Master Plan for the City of Detroit. Many of the existing place names like St. Clair Heights, Greenfield, and Fairview are captured in street names. Others like Delray, Brightmoor, Mt. Olivet, Elm Park, and Redford live on as neighborhoods, communities, or cemeteries.
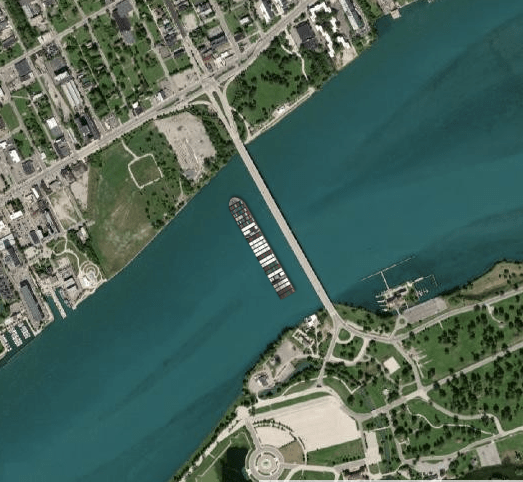
The Ever Given container ship has been stuck in the Sue Canal (sounds like it is partially free today, but not over yet) for 3 days.
Garrett Dash Nelson of the Boston Public Library’s Leventhal Map and Education Center built a quick app to place the massive container chip anywhere and everywhere. Here is the Ever Given next to the Belle Isle bridge.
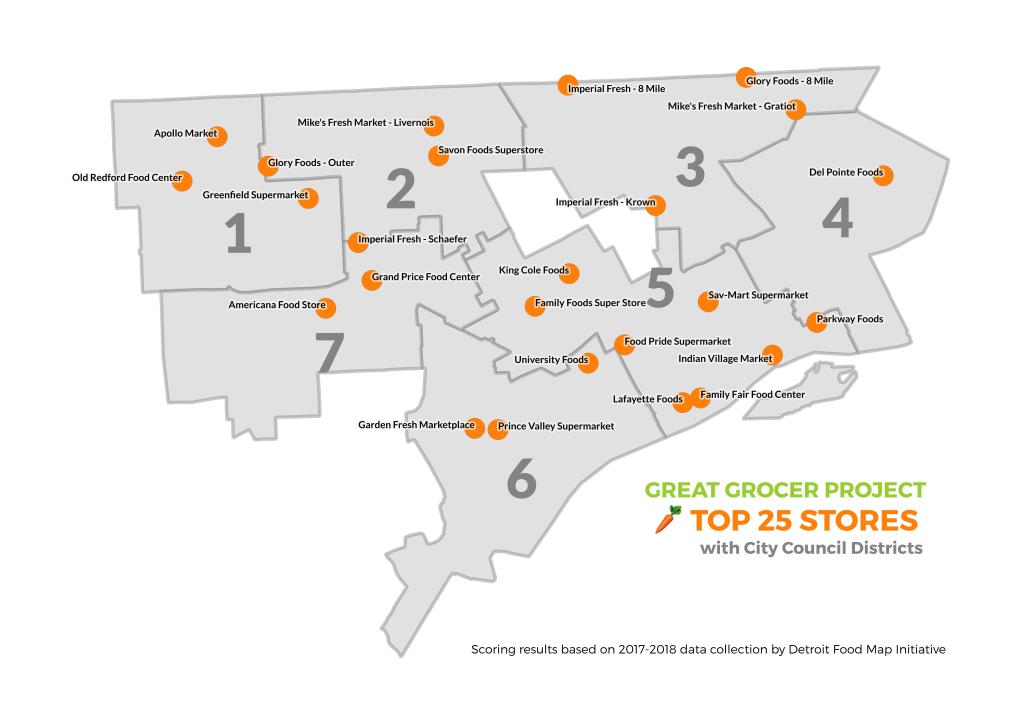
Early this month, the Detroit Food Policy Council and partners on their Detroit Grocery Coalition launched the Great Grocer Project to highlight and support improvements in Detroit’s local grocery landscape. The effort was awarded a 3-year USDA grant through partners at Wayne State University and is a culmination of nearly a decade of grocery work by the Detroit Food Map Initiative.
This map is for the top 25 independent grocery stores (excluding Meijer, Whole Foods, Save-a-Lot, and Aldi), but all 68 stores in Detroit were scored. Harper Food Center was one of the top 25 stores before it burned down in late February.
Learn more about the scoring and future efforts HERE!
In a stunning display of retail redlining, the primary corporations chosen by the State of Michigan and Federal government for COVID-19 vaccine rollout are not active or accessible across Detroit. Even those located in the city limited where they would offer vaccines with Walgreens and Rite Aid locations in Midtown clustering with no access or limited access in Detroit’s neighborhoods. CVS is only offering vaccines at 4 locations in all of Michigan with one located in Detroit.
Retail redlining and discrimination is nothing new. Door-to-door magazine sales companies practiced “bluelining” where they avoided “foreign-speaking or colored people.” The Home Owner Loan Corporation maps adapted by the Federal Housing Administration and private mortgage companies created the basis for redlining, or not approving mortgages in predominantly Black neighborhoods. Historical mapping of Green Book locations also present an important delineation of retail discrimination. Retail redlining has most often been applied to analyses of grocery and supermarket locations, which is an inequitable trend seen in metro Detroit too.
Leading up to the Great Recession, “reverse redlining” where Black homeowners in Detroit were targeted for faulty mortgage products followed by nearly no mortgages originating in Detroit. More recently there have been questions about redlining related to Pokemon Go and expanding interest in the concept as it relates to present day health outcomes.
The City of Detroit, local health system hospitals, and other partners offer a few vaccination locations outside of these specific retail locations (Walgreens, Rite Aid, CVS, Sam’s Club, Walmart). In a pandemic response supposedly driven by equity, one would assume more forethought for vaccine distribution partners in Michigan’s hardest hit city.
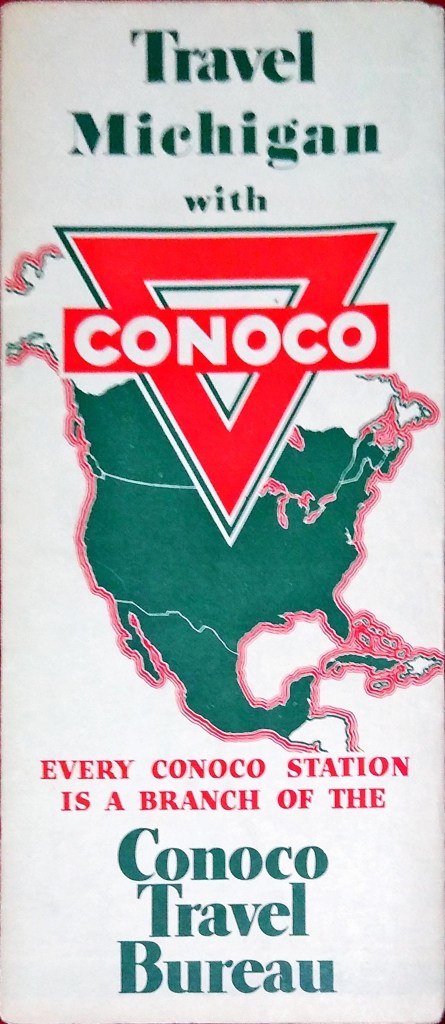
I acquired the map along with a bunch of other Conoco ones for dirt cheap at a book store in Topeka Kansas.
What made you hang it on your wall? What stood out to you? What details do you enjoy about the map?
I don’t hang this one or most of the maps on my wall due to lack of space and preservation reasons. I think the detail of the Gousha cartography firm is what stands out to me. I enjoy all the period details of the 1930s on it like Greenfield Village being labeled “Henry Ford’s Ole Time Village.”
What in your background has drawn you to maps?
I drew maps as a kid and now have geography and history degrees.
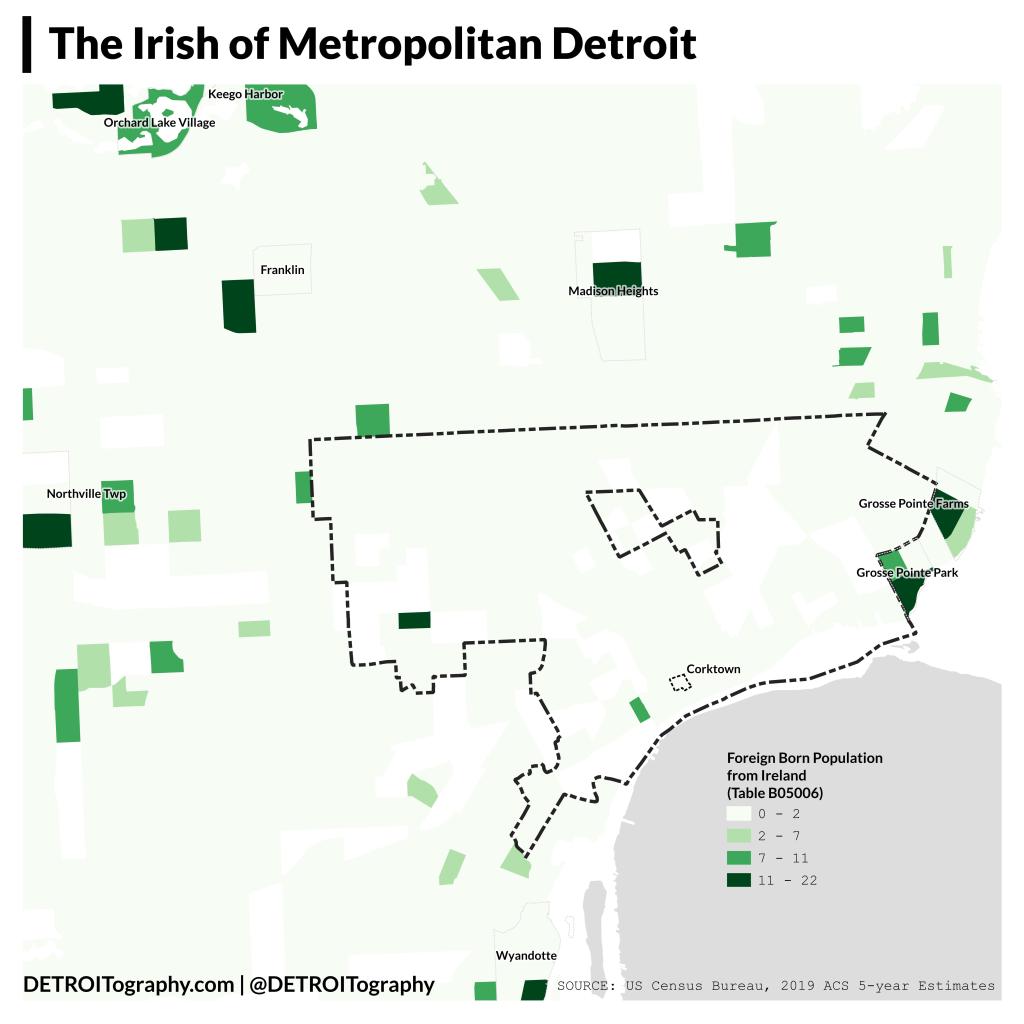
In honor of St. Patrick’s Day this week I decided to explore the Detroit region’s Irish population. This is a map only of “foreign born” people from Ireland and not those with Irish ancestry so provides a unique look at current emigration from the Emerald Isle, which is to say not many people come to metro Detroit from Ireland these days.
In Detroit, Corktown (named for County Cork in Ireland) is not the preferred landing place for Irish people, but seems further into Mexicantown and more in the Warrendale area. Metro Detroit has more Irish residents with the Grosse Pointes, Madison Heights, Farmington, Northville, and Orchard Lake highlighting.
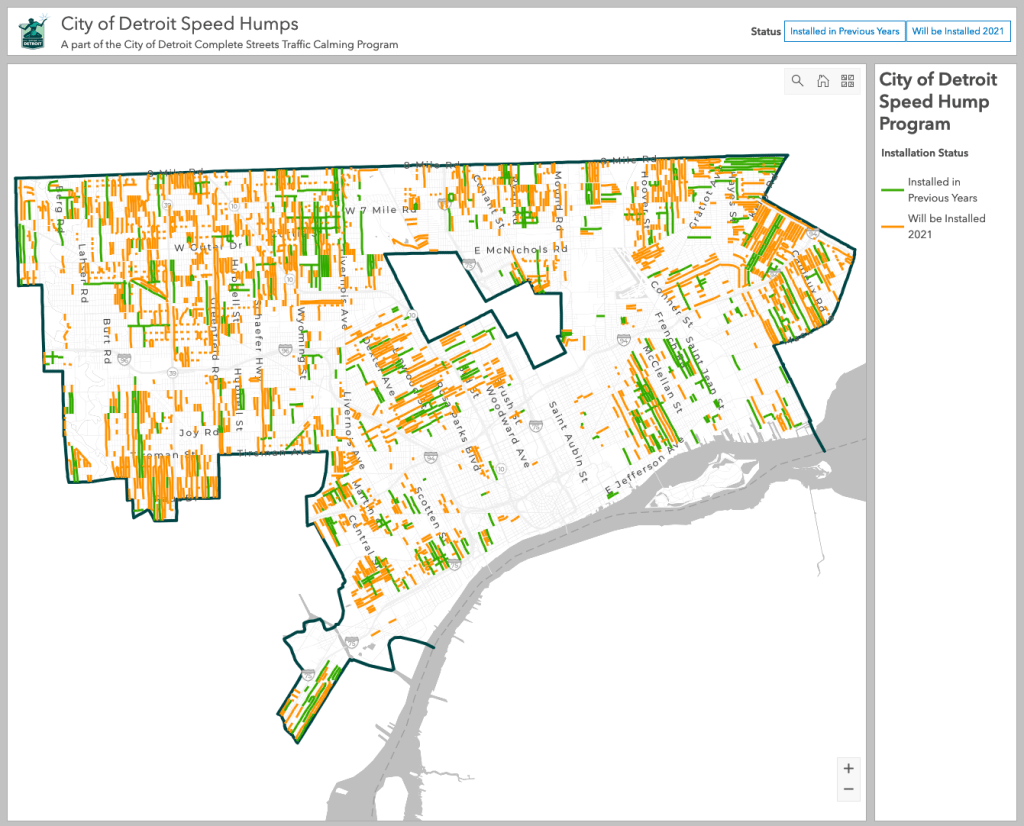
Speeding on city streets is the primary cause of Detroit’s high number of pedestrian deaths and overall roadway crashes. The City of Detroit began installing “speed humps” in 2019 and will be ramping up efforts in 2021. The most effective methods to improve roadway safety is to update the design of the roadway – in this case with speed humps.
Looking forward to seeing numbers drop for crashes and deaths in Detroit.
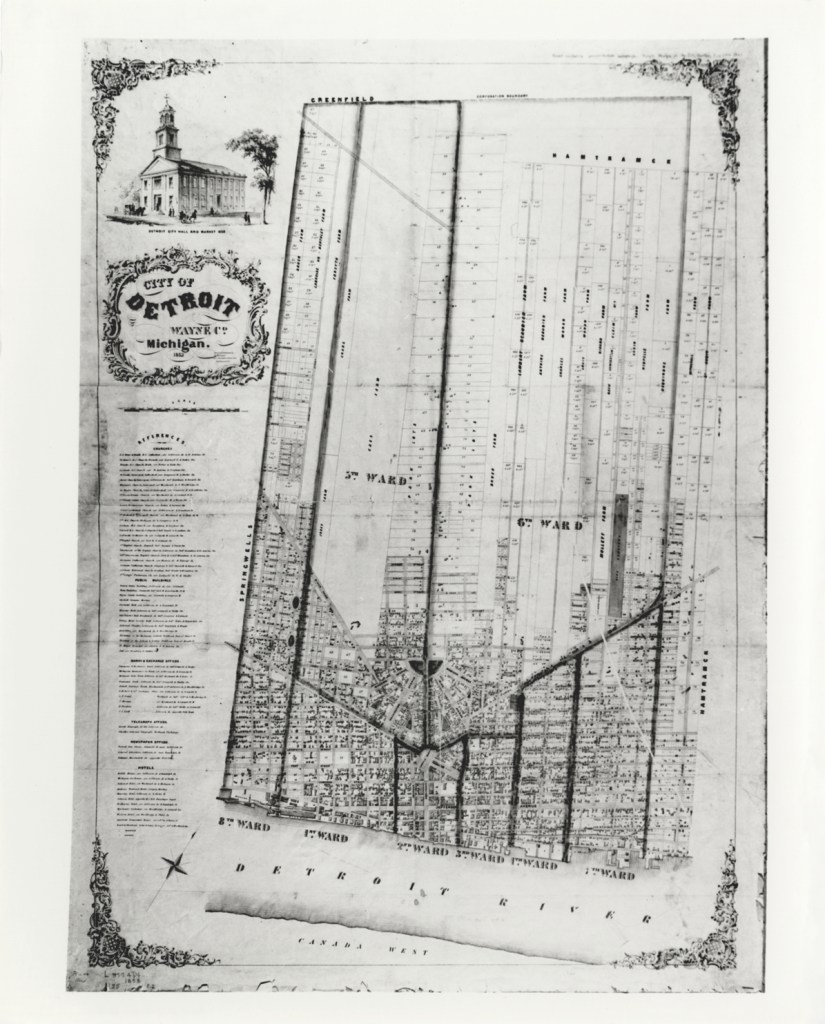
Early Detroit was divided into Wards for political and population management. These are the oldest boundaries for Wards and the lines and numbering were changed and updated.
This map had been particularly important as I worked on locating historic neighborhoods from Silas Farmer’s “The History of Detroit and Michigan.” A neighborhood called “Piety Hill” in 1884 has different boundaries than what is known in present day as “Piety Hill” near the Northend or the Registered Historic Place in Brush Park East of Woodward.
The 1853 Ward Map helped me to pinpoint the original Piety Hill in the old 5th Ward, West of Woodward and North of Grand River.
This map shows “store crowdedness.” Tripadvisor uses anonymized and aggregated “crowd data” in order to show people’s presence in stores and public spaces. This data can be changed based on the time of day and the day of the week. They hope this allows people to make decisions about where and when to visit a particular location.
You can easily pick out industry sites with a large number of employees as well as larger businesses Downtown. Interestingly, many of Detroit’s parks highlight on this map.
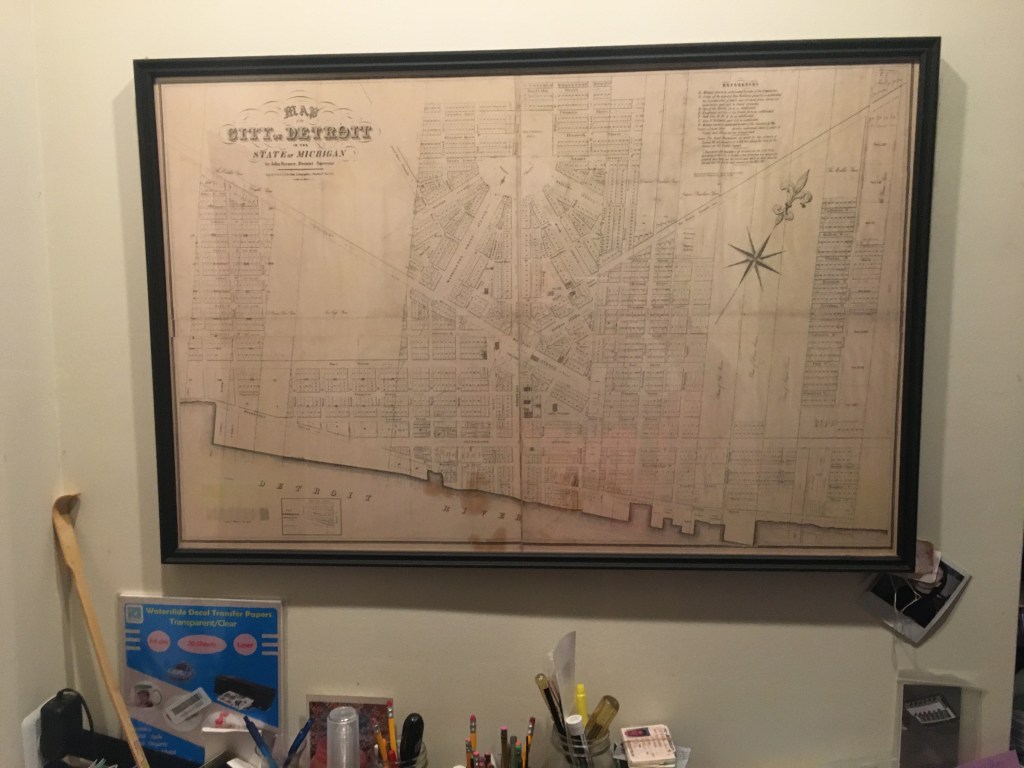
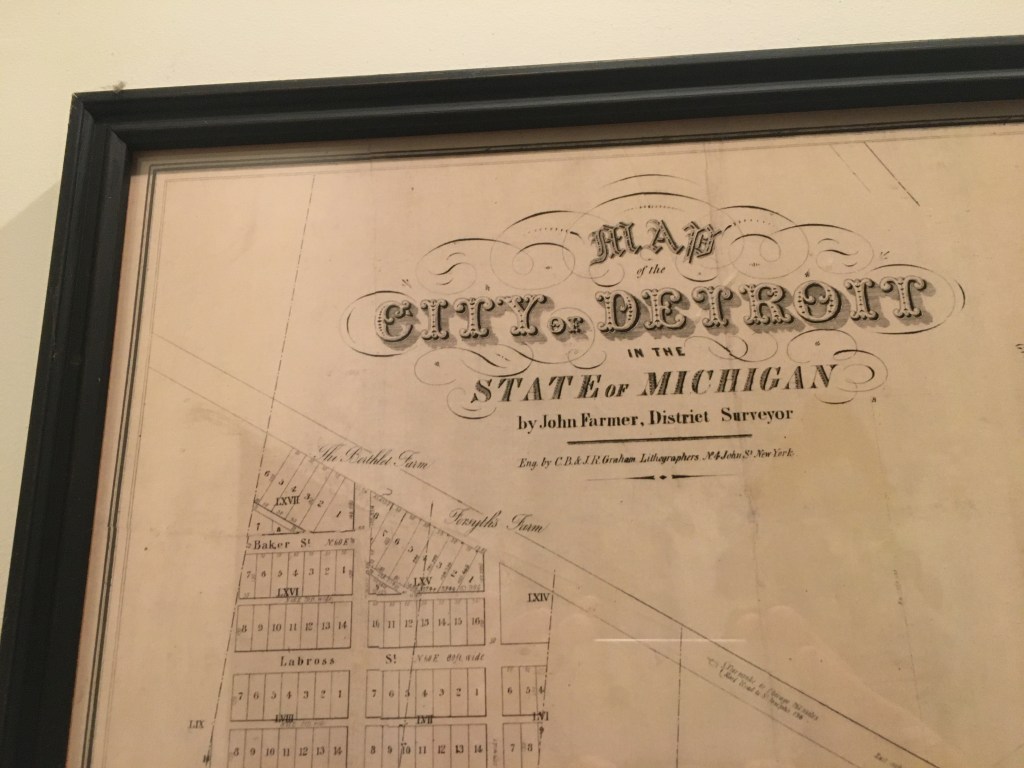
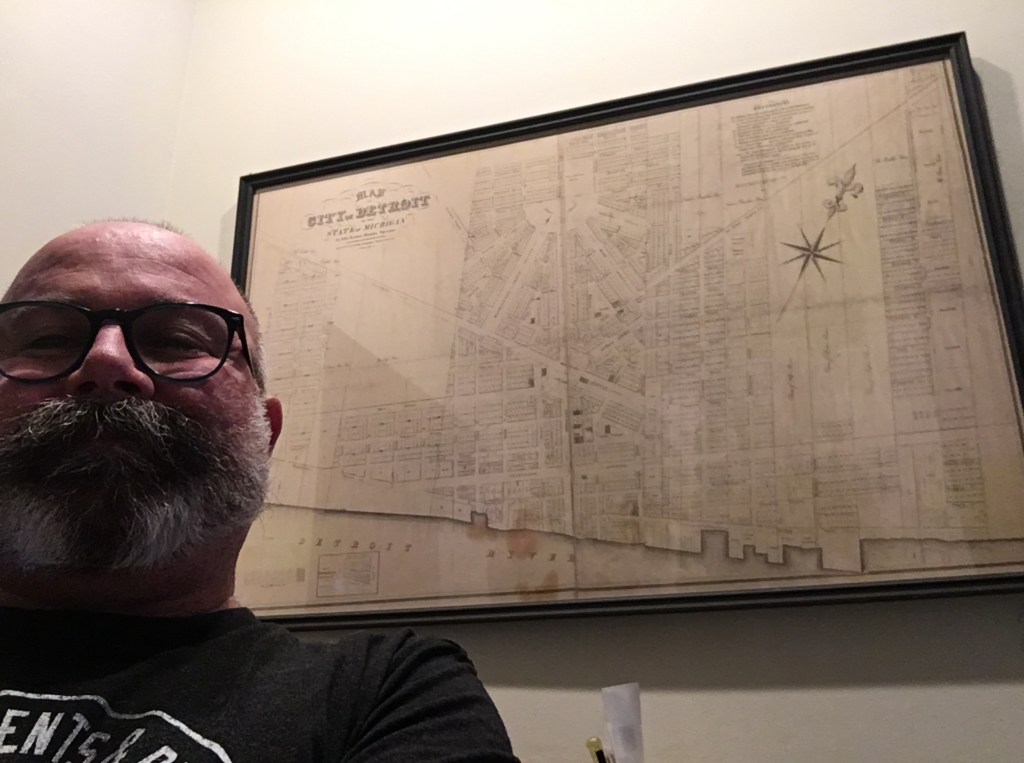
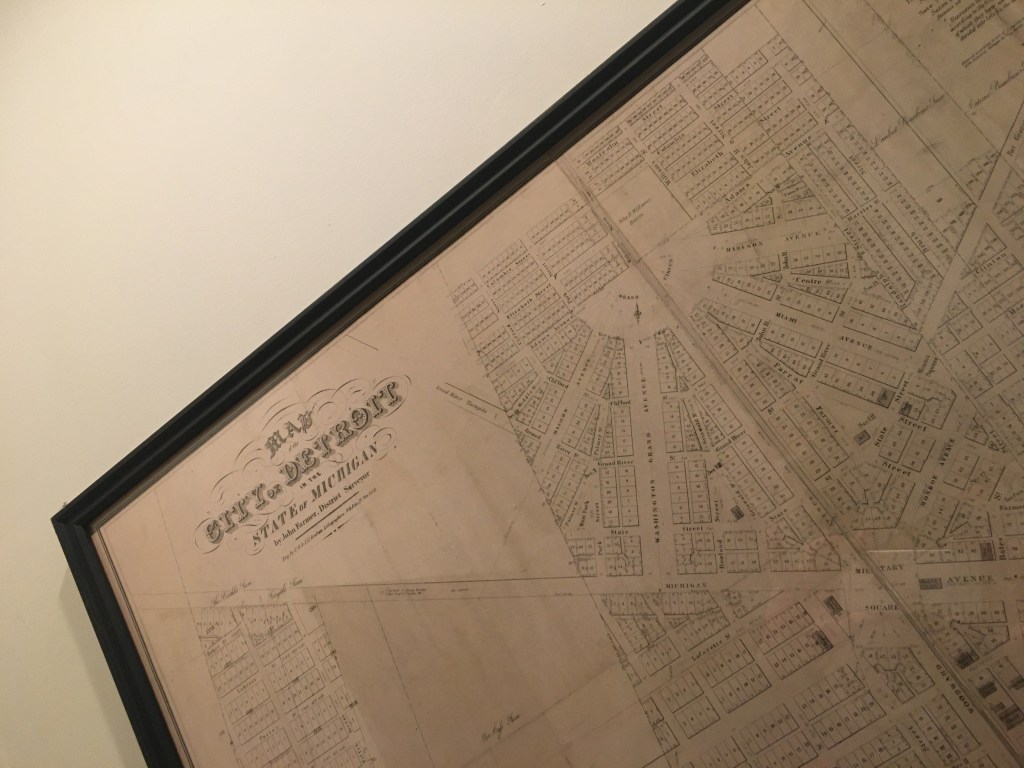
I had a service print this high quality map. They’re not hard to find. But I’ve been interested in maps of this era because of my interest in Bela Hubbard who came to Detroit at age 20 in 1835.
What made you hang it on your wall? What stood out to you? What details do you enjoy about the map?
The Woodward design is fascinating. This map shows more closely how the design went down and how it exists today, mostly. Woodward had a much more expansive plan, but political forces shifted to the grid system, likely because of the history of the vertical ribbon farms. This map is a hybrid of an aspiring vision and the eventual reality. Woodward’s vision wasn’t completely crushed, just mostly crushed. But in 2021, these streets on the radial pattern really define downtown. Woodward’s vision survives nearly 200 years later. If he could return, he’d recognize the layout.
What in your background has drawn you to maps?
As a resident of Hubbard Farms, named after the aforementioned Bela Hubbard, I’m very interested in that era just prior to statehood. I’d give anything to be able to walk those streets in 1835.
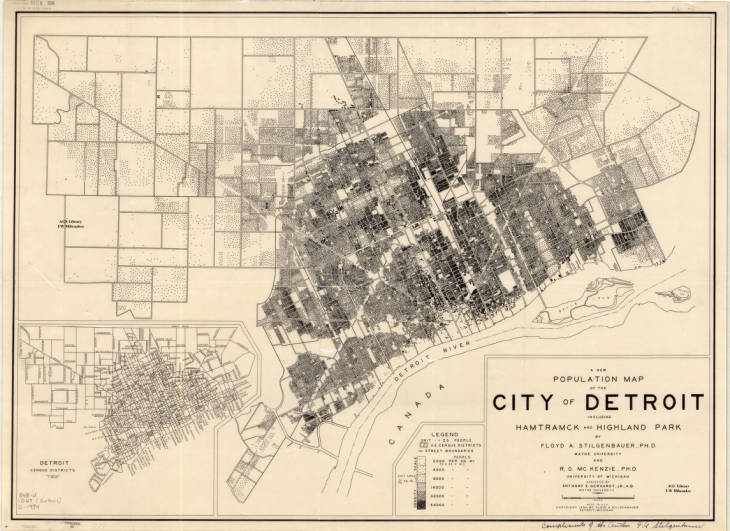
The GIS and Cartography Lab in State Hall at Wayne State University is named for Floyd A. Stilgenbauer. He was a professor of geography and a pioneering cartographer in his time. He is credited with advancing proportional symbology with the likes of Erwin Raisz as well as led the Air Cargo Research efforts to plan for the advancement of shipping via airplanes rather than boats.
A New population map of the City of Detroit including Hamtramck and Highland Park / by Floyd A. Stilgenbauer ; R. D. McKenzie ; assisted by Anthony E. Gerhardt
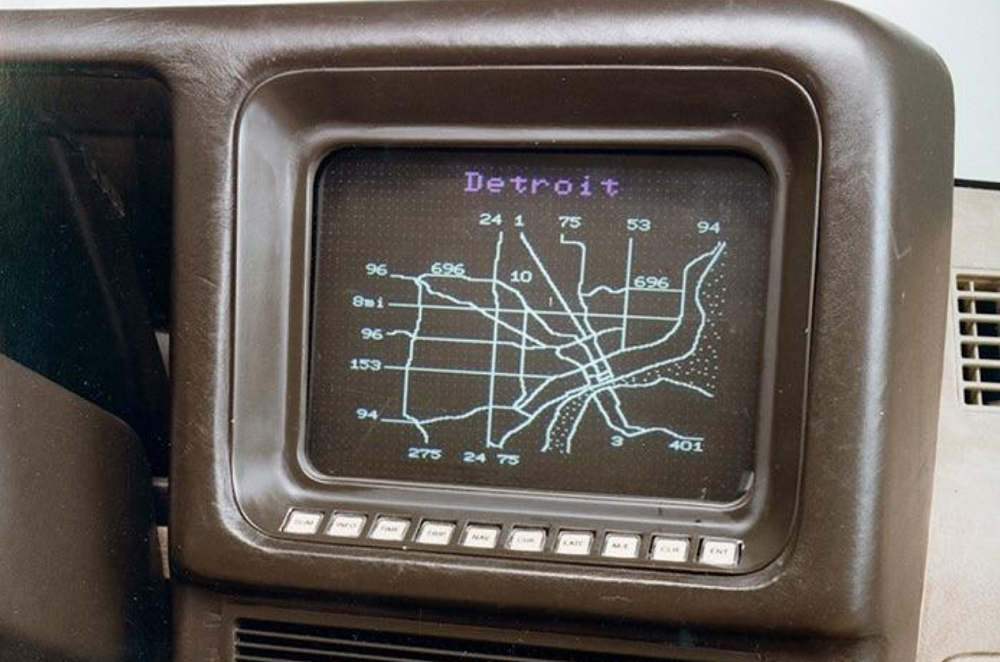
This wonderful digital map was the first implementation of GPS tracking for cars that then plotted a vehicle based on its latitude and longitude. The Ford Motor Company engineer, Mark Jarvis noted that it was accurate within 400 meters (metric?).
A commentor on reddit noted that I-696 is disconnected in 1983 because the Suburbs were still arguing over the route it would take.
The Tripmonitor was before its time, but has aided Ford in advancing this GPS car console technology.
Tripmonitor utilized a magnetic compass and a series of sensors to determine the car’s location. Once calibration was completed, software was used to compensate for the vehicle’s magnetic properties in regards to compass readings. There were obvious issues with using a magnetic compass, however. Mainly because there’s just no reliable way to filter out the effects of things like nearby transformers on GPS systems.
Aaron Foley is the Director of the Black Media Initiative at the Center for Community Media and a John S. Knight Journalism Fellow at Stanford. He is the first and former Chief Storyteller for the City of Detroit and a prodigiously published writer and journalist with work at Jalopnik, Belt Publishing (3 books + multiple essays), and BLAC Magazine (former Editor in Chief).
What is your map at home (title, year, etc.)
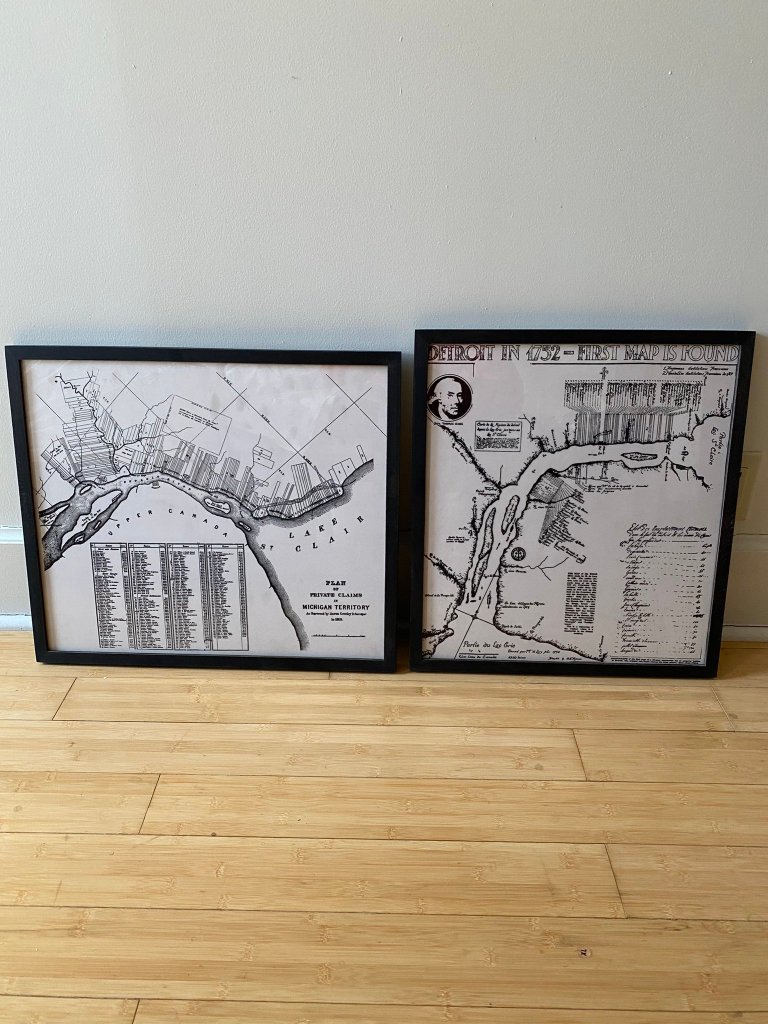
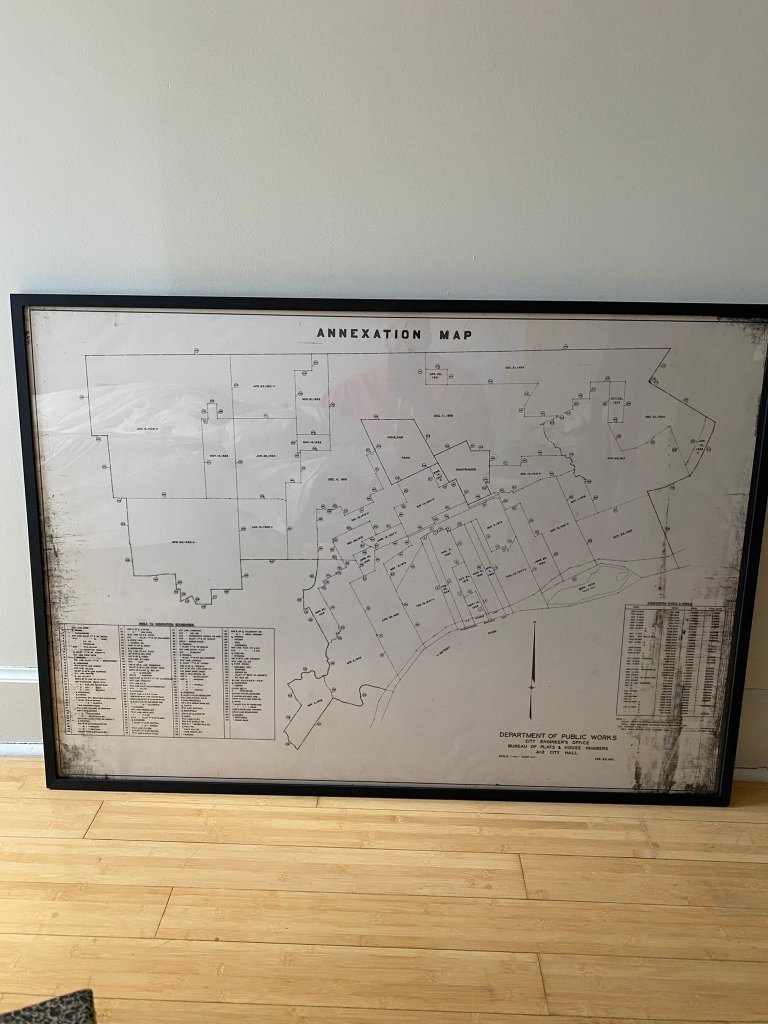
There are five maps and all of them are transparencies — I assume they were used on projectors or lightboxes at some point. One is from 1752 and purports itself as the first found map of Detroit. The second is from 1810 and is a map of ribbon farms along the shorelines of the Detroit River and Lake St. Clair. The third is a map of Wayne County from 1855. The fourth is an annexation map of Detroit from 1931. The fifth is an undated street map that highlights public land use like cemeteries and parks, but if I were to guess based on some clues, it was produced after Detroit formed its current borders in the 20s but before the Ridgemont Golf Club in East Detroit (now Eastpointe) became a residential subdivision in the 1950s.
Where did you find/acquire the map?
In 2018, the Planning and Development Department at the City of Detroit was renovating its offices and throwing a bunch of things out. I was working at the City at the time and had a meeting on their floor and scooped them out the discard pile.
What made you hang it on your wall? What stood out to you? What details do you enjoy about the map?
What stands out to me the most about each map is that each one is a record of how Detroit became Detroit. The 1752 map is mostly in French, which recalls the city’s French settlement. The map of farms has a few names that are still around today — Kirby, Rivard, St. Aubin, Campau, Beaubien. My favorite is the annexation map because each part of the city and when it was annexed is dated, and you see just how rapidly the city grew in the 1920s, particularly the west side. Then you think of the architecture of the city and how it corresponds to the dates. If you overlaid a neighborhood map on this one, you’d see neighborhoods with older housing styles, like Corktown and Woodbridge, line up with where the oldest parts of the city are dated. Same with the newer parts of the city, like where Rosedale Park is — but then you have to imagine, large swaths of the west side was rural farmland at one point. I have an image of riding a horse southeast down Grand River and seeing nothing but fields, and then boom! — you’re in a “new development” in Woodbridge in the 1910s.
I’d originally planned to hang them up in my apartment in Detroit, but life for me took some unexpected turns. I ended up doing a yearlong fellowship in California, which then segued into a job in New York. Back home, I loved having people over and entertaining and can’t wait to do that again when it’s safe, but when it is, all my guests will know where I’m from and why it’s important to me to have big reminders of that.
What in your background has drawn you to maps?
I’ve always been a Detroit history geek, and I didn’t realize it was a lifelong thing until I was going through some old papers recently and saw that I had been writing little things about Detroit neighborhoods going back to elementary school. And I’ve been a map fiend too — one of the best (or worst?) things my mother ever gave me as a kid was a world atlas she used as a kid. And now that I’m thinking about it, I used to flip through our Rand McNally road map book of Metro Detroit just for fun, and ended up memorizing a bunch of street names on all sides of town. Part of it too is just how big Detroit is, land-wise, and how much you can still learn about the city, even if you’ve lived there your whole life.
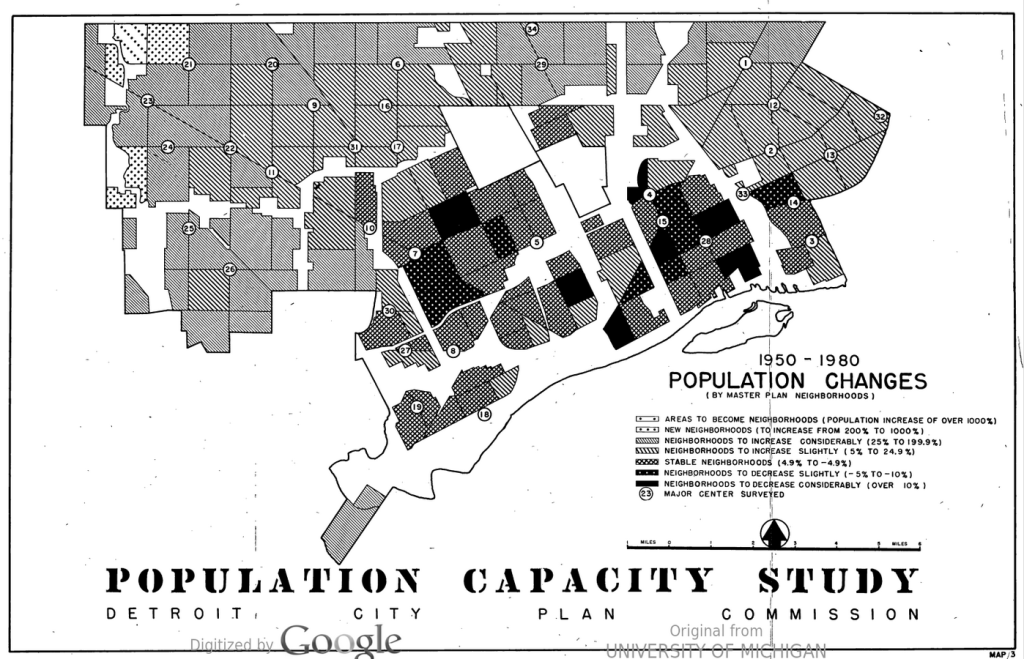
Detroit’s urban core lost significant population between 1940 and 1950. The City Plan Commission’s report in 1954 projected further loss through 1980. With hindsight at 20/20, it’s seems unimaginable that Mayor Cobo would push forward on efforts to clear more vacant land (Black Bottom) in the name of redevelopment when the expectation was to lose population in the urban core anyway or perhaps it was foreshadowing “urban renewal” plans?
Ashley Flintoff is the Director of Planning and Space Management at Wayne State University and an alum of the University of Detroit Mercy’s architecture and Master in Community Development programs as well as WSU’s Master in Urban Planning program.
What is your map at home (title, year, etc.)
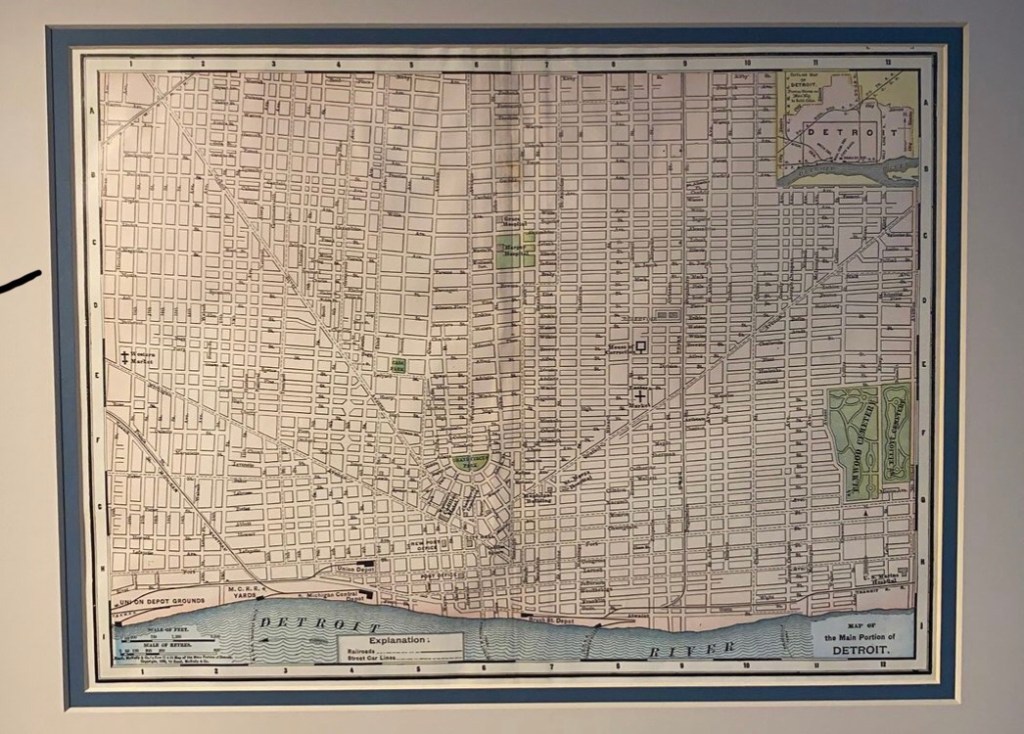
“Map of the Main Portion of Detroit”, Rand McNally Co., dated 1895
Where did you find/acquire the map?
I found it at a booth in Washington D.C.’s Eastern Market (ironic, I know!)
What made you hang it on your wall? What stood out to you? What details do you enjoy about the map?
I love that this map overlays specific amenities such as Eastern and Western Markets, select train depots and hospitals on a familiar street grid. The decision as to what locations to highlight is fascinating to me. It’s hanging in my living room with art depicting my favorite cities: Detroit and Baltimore.
What in your background has drawn you to maps?
My background is in architecture, community development and urban planning so I love how maps communicate the world through graphics.
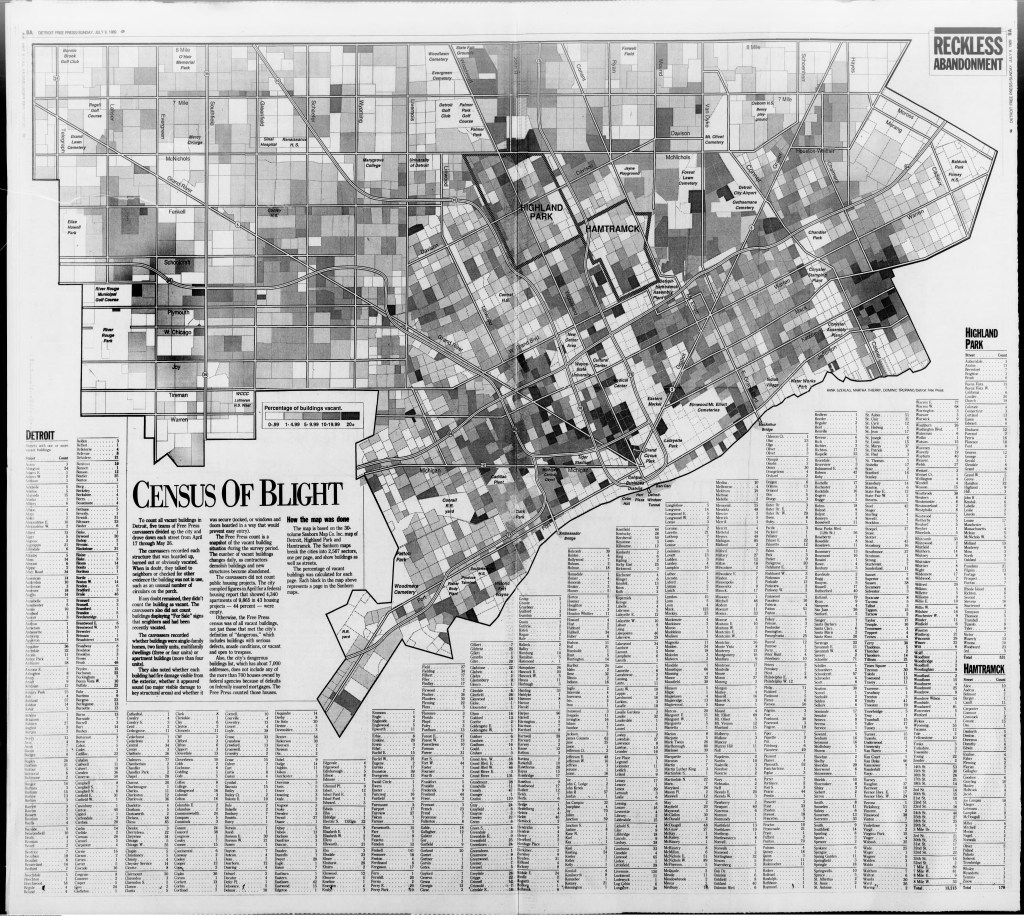
Data collection that catalogues the condition of every property in the city has been an on-going saga that began with the Detroit Housing Commission in the 1940s to inform “urban renewal” projects and most recently included the 2009 Detroit Residential Parcel Survey and the 2013 Motor City Mapping efforts. As far as I know there were no efforts between 1989 and 2009 to catalogue “blight” although blight reduction and demolition were a focus of every Mayor since 1940.
The Detroit Free Press’ “Census of Blight” was a seminal effort led by journalists after previous efforts were housed in quasi-governmental authorities such as the United Community Services, and then a handful of non-profit and private entities.
Citywide “blight” surveys:
1940 – Blighted Areas, Detroit Housing Commission
1960 – Deteriorating and Dilapidated Properties, United Community Services of Metropolitan Detroit
1989 – Census of Blight, Detroit Free Press, 1989
2009 – Detroit Residential Property Survey (DRPS), Michigan Community Resources (MCR) and Data Driven Detroit
2013 – Motor City Mapping, Detroit Blight Removal Task Force, Loveland Technologies, and Data Driven Detroit
A map of Lake St. Clair might not seem to fit on a site all about Detroit. However the lake is a significant piece of Detroit history as it led to the narrow “strait” off of the lake where we now say Detroit. Cadillac’s 1702 map of Lake St. Clair is one of the earliest cartographic depictions of Detroit. Lake St. Clair is sometimes called the “sixth Great Lake” because of its size and significant.
What is your map at home (title, year, etc.)
Al Engler’s Fishing Guide of Lake Saint Clair / 1950’s?
Where did you find/acquire the map?
Some friends rented a now demolished mansion on Riverside Drive in Windsor back in 2005 to film a movie. It’s at the end of Pillette Road, which is directly across the river from the Dossin Great Lakes Museum on Belle Isle. One night after filming we decided to venture into the basement, and this map was hanging on the wall. I took it home and framed it and have been putting it up on the walls of our homes since then. It now resides on the kitchen wall in our house in Denver.
What made you hang it on your wall? What stood out to you? What details do you enjoy about the map?
I grew up on Lake St. Clair, and in Windsor and Detroit this is our “Great Lake”. The details are outstanding, and it’s not just a map but almost a brochure about the lake and surrounding area. There are notes about the types of fish and where is best to catch them, historical events mapped out across the lake, notes in the surround about other places to visit, tidbits about “Canada”, and even a note about the Jack Miner Bird Sanctuary in Essex County. I know of one other version of this, newer and more colourful, at a friend’s place in Windsor. The only other one I’ve seen is in a scene from the movie Gran Torino in Clint Eastwood’s basement.
What in your background has drawn you to maps?
Maps have been a companion to my travels since a young age. Communication and graphic design meet perfectly for me with mapping technology, and my work with Denver Public Schools has brought a new use of spatial information. I also married a cartographer!
Effective January 1, 1921 the City of Detroit renumbered its street addresses. The Federal Lithograph Company with Frischkorn Real Estate Company produced this map to explain the numbering changes. Notably, the numbering on Grand Boulevard and in the Grosse Pointes, River Rouge, and Oakwood (later annexed) did not change.
Detroit had not yet annexed all of its current land, so you can still see Redford Township and Dearborn Township on Detroit’s present day Westside. Rouge Park only appears as “Detroit City Park” and Outer Drive is noted along its proposed route. Frischkorn Real Estate speculated to acquire land the along Warren Avenue in future Detroit. They later sponsored the Grandale and Grandale Gardens (Redford) developments just south of the “Russell Municipal Aviation Field.” I previously thought this was the current Aviation Subdivision, but that is further south and along the Detroit/Dearborn border.
Another oddity on this map that I think I got wrong before is that this map includes both Hamtramck city and Hamtramck Township. The northern sliver that was left of Hamtramck Township was annexed by Detroit just two years later in 1922.
Contact
Submit a map or just get in touch. Thanks for following!