Map: Paradise Valley, the Original Innovation District

Race_Dwelling_1940-V2

History is the most crucial context of any city. In thinking about the “lifecourse of place,” or the evolution of a particular geography over time, socio-demographics provide deep insight.

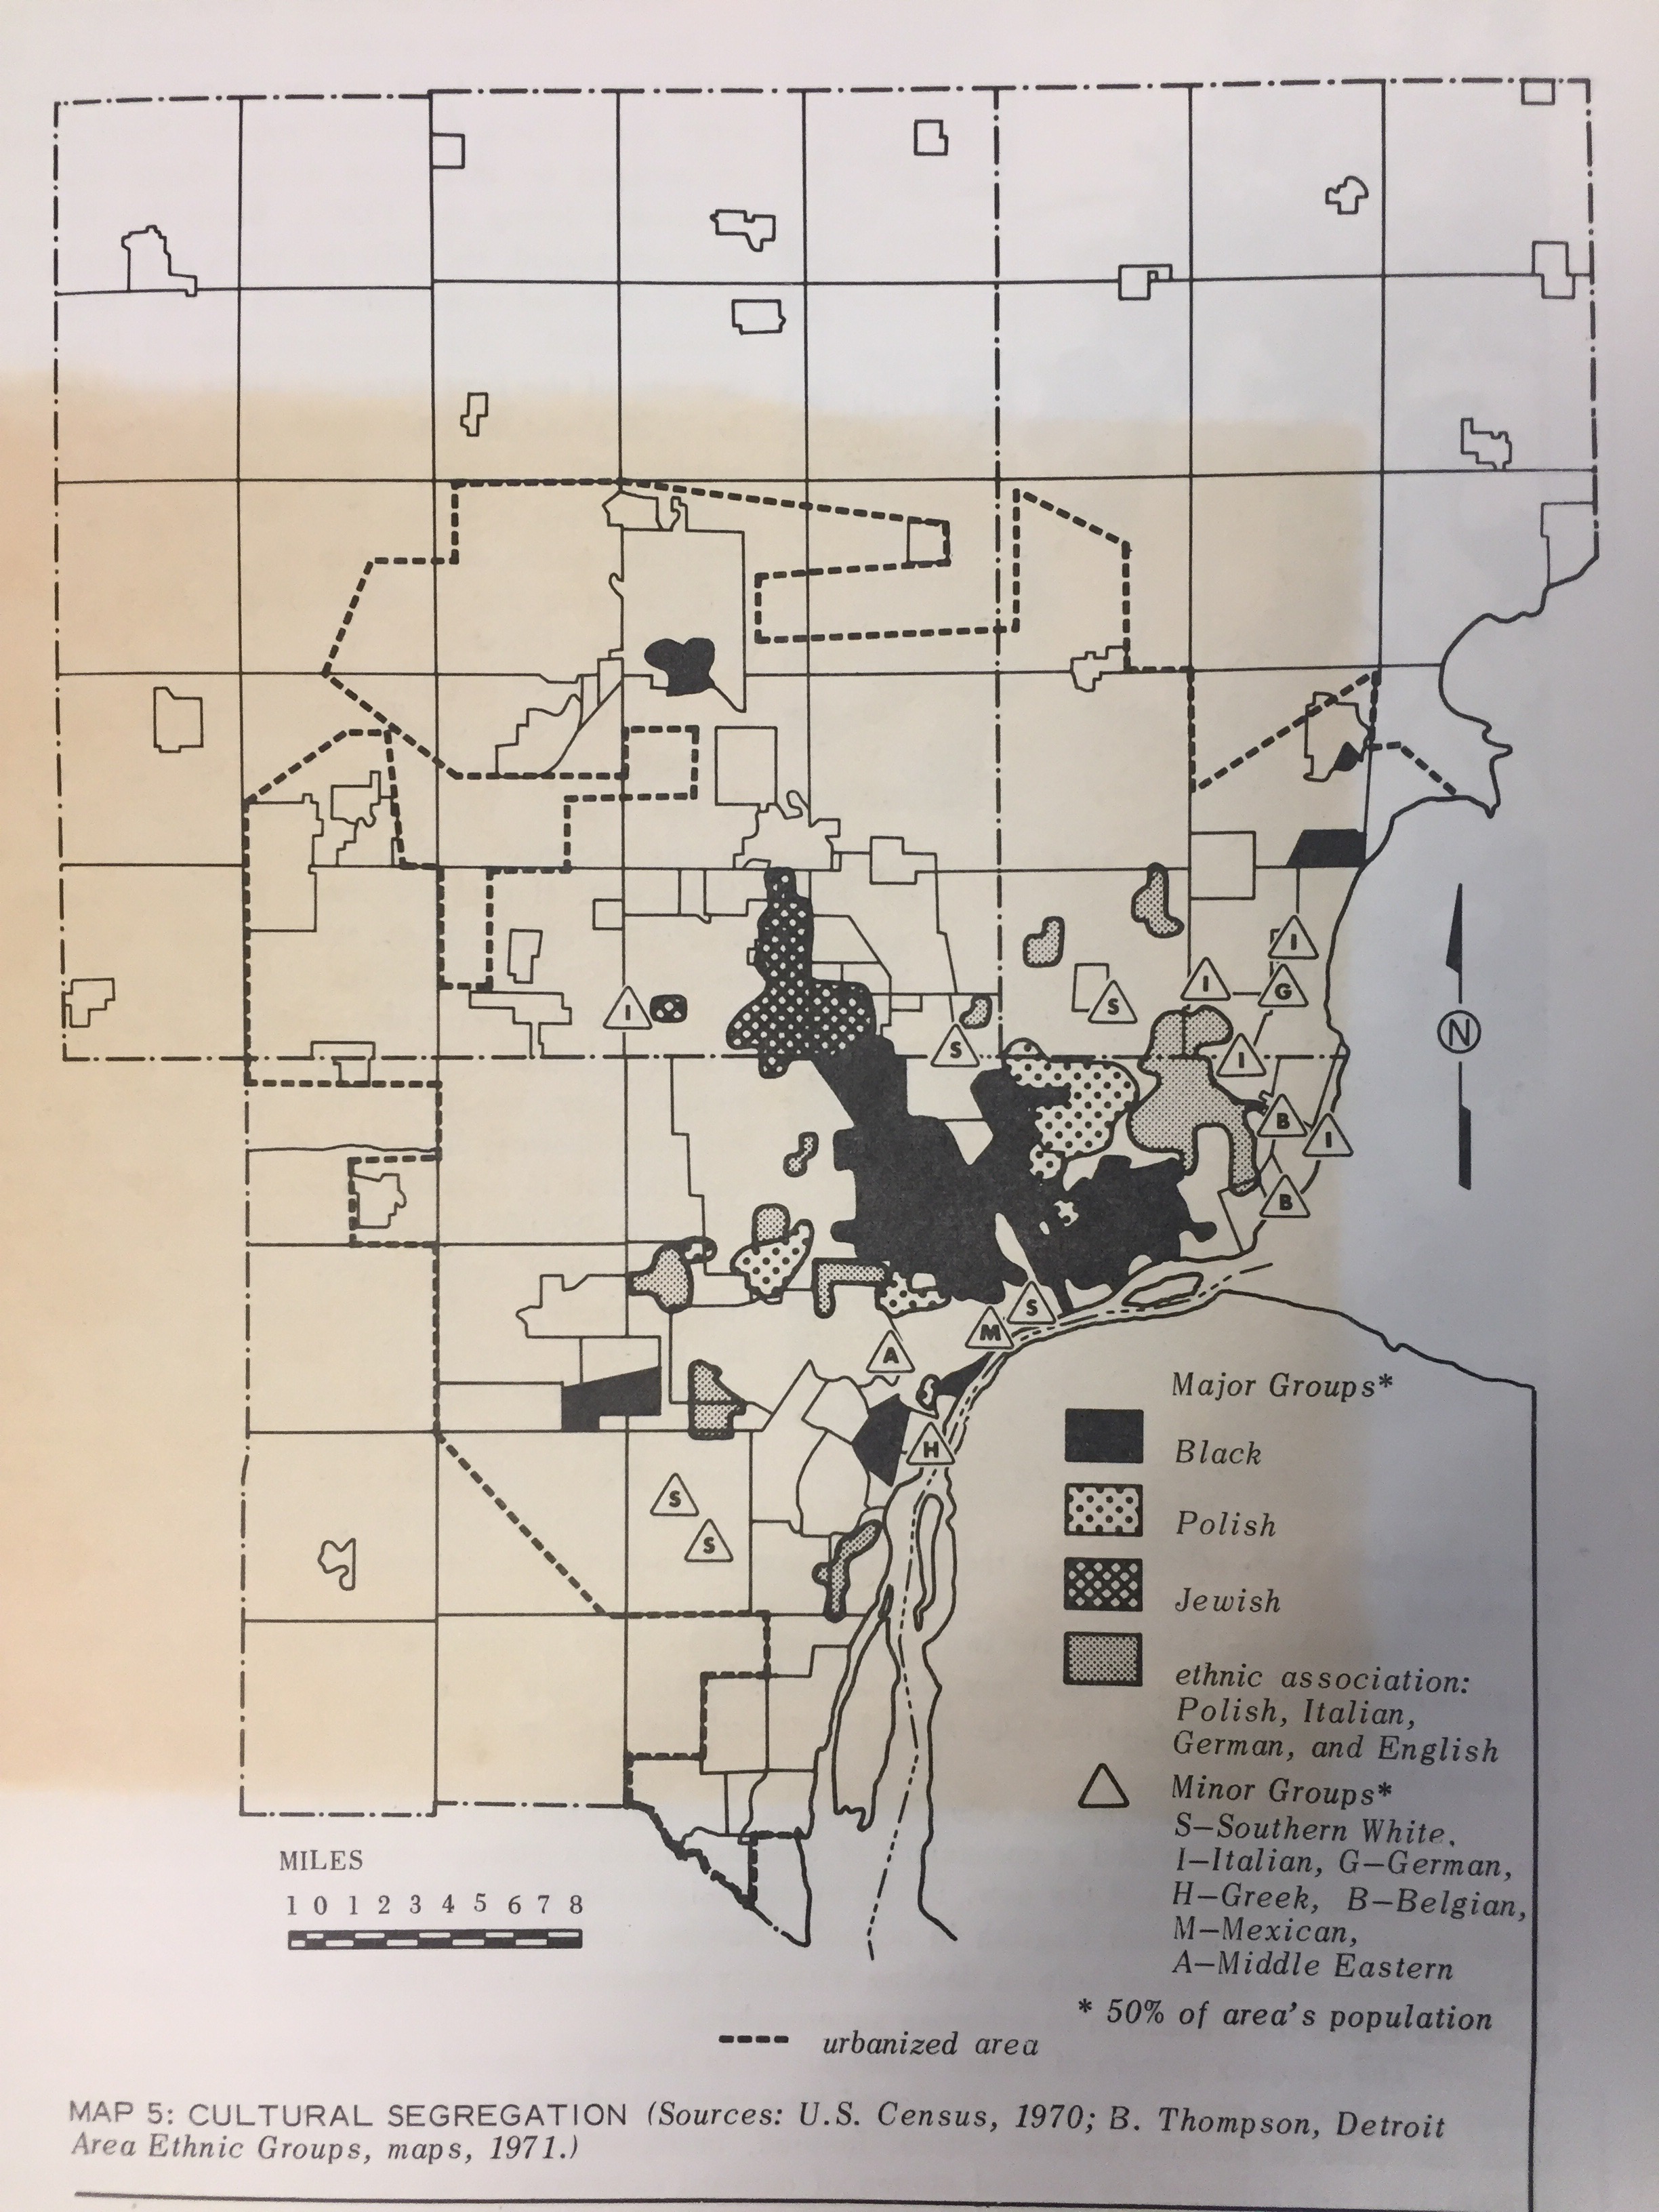
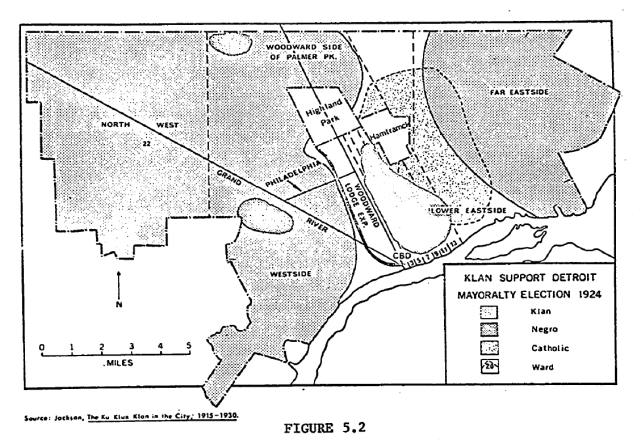
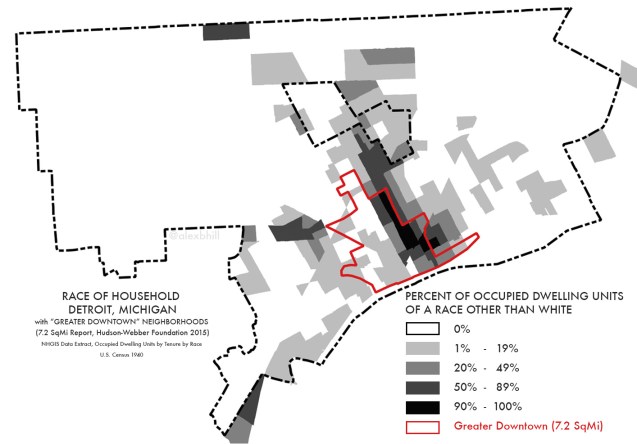
Detroit’s Black community was restricted in where they could legally purchase housing, so there had long been a concentration of Black households in the Paradise Valley area, north of Black Bottom.

Overlaying the current 7.2 square mile boundary onto this map of 1940s non-white households give stark contrast between history and current redevelopment.

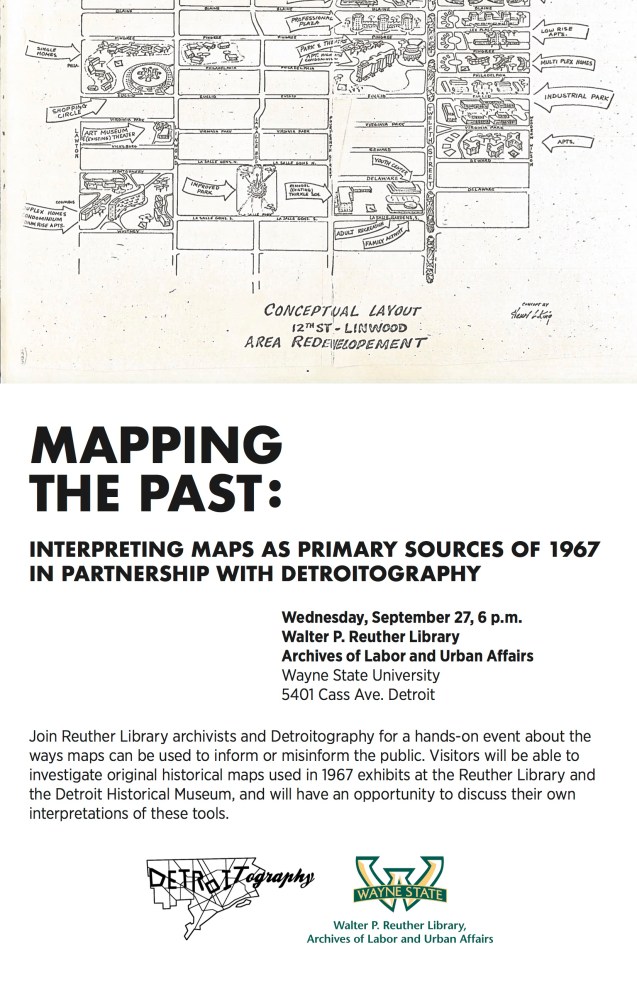
Map originally presented by Josh Akers’ in a Book Review of Rebecca Kinney’s book, “Beautiful Wasteland: The Rise of Detroit as America’s Postindustrial Frontier.”

Map: Open Space Pattern Plan 1970

This proposed map of open space and green pathways was included in the beautifully designed plan “Detroit 1990: an Urban Design Concept for the Inner City” from the Department of City Planning.

The plan broke the Greater Downtown area into “subdistricts” and this particular plan of pedestrian pathways imagines linking all the subdistricts together. From the planning report:

“Each  cross-city link connects to major centers: on the eat to Forest Park via the community college; no the west to a continuation of Wayne’s campus and to the shopping triangle of West City. These links together with the major pedestrian bridges to the CBD and New Center are important as intelligible symbols of the continuity from district to district and encourage a sensible sequence of related-ness from district to community to city.”

Map: Detroit Multifamily Housing 2016

multifamily-housing-2017.png

In the 2016 report, “Detroit Inclusionary Housing Plan and Market Study” prepared for the City of Detroit Housing and Revitalization Department (HRD) HR&A Advisors, Grounded Solutions Network, and Capital Impact Partners found that Detroit remains a single-family home market based on overall stock.

However, there is significant multifamily housing stock with over 125,000 units concentrated in Greater Downtown. Greater Downtown is a renter market, but has seen positive growth and a reduction in vacancy rates, down 11% between 2005 and 2015.


Map: Detroit Highway Construction Benefit Cost Ratio 1955

Screen Shot 2017-10-18 at 8.11.08 AM

This map is included in Part 2 of the Detroit Metropolitan Area Traffic Study of 1955 by the Michigan State Highway Department. You can see I-94 and the M-10 Lodge Freeway were already complete, but considerations were being made to expand and add more highways. On page 118, it notes:

“Yet there are considerations of land costs; of property removal; of financial responsibility; of classes of trips with relatively greater need; and of public acceptance and rapidity of possible building.”

Not enough weight was given to the consideration of racially disproportionate impacts and wholesale destruction of Detroit’s Black community center where I-75 now lies.

Interestingly the highway proposed along Jefferson Avenue has ratios of 2.3 for every segment making it the highest benefit cost ratio on the map, yet was a highway that was never built. The outcome of that can be seen in the 1968 map of “Where communters run over Black children on the Pointes-Downtown track.” What if that highway had been built?


Hand Drawn Map of Detroit International Bridge Crossing 

Hand drawn maps are super fun!

This map was included with a hand out that highlights the potential impacts of the “New International Trade Crossing” bridge to Canada, better known as the Gordon Howe Bridge. Community members have raised concerns about land rights and increased truck pollution in their neighborhood.

The area presents a great opportunity for carbon buffer forests to limit effect of truck exhaust on residents.

Map: Detroit Cultural Segregation 1971

This map was included in Judy Humphrey’s publication titled: “Segregation and Integration: A Geography of People in Metropolitan Detroit” and utilizes data from the “Detroit Area Ethnic Groups” map from 1971.

“[…] anyone familiar with Detroit can attest to the persistence of ethnic tradition and cohesiveness. In addition to a voluminous number of ethnic organizations, clubs, churches and bars, there are ethnic -language radio hours and newspapers, and of course the specialty food shops and restaurants that give variety to the central city. The map of cultural groups (Map 5) gives spatial form to the patterns of ethnicity.”

Event: Mapping the Past – Interpreting Detroit Maps from 1967

Mapping_the_Past_11x17__1_

Join staff from the Reuther and DETROITography on September 27 at 6pm for a hands-on event exploring the ways maps can be used to inform or misinform. Visitors will have a chance to work with original maps related to Detroit’s 1967 Uprising that have been used in exhibits at the Reuther, Detroit Historical, and in films such as Kathryn Bigelow’s “Detroit.”

Map: Uneven Subsidies for Development in Detroit 2015

Subsidy and mission_Urban Institute_Mission Figure 5-01_i

The Urban Institute’s recent report highlights the uneven investment and development in Detroit. The report found that tax subsidies disproportionately favor downtown and Midtown, which received 57 percent of state, federal and local tax subsidy investments from 2013 to 2015.

“This combination of growth downtown and more limited investment in outer neighborhoods … can make Detroit appear to be a ‘tale of two cities'”

Workshop: Data, Mapping, and Research Justice

coopen_banner_data-300x300

It’s that time again. I’ll be teaching my workshop on data and mapping again this October 2017 with Allied Media Projects/ Co.Open.

During the 4-week course we will journey through the entire mapping process; from paper survey to digital database, basic map visualizations, and finally analysis. We will be working with free and open source software (LibreOffice, QGIS, Inkscape, etc.).

Check out some of the past course projects:

Thursday nights in October (4 weeks long) 6-9pm

October 12th – November 2nd

Sign up! HERE

Map: Stereotype Your Detroit Neighborhood

Screen Shot 2017-09-11 at 7.13.47 AM.png

Launched in July, Hoodmaps crowdsources categories for more than 200 cities. The project comes from a common problem for city lovers. As the creator Pieter Levels says:

“I very often end up in the tourist center. I’m originally from Amsterdam and I know 90% of tourists will never get any idea about the ‘real’ Amsterdam because they just stay in the tourist center.”

However, Martín Echenique at CityLab notes the dangers of a crowdsourced project to categorize neighborhoods based on past app projects that have become tools for racism (i.e. SketchFactor, Airbnb, NextDoor, etc.).

The categories users can choose from are also quite limited, not to mention white-centric. The stereotypes speak mostly to how wealthier, white people might see a neighborhood—the ”hipster” label is especially common in lower-income and more diverse parts of cities, while “normies” is so vague that it’s nearly useless for understanding anything about an area.

It appears so-far that 50 people have contributed to color-coding and tagging Detroit neighborhoods. Could this be a useful app, an exercise in futility, or another tool for coded racial prejudice.

Map: Basketball Hoops per capita for Children in Detroit 2017

hoops-per-child

Basketball is the most popular sport by far in Southeast Michigan according to the “State of Play” report by the Ralph C. Wilson Jr. Foundation. A friend asked me last month if there was any data on all the basketball courts in the city. I knew that the parks kept track of amenities, but that wouldn’t capture all the available courts and hoops in the city that might be located at schools, churches, etc.

I embarked on the joyous adventure of combing Detroit from the skies via Google’s Satellite Imagery and a grid of the city. Basketball courts, it turns out, are fairly easy to spot because of the size of paved space needed, the signature painted lines, and the shadow of basketball poles. Surprisingly, many schools do not have outdoor basketball amenities and many churches have partial courts in their parking lots.

This was in no way a vetted and comprehensive analysis because likely I missed numerous courts and hoops. I specifically didn’t count hoops that were set up on residential streets and indoor courts were also not assessed. Similar to the access to park acres, there are many areas of the city with a high number of children and a lack of basketball hoops. Indoor hoops may make up the difference, but those may take longer to identify and assess.

Hand Maps Provide Reference for Detroit Geography

IMG_5100

Detroit is a big city with a deep history and so many old and new things happening all the time that it can be near impossible to give anyone a “brief” introduction to the city.

If you’ve ever talked with me, you know that I always start with a hand map. I find it gives people a quick relatable reference. People know more than they think and when they can place the Fisher Building related to Belle Isle they are on track.

The funny part of the hand map is that it focuses geography within Grand Boulevard. Most people try to use their whole hand to represent Downtown and Midtown. This becomes another helpful reference lesson that there is so much more beyond the hip core of Detroit.

These hand maps come from an introductory session with the Detroit Fellows from Humanity in Action.

IMG_5093

IMG_5099

IMG_5091

IMG_5089

Map: Creative and Cultural Industries in Detroit 2012

Screen Shot 2017-08-28 at 8.38.41 AM

This map created by Data Driven Detroit and Miller Dickinson Blais accompanied a Kresge Foundation report called “Creative Vitality in Detroit: The Detroit Cultural Mapping Project.”

There are likely many small spaces and organizations that have come and gone since 2012, but I would assume that the distribution and density has remained the same.

Map: Pharmacies are Detroit’s Closest Retail Amenity

Detroit-Pharmacy-Map

In the March 2017 report, “Going the Distance: Big Data on Resident Access to Everyday Goods” the J.P. Morgan Chase Institute identified pharmacies as leading accessibility point for Detroit residents. The report compared data for both New York City and Detroit and found that in both cities the majority of residents shopped for retail goods outside of their 20-min neighborhood area.

Pharmacies came in at #1 with an average distance of 0.9 miles away with grocery stores a close #2 at 1.4 miles on average. The analysis was run with ZIP code filling in for neighborhood and ZIP code centroid being used to calculate distance which causes some issues when trying measuring distance of residents to retailers. The analysis was limited by ZIP code due to use of a credit/debit transaction database that only geotags ZIP code.

Map: Klan Support in Detroit Mayoral Election 1924

Screen Shot 2017-08-23 at 8.32.38 AM

This map was created by Donald Deskins Jr. as part of his PhD dissertation on “Residential Mobility of Negro Occupational Groups in Detroit 1837-1965” at the University of Michigan in 1971.

He wrote:

“Immediately following World War I, Klan membership in Detroit numbered in the thousands. […] Claiming a 200,000 local membership, this group was very active during this period. So active in fact that the Klan-supported write-in candidate would have become mayor of Detroit in 1924, had it not been for 17,263 ballots which were declared invalid due to misspelling, etc.

Figure 5.2 portraying the areas in Detroit where Klan support was strong, makes it apparent that the Klan support was almost ubiquitous except in ethnic areas on the east side and in the Negro community. Strongest Klan support was located between the city’s two major Negro enclaves in the triangular area defined by Grand River, Philadelphia and the John C. Lodge Expressway.

Map: Detroit and the 2017 Solar Eclipse

detroit-eclipse-17

Detroit is not in the “path of totality” that will see the moon 100% obscure the sun, but we will be in a prime location to experience 80% obscurity.

As far as I can find there is only one event in Detroit to see the solar eclipse. The Michigan Science Center will be open from 12:00PM to 5:00PM. They note that the eclipse will happen between 1:03PM and 3:47PM with 2:27PM being the best time to see the most of the eclipse.

DO NOT LOOK DIRECTLY AT THE SUN!

EVER!

NOT EVEN DURING THE ECLIPSE. DO NOT TRY TO VIEW THE ECLIPSE THROUGH A CAMERA OR CELLPHONE.

Map: Detroit’s Pet Service Desert

aa-so16-detroit-map-800

Yet another layer to the “food desert” metaphor has been added by new efforts from the Humane Society called “Pets for Life.”

Through Pets for Life, The HSUS has led the charge to make pet care services more accessible, preserving the bond between families and their companions and flipping that statistic on its head. Around 80 percent of PFL clients with unaltered pets end up getting the surgery done through PFL.