Map: Fast Food Industry in Detroit 2017

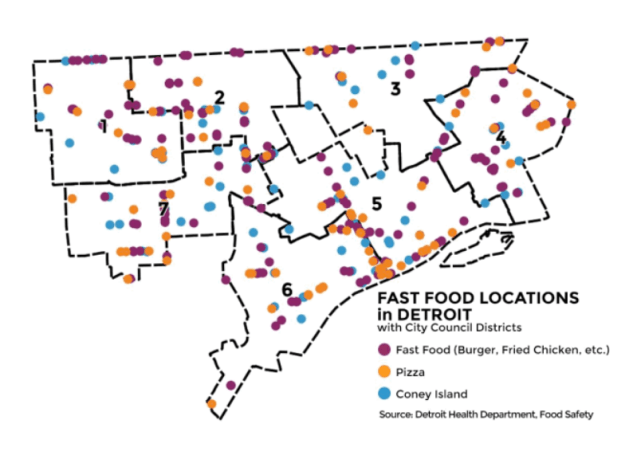
Screen Shot 2018-06-01 at 8.20.17 AMDetroit’s #2 food industry by revenue is fast food. Detroit has local chains on top of national brands. We are home to and/or birthplace of 5 different pizza companies (Little Caesar’s, Domino’s, Buddy’s, Papa’s, Happy’s). Coney Island may not completely fit into the fast food category, but accounts for a high amount of carryout food in Detroit and gets it’s own special category.
What this map doesn’t show are all the other non-chain fast casual and carryout locations in Detroit.

Read more in the full 2017 Detroit Food Metrics Report here.

Map: Fantasy Detroit Subway

DTA-full-map-fantasy-detroit-subway-map

This transit fantasy map comes from Mike Weiss who modeled it after the Chicago “L.” Although Detroit had scrapped plans for a subway, the rapid transit planners generally recommended an elevated rail like Chicago’s based on Detroit’s size and dispersed population.

“By using a population density map, I mapped corridors to connect the highest density areas and areas where the lack of density could spur development. Then, using my knowledge of rail transit planning, I planned routes that could operate efficiently end-to-end and where connections between them made the most sense.”

HT @DailyDetroit

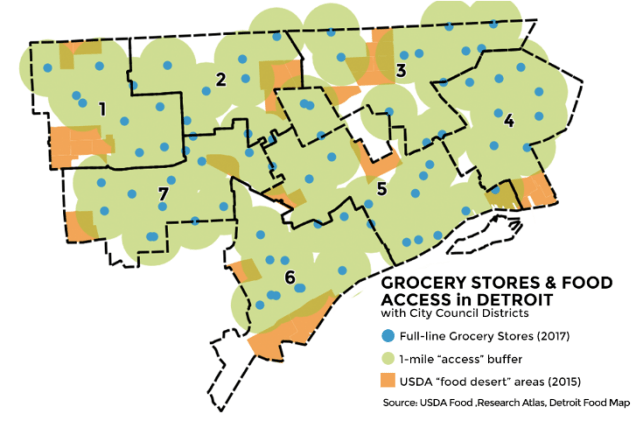
Map: Spatial Access to Detroit Grocery Stores 2017

Screen Shot 2018-05-04 at 9.42.29 AM.png

I had the pleasure of working with the Detroit Food Policy Council (DFPC) to produce their annual report and pull together some key metrics on the City’s food system. You can read the full report here.

This map in particular is crucial to understanding spatial access to Detroit grocery and the data and policy lag from Federal agencies. They were unable to account for the opening of the second Meijer on Grand River and the reopening of Parkway Foods on E. Jefferson.

More from the report:

The USDA’s 2015 “food desert” designated areas are based on national retail databases that have been shown to undercount Detroit assets.

Looking at areas of green and orange that overlap in the map to the left highlights the mismatch in federal food policy in Detroit’s city context.

These maps only look to assessments within Detroit’s city limits. Many border areas of Detroit are served by grocers in nearby cities.

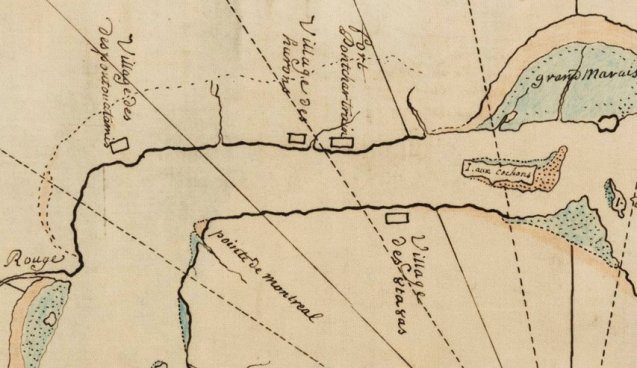
Map of Detroit and Windsor 1731

1731-detroit-map

This map was shared by MSU Map Library from the American Indian Historic Collection. It provides a rare glimpse of the “Grand Marais” French for Great Marsh across from Belle Isle. Detroit at this point is simply Fort Pontchartrain next to the soon to be displaced Native American Huron encampment.

Map: Detroit’s Parking District

parking-district-detroit

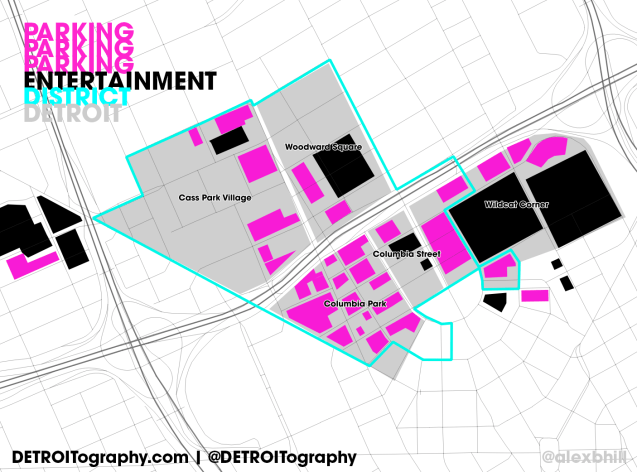
The incremental creep of car culture in Detroit has been welldocumented with the plethora of parking garages and surface lots as opposed to retail and high-rises.

The most egregious visuals of the ills of parking come via the Ilitch property [parking] empire. Not too long ago there were acres of gravel lots where Pizzarena now stands. In the build up to the arena construction in the newly dubbed “Entertainment District” now branded as “The District Detroit” (anyone remember Tigertown?) it seems the biggest boom has been in parking garages with 3 newly constructed even before the arena opened.

Within the Ilitches newly defined “neighborhoods” parking plays a significant role especially when some of those neighborhoods are merely locations for entertainment adjacent to parking options.

Total Acres Parking Acres Percent
Cass Park Village 72.5 8.9 12%
Wildcat Corner 63 13.13 21%
Woodward Square 39.3 2.93 07%
Columbia Street 10.8 1.02 09%
Columbia Park 35.1 14.51 41%

In many of these areas you will be entertained solely by a walk between stadiums and parking, in Wildcat Corner, the stadiums and parking lots take up 70% of the total acreage. Most notably Columbia Park is nearly half surface parking lots. It’s unclear if those will be new development opportunities or simply parking revenue as the Ilitches have paved and gated these parking lots when before they were simply gravel.

Event: Mappy Hour – Bike Maps

mappyhour2-1024x681

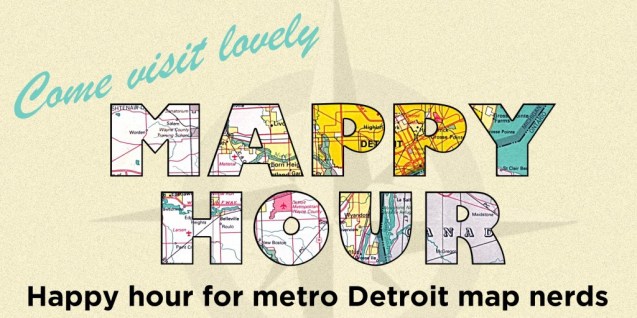
Mappy Hour is back! There is now an official group and this is the official Detroit launch!

We will be learning all about Detroit Greenways Coalition- an organization that provides a collective voice for greenway planning, development and maintenance throughout Detroit.

RSVP on Facebook

#MappyHour

Graphic design by Hayley Roberts

Map: Detroit News Circulation Districts 1941

Screen Shot 2018-04-11 at 4.35.52 PM.png

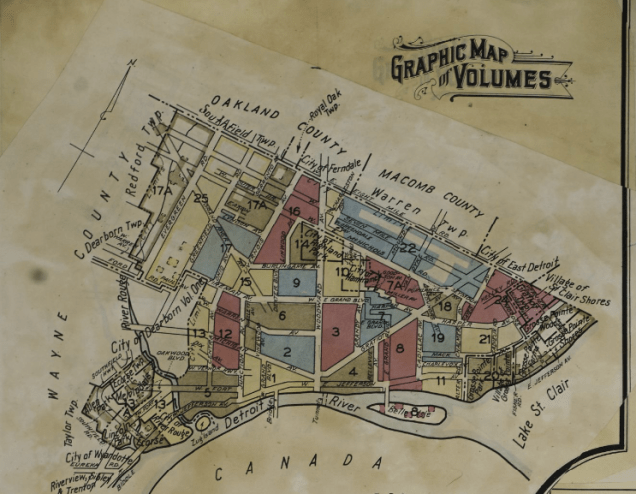
Back in the day, 1941 and subsequent years, the Detroit News conducted some fairly comprehensive household market research surveys. In 1941, they conducted a “scientific cross-sectional study of 12,902 homes in the Detroit City zone made by the Hooper-Holmes Bureau-Division of Market Research in the Winter of 1940-1941. Every 40th home surveyed.”

Some interesting quick stats:

  • 53.1% owned their own home
  • 45.3% of homes did not have a telephone
  • 21.8% of homes used ice for refrigeration
  • 26.8% of homes do not own an automobile

Map: Downtown Detroit Trash Cans for Tigers Opening Day

comerica-trash-cans

Within 400ft of Comerica Park there are at least 4 trash cans.

Within a quarter (0.25) mile, there are at least 44 trash cans.

Within a half (0.50) mile, there are at least 81 trash cans.

Before Tigers Opening Day, please identify your closest trash can for refuse disposal.

Every Tigers Opening Day, trash becomes a hot button topic as fans swarm the City of Detroit for some fun and revelry. Trash is wantonly thrown about, people urinate in parking lots, and the aftermath is often on par with a tornado – for no reason.

The data is limited and I know there are even more available trash cans in Midtown and Eastern Market. Hopefully they will get put to good use on Opening Day.

Map: Sanborn Fire Insurance 1929 – 1949

Screen Shot 2018-03-14 at 9.30.39 AM.png

There’s nothing particularly interesting about this map included in the top left corner of the Sanborn Fire Insurance maps from the Library of Congress. What stood out most to me is that new maps have been pasted over top as updates.

Screen Shot 2018-03-14 at 9.38.05 AM.png

The attached “Correction Record” includes dates from 1944 through 1949 when updates were physically attached to the map. Today we have digital change logs and version control. Sometimes those new digital systems work and sometimes I feel like we still need to print out every version of a document or map in order to ensure changes aren’t forgotten.

Workshop: Data, Mapping, and Research Justice

coopen_banner_data-300x300

I’ll be teaching my workshop on data and mapping again this April 2018 with Co.Open/Allied Media Projects.

During the 4-week course we will journey through the entire mapping process; from paper survey to digital database, basic map visualizations, and finally analysis. We will be working with free and open source software (QGIS, LibreOffice, Inkscape, etc.).

Check out some of the past course projects:

Wednesday nights in April (4 weeks long) 6-9pm

Sign up! HERE


Map: Imagining the Riverfront 1970

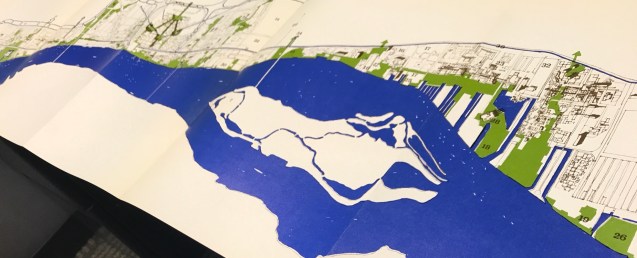
This multi-page fold-out map of the full Detroit riverfront is from “Detroit 1990: an Urban Design Concept for the Inner City” from the Department of City Planning. It seems as though the current riverfront planning follows the vein of these plans imagined back in 1970.

“As intolerable as pollution are the barriers that divide River and city. A new order must evolve. The River must be made pat of the city, part of the life of people. And the key to this revolution lies in the accessibility of the edge.

The design proposes a continuous pedestrian way that exposes the rich variety of activity of the waterfront, a path that would be a dynamic link of the River and city, working like the River itself to bring the people and activities of a river city together. The excitement of ports, the large cranes, the ships calling from Sweden, Japan would be as much a part of the patterns of the city as the busy parks of the Cultural Center.

Event: How to critically Read Maps

How to Read Maps(3)

Maps shouldn’t be all that hard to read, but sometimes there is so much data and information packed into them we miss the little details that can reveal a lot about the politics or biases of maps. Maps are an engaging way to visualize data and gain knowledge, but need to be viewed with a critical eye.

Participants will be lead through a discussion on the history and creation of maps. Following the discussion, participants will get to use their new critical map reading skills to examine historic and current maps. Materials will be provided.

WHEN: Tuesday, February 20th @ 5:30PM

WHERE: Detroit Center for Design + Technology

WHAT: Event Link


Map: Census 2020 Detroit Hard to Count Areas

Screen Shot 2018-02-11 at 4.43.17 PM

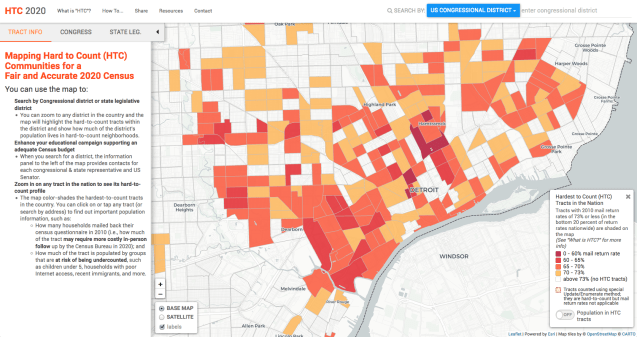
Within the entire State of Michigan, Detroit stands out as a cluster of areas considered “hard to count” by Census standards. Typically a Census questionnaire is mailed to each household, but when there is no response the Census Bureau sends someone in-person to these households.

“For the purpose of this map, a census tract is considered hard-to-count (HTC) if its self-response rate in the 2010 decennial census was 73% or less. If 73% or fewer of the tract’s households that received a census questionnaire mailed it back to the Census Bureau, it is shaded in light orange-to-dark red as a hard-to-count tract on the map.”

Census data is used to make big decisions on federal funding allocations as well as political representation. If an area is improperly counted, then people will lose access to considerable resources.

In May 2017, the Director of the Census Bureau resigned after it became clear that Republicans were going to gut the budget for Census 2020 which had planned to go online. Data shows internet connectivity is lacking across Detroit. If an underfunded Census moves forward and relies heavily on online surveying, much of Detroit will be left uncounted and will remain unresourced as a result. This should be a warning for anyone hoping to implement an online heavy approach to engaging Detroit residents.

Map: Little Caesar’s Pizza Geography 2017

little-caesars-geography

I remember running community service projects on weekends in Detroit around 2009 and not being able to find a spot to buy some hot-n-readys for volunteers anywhere.

It seems since then, Little Caesar’s has upped its franchise game to cover most areas of the city, but there are still Little Caesar’s pizza gaps that are filled by Happy’s Pizza (12), Papa’s (11), Domino’s (8), and Buddy’s (2) with a handful of standalone pizza joints.

Map: Data Conundrums with ZIP Codes and Council Districts in Detroit

Zips+Districts_2

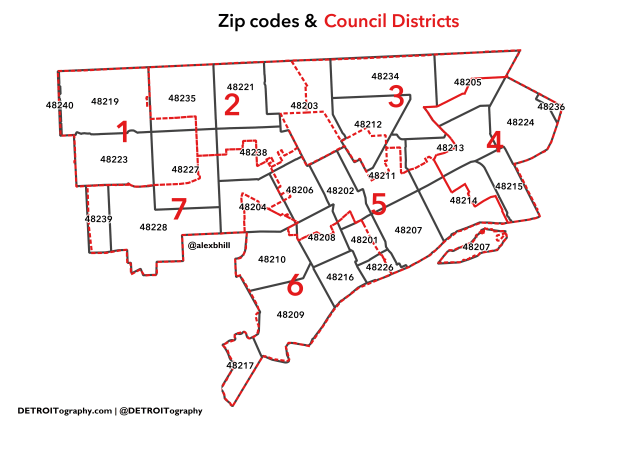
Defining geographies is difficult, especially when politics are involved. In 2009, the idea of Districts was passed on its own through City Council. In 2012, Detroit changed its City Charter and City Council elections to be based on the geographic Council District. There was intense debate about how Downtown would be divided and lines were drawn along specific city blocks.

The downside is that data doesn’t exist for Council Districts unless it is specificaly collected at the block level, which is only every 10 years by the Census Bureau. The majority of available data is at Census Tract or Zip Code level, both of which have no relation to the local political geography.

A data conundrum.

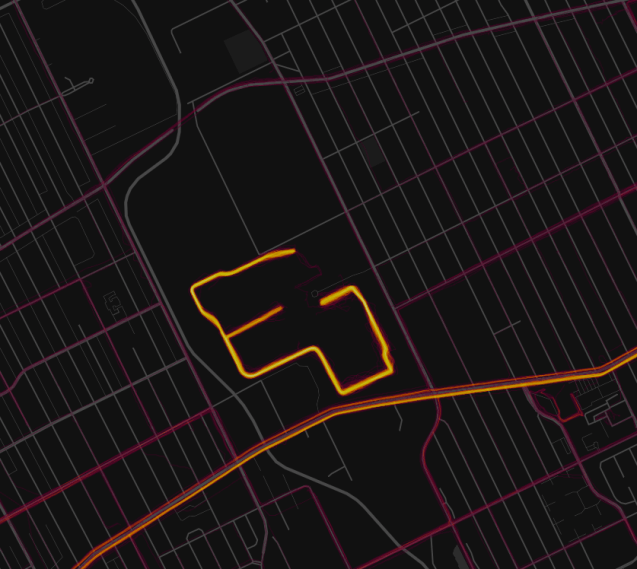
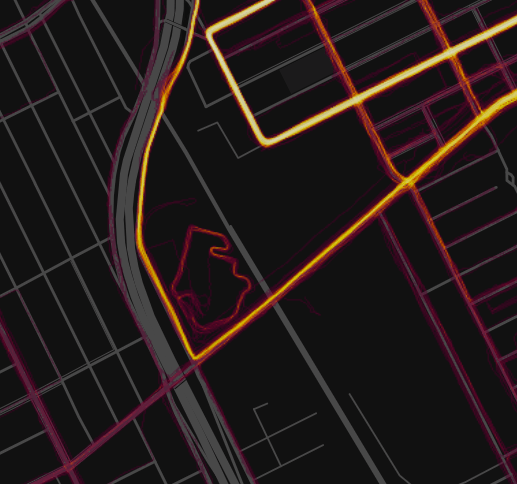
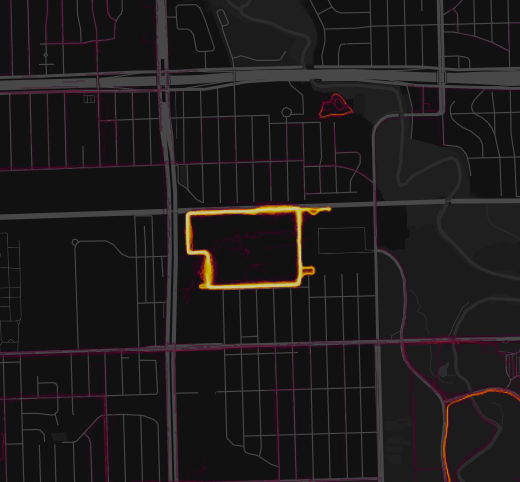
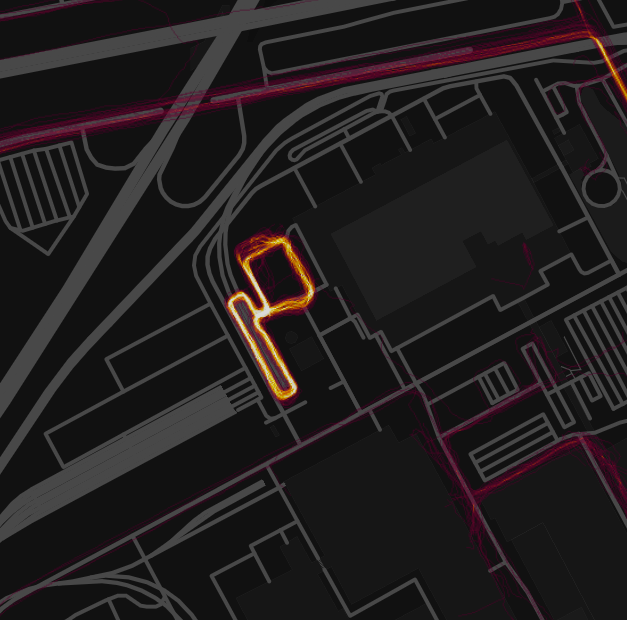
Map: The Secret Running Lives of Detroit Auto Workers

Screen Shot 2018-01-28 at 9.51.57 PM.png

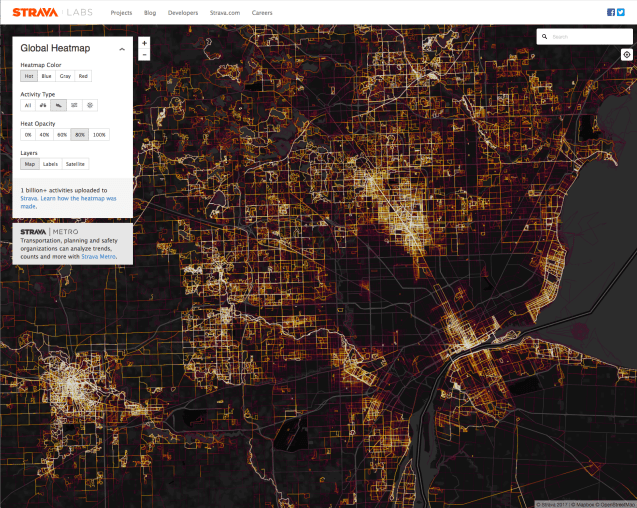
The recent launch of the Strava Global Heatmap has unleashed a storm of revelations about secret military bases and digital security and privacy concerns of US military personnel. In Detroit the story is mostly the same as it always has been: no one is (EDIT 01/30/18) not many people are running in neighborhoods outside of Downtown or the 7.2 square miles of “Greater Downtown.” Running redlining?

Grandmont-Rosedale jumped out at me as well as Hamtramck as their own insulated running districts of Detroit. However, I was quite surprised to find the secret lives of auto industry workplace wellness champions!

Screen Shot 2018-01-28 at 10.02.46 PM

The Jefferson Assembly Plant really stood out as the only Eastside highlight. The GM Hamtramck Assembly Plant didn’t highlight as it appears more people prefer to run around the plant than actually at the plant.

Screen Shot 2018-01-28 at 10.07.39 PM

Someone is taking regular jogs around the parking lot at the American Axle World Headquarters.

Screen Shot 2018-01-28 at 10.11.59 PM

Detroit Diesel also has a well worn path around its outer bounds.

Screen Shot 2018-01-28 at 10.02.23 PM.png

Similarly, the lots outside the Dearborn Truck Plant (DTP) at the Ford Rouge Plant seem to be getting regular use as a running loop.

Map: Detroit Parks Public Input 2015

parks-public-input-2015

The recent, “2017 Parks and Recreation Improvement Plan” included a great deal of community engagement to garner feedback and input from residents.

Public input was measured on a one-to-three scale based on the dot map exercise from public meetings. Residents were asked to prioritize up to three parks in their city council district. If a park received no dots, it was scored with a “0”, 1 dot with a “1”, 2 dots with a “2”, and 3 or more dots with a “3”. These rankings were then converted to a 1-5 scale.

Map: Key Scenes from Detroit’s Underground

Screen Shot 2018-01-05 at 11.37.19 PM

The Detroit News has a recent interactive map with writing by Louis Aguilar that chronicles 13 important sites of Detroit’s underground art, music, and culture scene.

For decades, the increasingly upscale area now called “greater downtown” was a haven for a thriving underground art and cultural scene. Ground-breaking artists and others took advantage of cheap rents to produce a raw, creative environment.

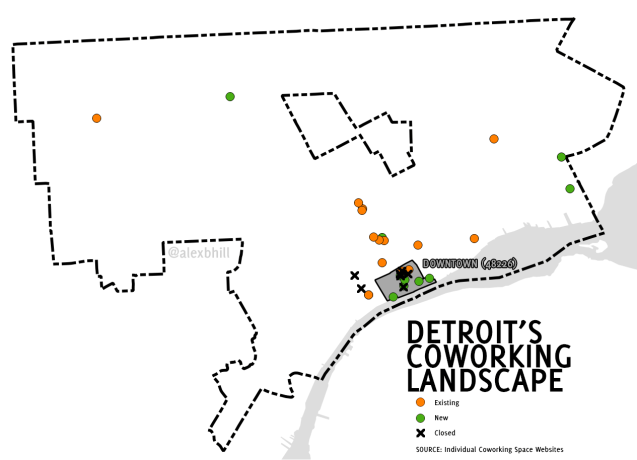
Map: The Shifting Cost of Coworking in Detroit 2014 to 2017

cowork_landscape_2017

Since 2014, I’ve been following the coworking trend in Detroit. I’ve used space for team work at An Office in Detroit that has seen a change in ownership, but is still going strong. In the last 3 year, there have been 8 coworking spaces that have closed and 13 new spaces opened, including the arrival of WeWork in two Downtown locations and the expansion of Bamboo Detroit into a second space. It is safe to say that the majority of the action is located Downtown within the 48226 zip code.

coworking-2017costchange

The most interesting coworking shift has been change in the monthly price of a drop-in desk or “hot desk.” Out of the 13 spaces that have been operating since 2014, 6 increased their prices, 2 dropped prices, and 5 kept prices the same (first map). In 2014 the average cost of a coworking desk was around $110, but in 2017 the average is $130 since many of the new spaces have entered the coworking market at the top end with a “hot desk” starting at more than $200/month.

There has also been a rise of parent and woman supportive business spaces, namely Detroit Mama Hub operating out of Ponyride, Femology located Downtown, and the Detroit Parent Collective near Marygrove College. There have been many coworking additions Downtown (7 of the 13 new coworking spaces), but thankfully a number of new options beyond the Central Business District. Southwest is still conspicuously absent of a formal coworking space. Maybe I’m just missing it?

Map of the City of Detroit, entered according to an Act of Congress 1835

John_Farmer_1835

This map of Detroit available in the Library of Congress collections and appears to specifically call out the subdivisions of the Military Reserve (land), Brush Farm, John R. Williams holdings, and those of a Peter Berthlet.

It is unclear what Act of Congress necessitated the creation of this map by the District Surveyor, John Farmer. Amy Elliott Bragg has a nice write-up on The Night Train blog about the Farmer family. Son of John Farmer, Silas Farmer (“Detroit’s earliest map publisher”) was only 4 years old at the time his father created this map.

I found a small triangle of land called “Miami Square” at the northern intersection of Gratiot and Randolph and wondered if it was still called that today. The City recently tested out a pedestrian plaza in that area. It appears to still exist as a park, although completely paved over and no signs or markers except for a large abstract sculpture.

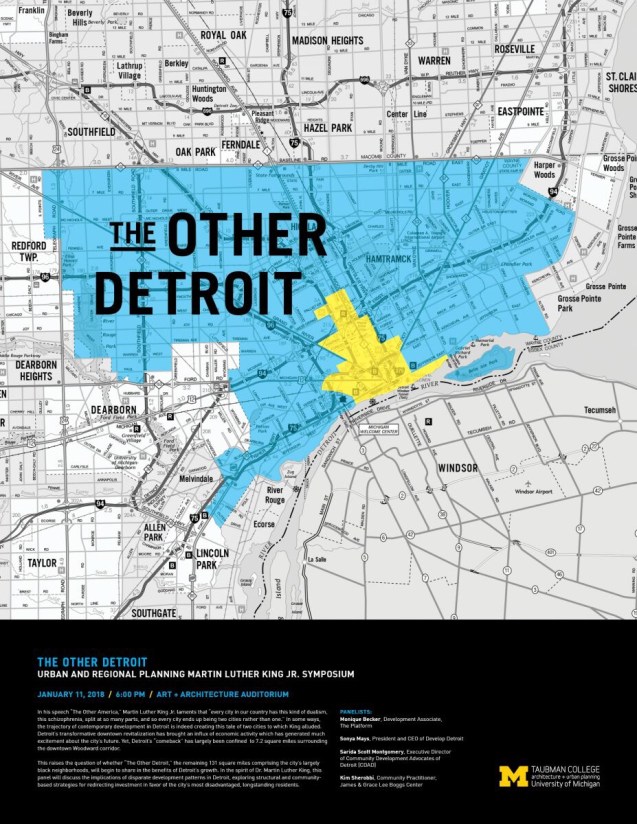
Event: The Other Detroit

WHEN: Thursday, January 11th @ 6:00PM

WHERE: Art & Architecture Auditorium

WHAT: Event Link

In his speech The Other America, Martin Luther King Jr. laments that “every city in our country has this kind of dualism, this schizophrenia, split at so many parts, and so every city ends up being two cities rather than one.” In some ways, the trajectory of contemporary development in Detroit is indeed creating this tale of two cities to which King alluded. Detroit’s transformative downtown revitalization has brought an influx of economic activity which has generated much excitement about the city’s future. Yet, Detroit’s “comeback” has largely been confined  to 7.2 miles square miles surrounding the downtown Woodward corridor.

This raises the question of whether “The Other Detroit,” the remaining 131 square miles comprising the city’s largely black neighborhoods, will begin to share in the benefits of Detroit’s growth. In the spirit of Dr. Martin Luther King, this panel will discuss the implications of disparate development patterns in Detroit, exploring structural and community-based strategies for redirecting investment in favor of the city’s most disadvantaged, longstanding residents.

Panelists:
Sonya Mays, President and CEO of Develop Detroit
Kim Sherobbi, Community Practitioner, James & Grace Lee Boggs Center
Sarida Scott Montgomery: Executive Director of Community Development Advocates of Detroit (CDAD)
Monique Becker, Development Associate, The Platform