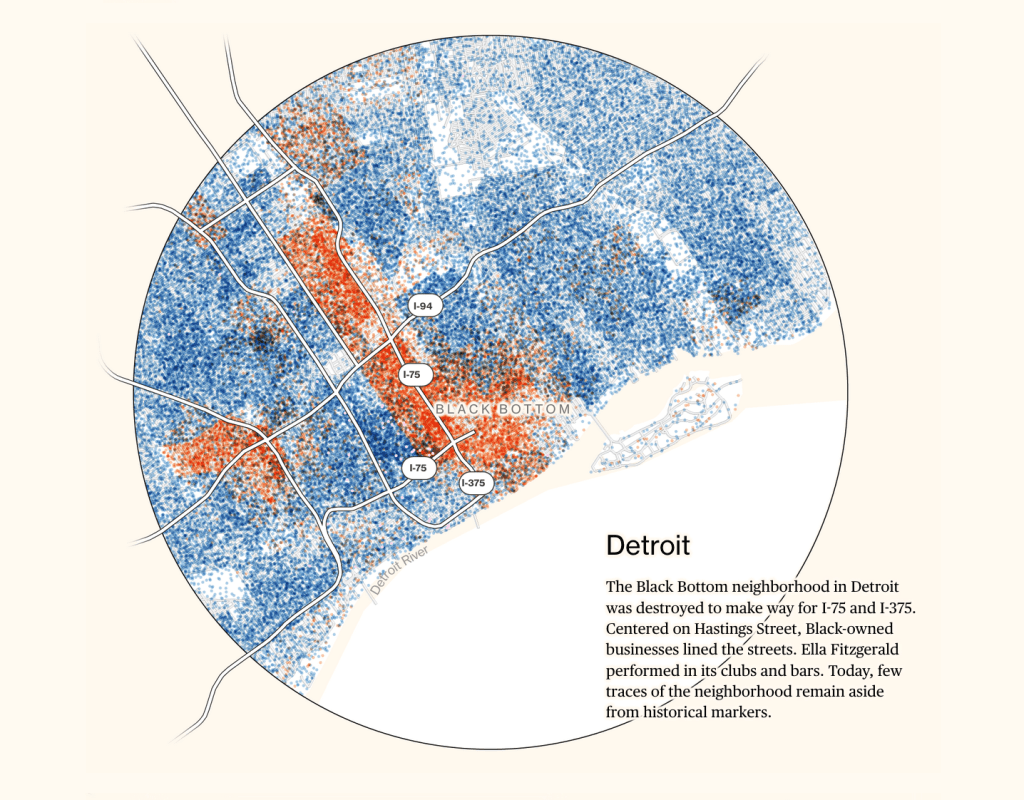
CityLab had an excellent feature on “Where Highways Tore Through Black Communities.” Detroit was highlighted in the article, but no in-depth discussion. The current plans to make I-375 a surface street have brought renewed calls to bring back some of the historically significant urban fabric that used to exist.
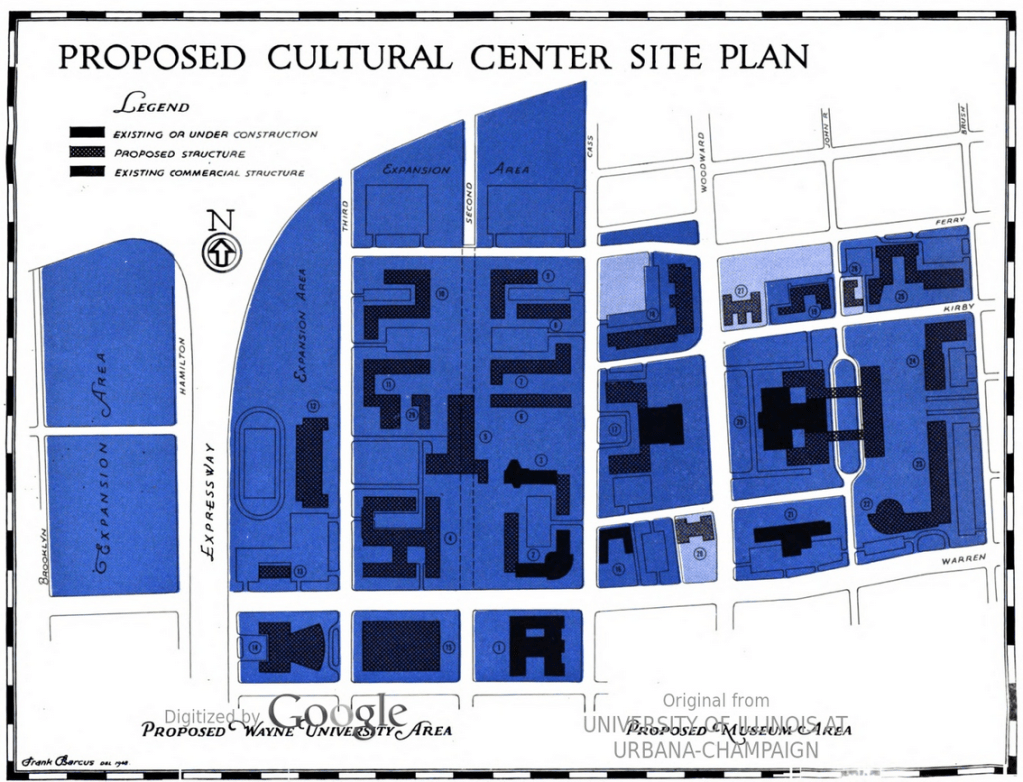
The City’s “Cultural Center” has been in concept phase since at least 1948, potentially even before the City had a City Plan Commission.
This map comes from the seventh report in the 1948 master planning series. At the time many of our current institutions were still under construction. WSU was building Science Hall, State Hall, and the Engineering Building. The Detroit Historical Society museum and International Institute weren’t yet built.
Number 20 on the map is the DIA referred to as the “Art Institute.” The planned expansion of the DIA included a boulevard and skyway bridges across John R. to a second building on what is now the CCS Main Campus, where a large Planetarium was proposed.
Redlining isn’t what we think it is. There are a lot of popular myths and assumptions about what the HOLC “redlining” maps mean for various cities and especially Detroit. Actual “redlining” maps don’t exist – they’ve either been lost or destroyed by the FHA or financial institutions.
Detroit, out of all large cities, had the highest number of HOLC mortgages given to Black homeowners with 880 mortgages (Michney & Ladale, 2019). The 1939 “redlining” map for Detroit is a security risk map created by the Home Owners’ Loan Corporation (HOLC) after they had already given out mortgages in the city. It’s important to note that on that map not all red areas correspond with areas with Black population, but all areas with Black population are colored red.
The Federal Housing Administration (FHA) was the entity that followed after the shutdown of HOLC and they created new maps. All the FHA maps and records were lost or destroyed during the Nixon administration. Financial institutions possibly created their own maps as well as utilized FHA guidance that explicitly discriminated based on the race of homeowners.
The map above from Todd Michney and Dale Winling distributes all HOLC mortgages by Census Tract and shows the percentage of homes owned by non-white homeowners. It is still very apparent both where Black residents were able to buy homes as well as the low number of overall loans to Black homeowners.
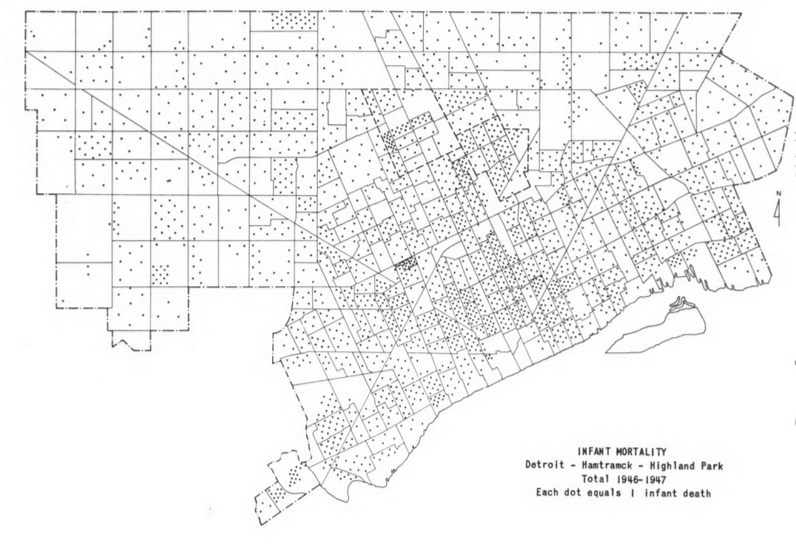
This map was included in the report “Areas of Social Need in Detroit and Neighboring Communities” and published by the Research Department of the Council of Social Agencies of Metropolitan Detroit. The Research Department generated nine different indexes of social need with “infant deaths” being its own category. The report notes that although infant mortality is not as bad as the past, it was still a significant health problem.
I came across this 1945 map in the Detroit Free Press archives and it caught my attention as both a map of the “Air Age” where airplanes would become the dominate vehicle for moving cargo around the world along with the focus of Detroit in the center.
The map encourages readers not to “brush it off as just another map.” The map is presented as an alternative to the Mercator projection which was designed as an easy map for shipping across oceans. The Air Cargo Research center was led by Spencer Larsen at Wayne State University. Floyd A. Stilgenbauer was the cartographer of this map and was based on his research on a polar lobate globoid projection system. Stilgenbauer’s name still adorns the Wayne State University GIS and Cartographer Laboratory.
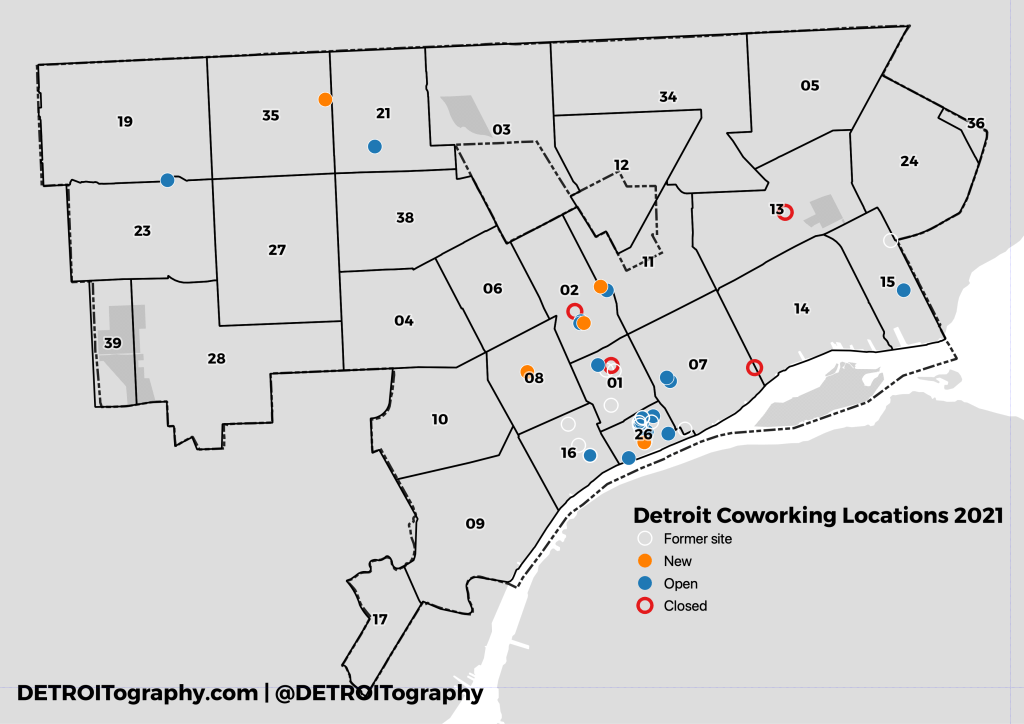
Detroit has a history of upstart coworking spaces before any corporate chains like WeWork arrived. That trend has continued even amidst the COVID-19 pandemic. Curbed has noted that commercial real estate appears to be investing heavily in a future coworking boom. Maybe they are right as traditional office spaces close, move to full-time remote, or adopt a coworking attitude all together (although many workplaces are not even considering continuing remote work or are planning for a mandated 3 days in the office).
There are 25 coworking spaces open in Detroit, including 5 new spaces since our last update in 2019. I’ve been tracking the coworking boom since 2014 when Detroit had 22 sites offering coworking. Downtown and Techtown remain the hot areas with a third WeWork location open on Cass Ave. Costs increased in 2017, stabilized in 2019, and for 2021 seem to be hanging on for the future boom.
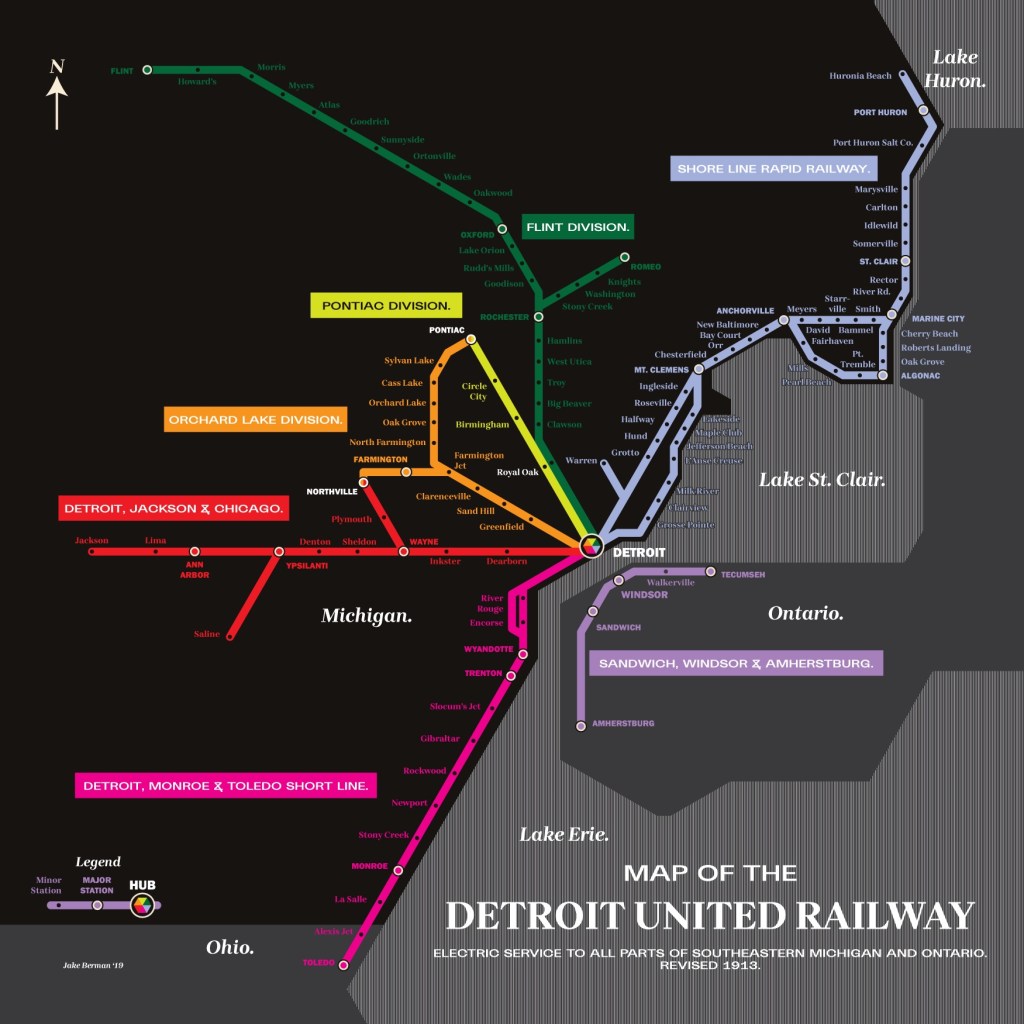
The purple on this map is really unique. I don’t think I’ve ever seen a historic map that used purple as it’s primary print color.
There is almost too much history in this map to note, but important to note is the location of Union Depot near the western Downtown riverfront. My interest in health system history makes me notice all the hospital as markers of place along with cemeteries.
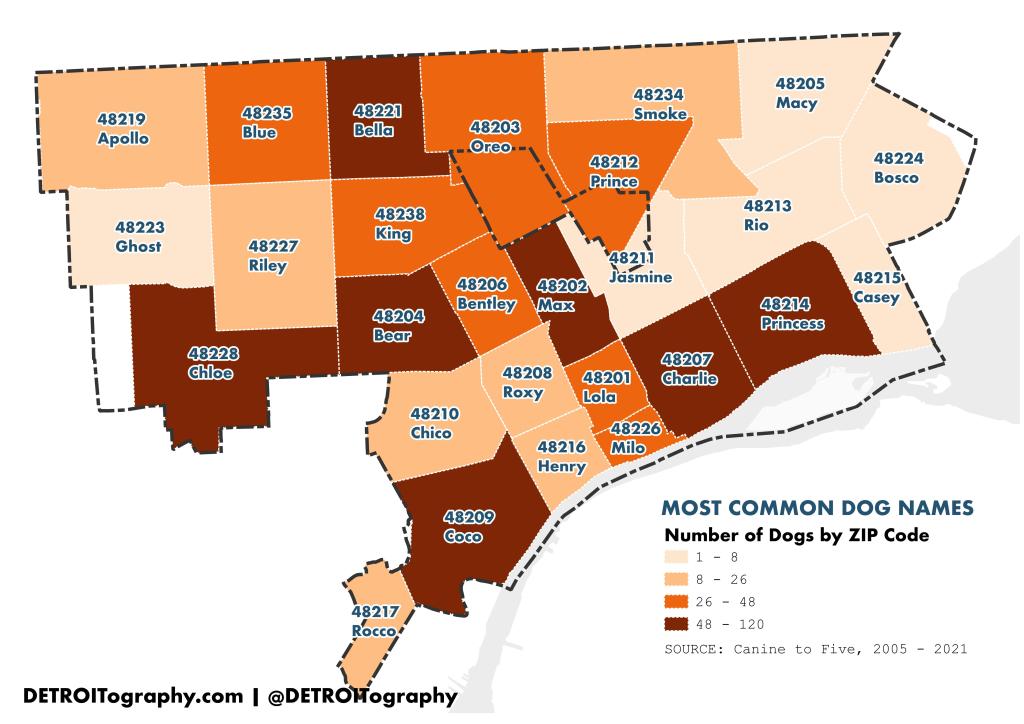
The myth of wild packs of dogs in Detroit seems to come up again and again, but is hardly true (there are definitely stray dogs that are not safe).
Many Detroiters have dogs as pets and thanks to our friends at Canine to Five we explored the most common dog names by ZIP code in the city. If you meet a dog that you don’t know try saying, “Hi Bella” or Bear or Coco or Max.
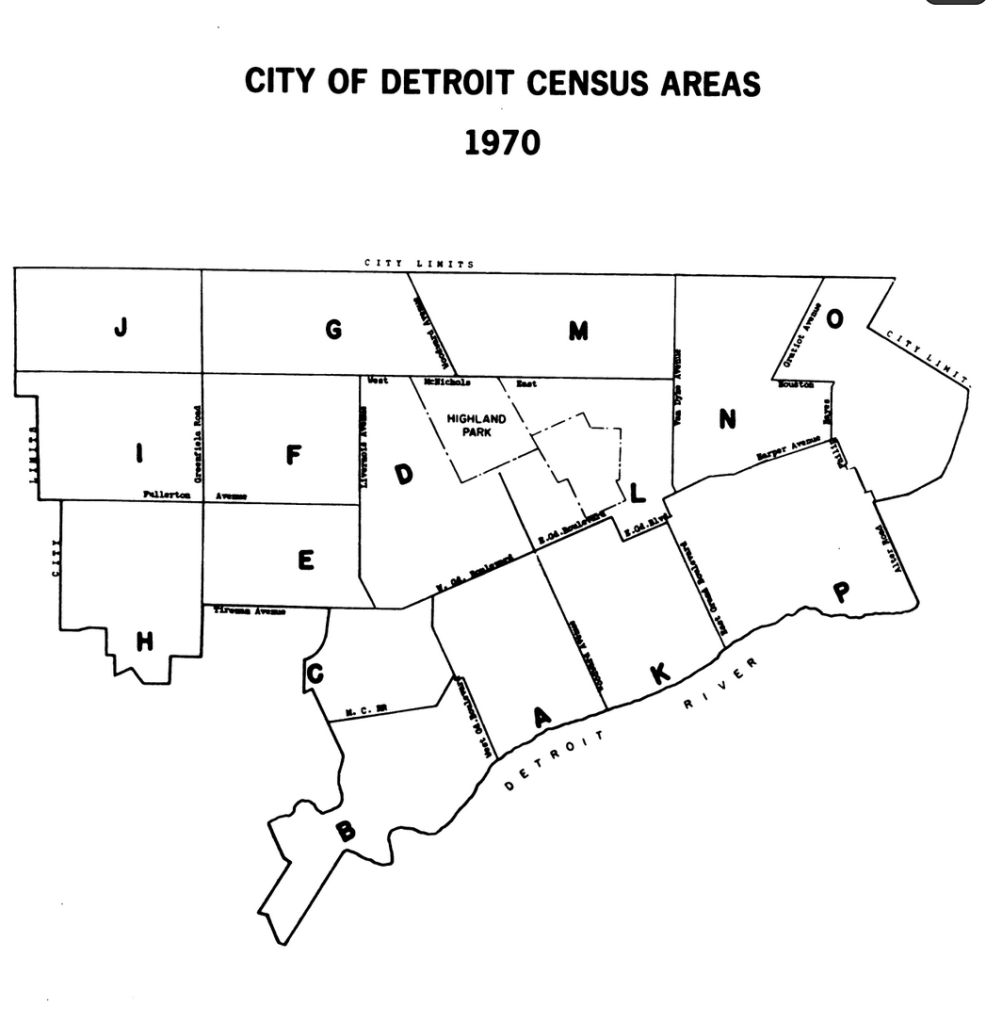
The Census Areas of the 1970s show “Area K” that is mentioned often by urban planners and newspapers as “the heart of the slums.” It was the area of Black Bottom and Paradise Valley, of targeted slum clearance and predominantly Black Americans restricted from living in other areas of the city. The area has held the “K” letter since at least 1955 if not earlier.
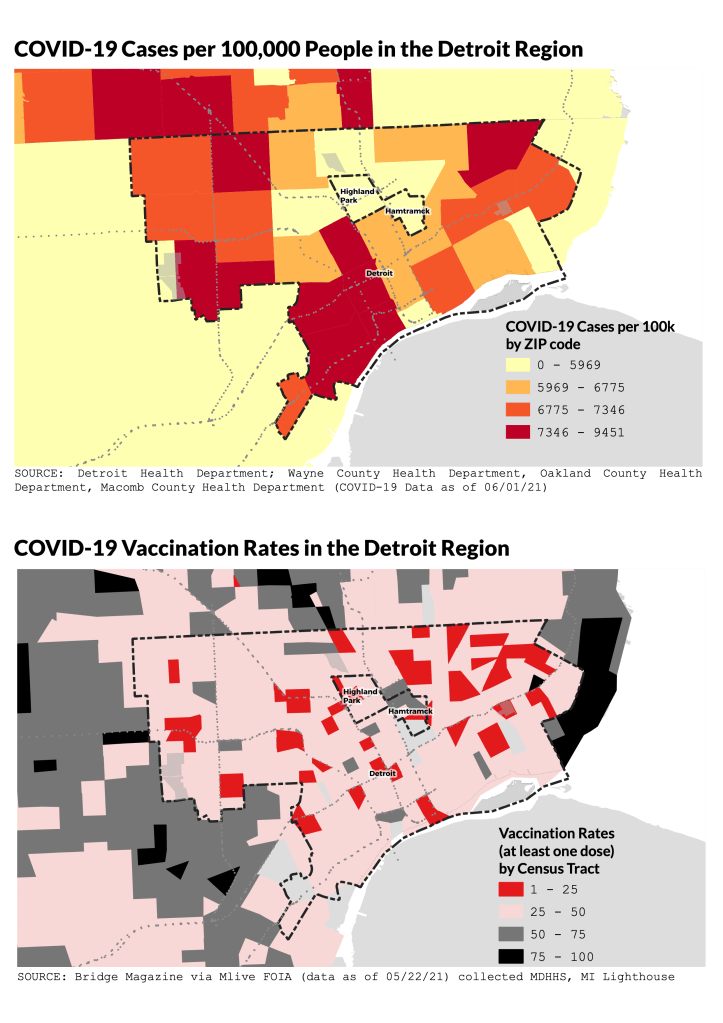
COVID-19 has laid bare all of the systemic health inequities across the country, but also very specifically in Detroit.
Local public health systems including governmental health departments and health care providers are key to building public trust on an every day basis. In places where the local public health system has broken down, it is no surprise to see low levels of trust and low rates of vaccine uptake.
Detroit is likely an extreme example where the city’s largest health system almost shuttered its doors in the early 2000s before getting a monetary grant from the State government. Detroit has operated its own city health department on par with a county government since the 1970s, but decided to push provision of health services to an unproven non-profit in 2012 after a series of federal investigations that began in 2010.
The current health department was only just relaunched in 2015 and at best could be described as a “startup.” Detroit’s other hurdle is that roughly 70% of the population lives in a medically underserved area and almost 20% haven’t seen a doctor in over a year (MiBRFSS 2017-2019). COVID-19 vaccination rates remain low in Detroit at around 30%, however mass vaccination sites, mobile health vans, and tent style health clinics are not an ideal entry point to build trust in a local public health system that hasn’t been there for residents in over a decade. The issue in Detroit is not vaccine hesitancy, but the absence of a local public health system that will serve people well on a regular basis.
This hand drawn map by M. Saffell Gardner is a part of a series of hand drawn maps in a Volume 2 of Detroit Research Journal. The map is part of the “Drawing Detroit” series which aims to collect personal and hand drawn maps of Detroit.
Check out the different hand drawn and hand maps that we’ve collected over the years.
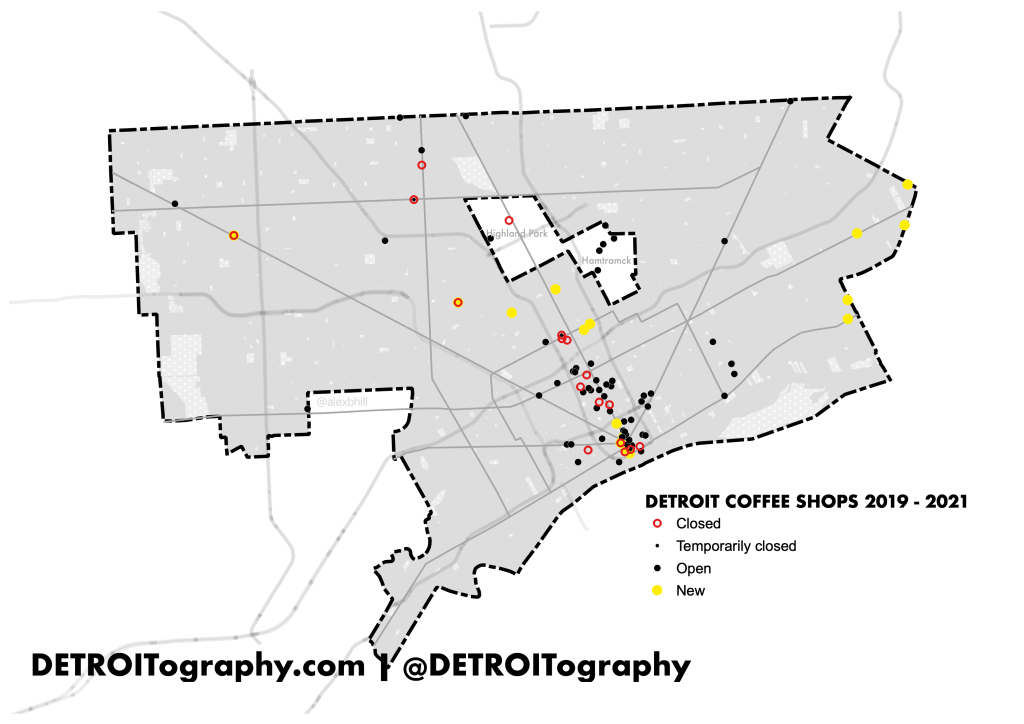
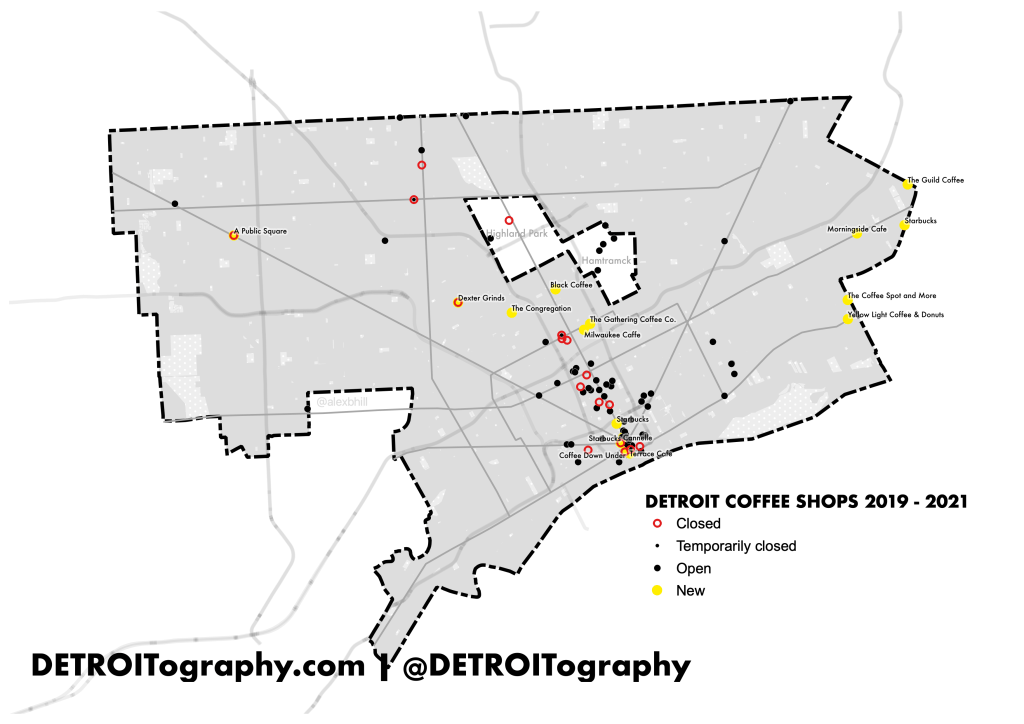
Detroit has 82 coffee shops. Since 2019, 16 new shops opened and 13 closed. During the COVID-19 pandemic, 11 coffee shops temporarily closed and 8 have reopened, at least for takeout.
Since 2015 Detroit has had a net gain of 28 coffee shops. A number of new community coffee shops launched during the pandemic including Black Coffee in the Northend, Milwaukee Caffe in Milwaukee Junction, The Congregation, Gathering Co., Public Square in Grandmont-Rosedale, Morningside Cafe in Morningside, Yellow Light in Jefferson Chalmers, and Cafe Alto in the former New Order Coffee spot in Midtown.
New Order Coffee (in former Ye Olde Butcher Shoppe space) abandoned the city to focus on their Royal Oak location and tears were shed when Avalon Biscuit Bar closed permanently (at the former Cafe con Leche spot).
After Coffee and (____) closed in Jefferson-Chalmers it seemed that beyond West Village, the Eastside would be uncaffeinated. Now in 2021, there are so many new options including a border line Starbucks. The Eastside and the “Heart of Detroit” and Northend seem to be the current hot zones for coffee. Downtown and Midtown are already so dense with coffee that perhaps development is making its way northward. Is New Center getting leap frogged? Coffee has had a hard time sticking with Cafe con Leche closing before the Avalon Biscuit Bar at the same spot.
Detroit needs a lot more trees. It’s no mystery that Detroit has been hit by deindustrialization and population loss on top of Dutch Elm disease leaving many trees either dead, dying, or left uncared for along city streets. I’ve previously looked at tree canopy disparities and posted about the dangers of heat islands and the absence of green space in a city.
Recent City of Detroit efforts to increase street trees are doing a little, but replanting an urban forest is no small feat. The economic, climate, and public health benefits would be immense if Detroit can add more trees in neighborhoods that need them.
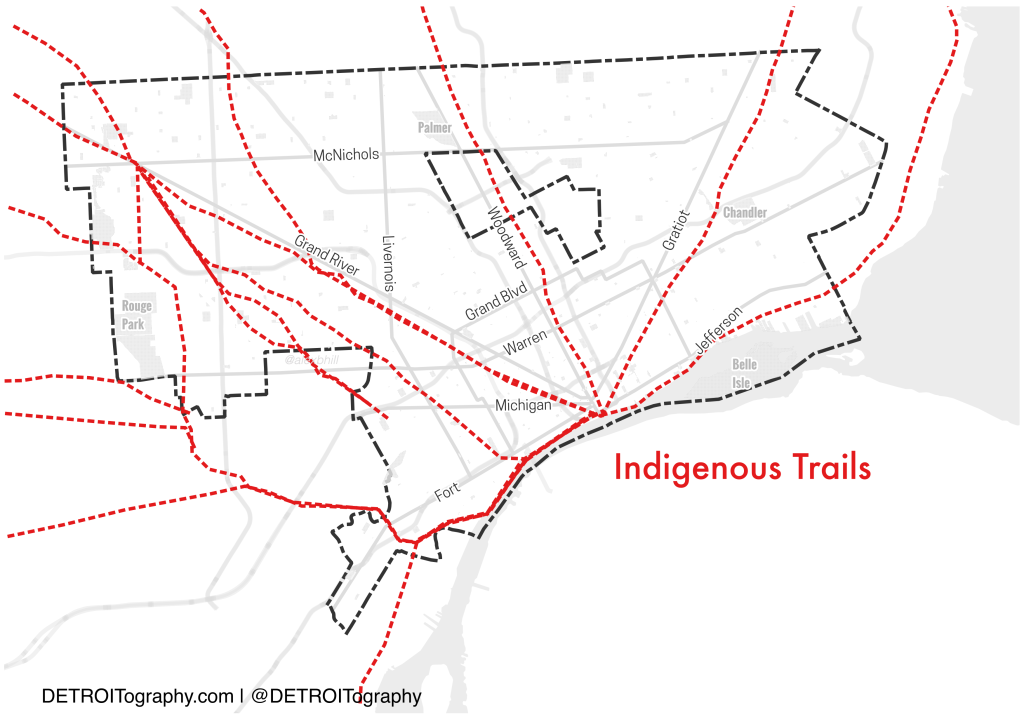
In honor of Indigenous Peoples’ Day, I wanted to share this map that I’ve been thinking about for some time. These trails were digitized and georeferenced from the 1931 Archaeological Atlas of Michigan.
Detroit’s street design with its hub-and-spoke pattern Downtown are often attributed to Western men with grand idea after Detroit’s “Great Fire of 1805.” The story goes that they imagined Detroit in the image of Paris or Washington D.C. – but in reality Detroit’s unique radial streets come from the pathways created by indigenous peoples living on this land before any Frenchman arrived.
In case you missed the news, almost all the maps here are becoming a book! It’s definitely closer to 100 maps. I’m really excited to bring some of the maps to life on the pages of a book.
I made this hand drawn map as part of the “Drawing Detroit” series which aims to collect personal and hand drawn maps of Detroit. This map was published in Volume 2 of Detroit Research Journal.
In 2015, I was thinking introspectively about the spaces that I inhabited in Detroit especially as it related to race. As a young, white man I had lived in a handful of “islands of privilege” in the city – and this map was my exploration of those islands and their disconnect to the larger city.
Check out the different hand drawn and hand maps that we’ve collected over the years.
The federal government’s General Accounting Office (GAO) produced a report on Detroit’s “Central Industrial Park” for what would become known as the Poletown Plant or the Dodge-Hamtramck Assembly, Dodge Main, and now referred to as Factory Zero.
The “Poletown Community” was defined in this report as all of the City of Hamtramck and a significant section of Detroit south of Hamtramck. The project eventually relocated 4,200 people and 1,400 homes. The remnant of the area lives on in the “Poletown East” neighborhood area defined by the City of Detroit.
The issue of open library branches has been on-going since the COIVD-19 pandemic started. For over a year now, only 6 library branches have been open and there isn’t any expected change for Summer 2021.
I was concerned that closed Library branches meant that children wouldn’t have access over the summer let alone during the school year. I was pleasantly surprised that the branches still open largely fall within areas with high numbers of children. Notably, the Knapp branch near Hamtramck would serve an area with a significant number of children.
Libraries have been a community home base for many residents where they can read, use internet, and connect with what is happening. In a city with a significant digital divide and an overall low level of connectivity across the city (door-to-door outreach is the baseline) we have to keep our branches open and expand what they can offer.
One of the few maps (maybe the only map) of vacant land in the 1970s in Detroit came from the Housing and Urban Development’s (HUD) assessment of their inability to maintain their growing inventory of properties and land. This map was produced by the Detroit News for a series of stories on HUD’s Detroit inventory.
This map shows there were 4,763 vacant lots owned by HUD which gives a rough sense of where there may have been more Farm-a-Lot programming.
The ground has been broken! The multi-year effort to both develop and secure land to make the Joe Louis Greenway (JLG) a reality is on the move. The JLG 27.5 mile loop hopes to be completed within 5 years and in the process connect neighborhoods across Detroit as well as Highland Park and Hamtramck.