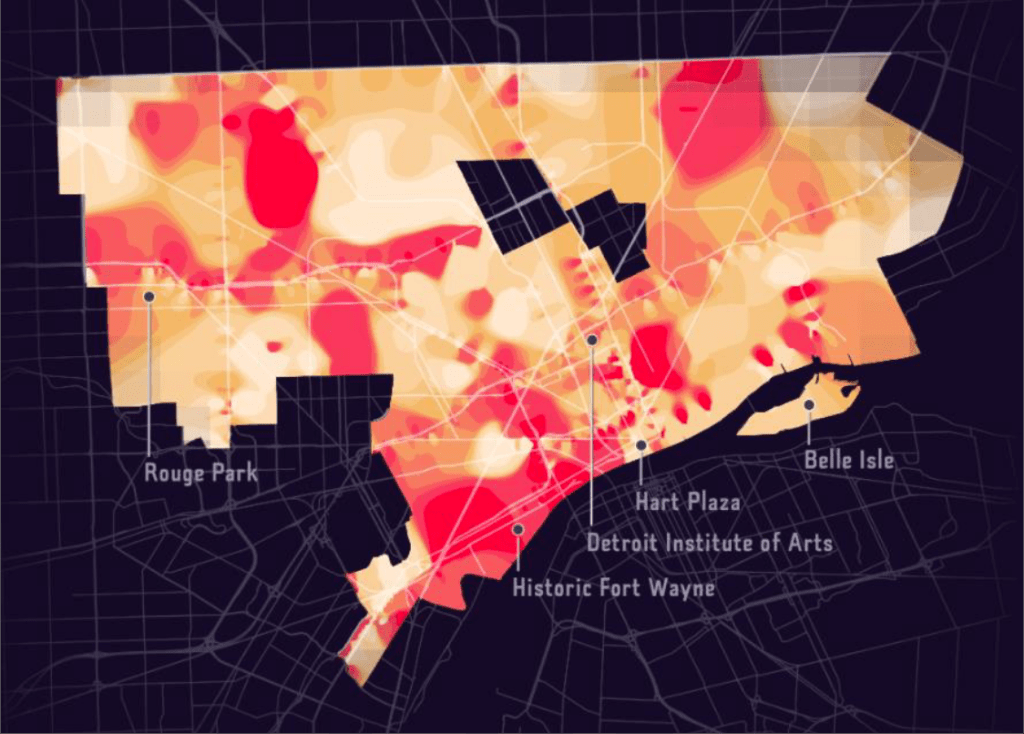
This beautiful map is part of a USDA report that includes outcomes from the Heat Watch Detroit program during summer of 2020.
The average annual temperatures of UHI areas in Detroit are 1.8°F to 5.4°F warmer than adjacent areas, ranging from 70°F to 85°F (Gregg et al., 2012 & Heat in the City, 2020). CAPA Strategies conducted a Heat Watch in Detroit, providing maps of temperature distributions throughout the city on August 8, 2020 for the morning, afternoon, and evening (Figure 1.9). This study demonstrates where in the city there are warmer and cooler pockets, which are often dependent on the qualities of the land as well as its use.
