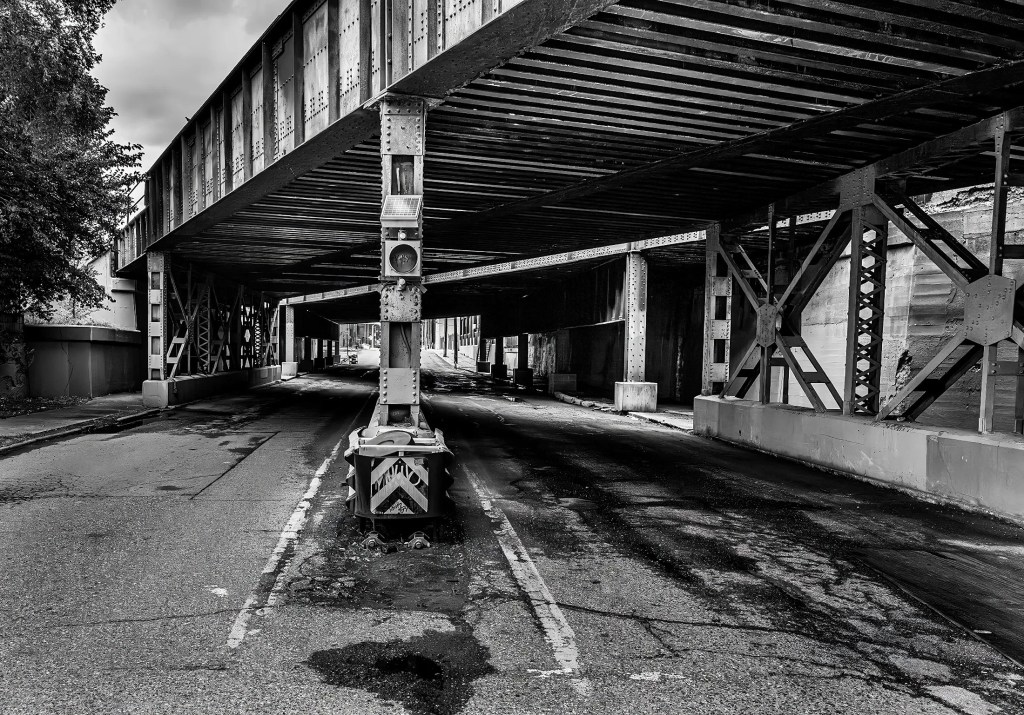
Milwaukee Junction was the heart of early automotive manufacturing in the United States, and many consider it the cradle of Detroit’s auto industry. The area takes its name from the railroad junction formed by the Detroit, Grand Haven and Milwaukee Railway (later the Grand Trunk) and the Chicago, Detroit and Canada Grand Trunk Junction Railroad (later the Grand Trunk Railway of Canada).
Originally developed in the 1890s to spur industrial expansion in Detroit’s North End, the area was first home to businesses producing wooden horse-drawn carriages. Over time, more than 20 companies tied to early automobile manufacturing set up shop there, including Ford, Fisher Body, Regal, Studebaker, and others. Wooden carriage plants gave way to metal stamping plants, numerous Fisher Body plants, assembly plants, and more.
The Piquette Plant
Henry Ford’s Piquette Plant, built in 1904, was the first plant Ford owned. It produced a range of Ford vehicles, including the Models B, C, F, K, N, R, and S. In 1908, Ford, C. Harold Wills, and Joseph Galamb spent nine months working in a secret room at the plant to develop the Model T, the first car designed and priced to sell to the masses. The first 12,000 Model T cars rolled off the line at Piquette. Manufacturing then transferred to Ford’s Highland Park plant.
The Piquette plant was also where Ford developed his concept for a nationwide network of automobile dealerships, as well as the idea for the automobile assembly line, which he later put into practice in 1913 at the new Highland Park Plant. For more on the plant’s history, visit the Ford Piquette Avenue Plant.
Ford later sold the Piquette Plant to Studebaker, which operated there until 1933. Today, the Piquette Plant operates as a museum, while most of the former Studebaker plant has been converted to residential use.
Mapping the District
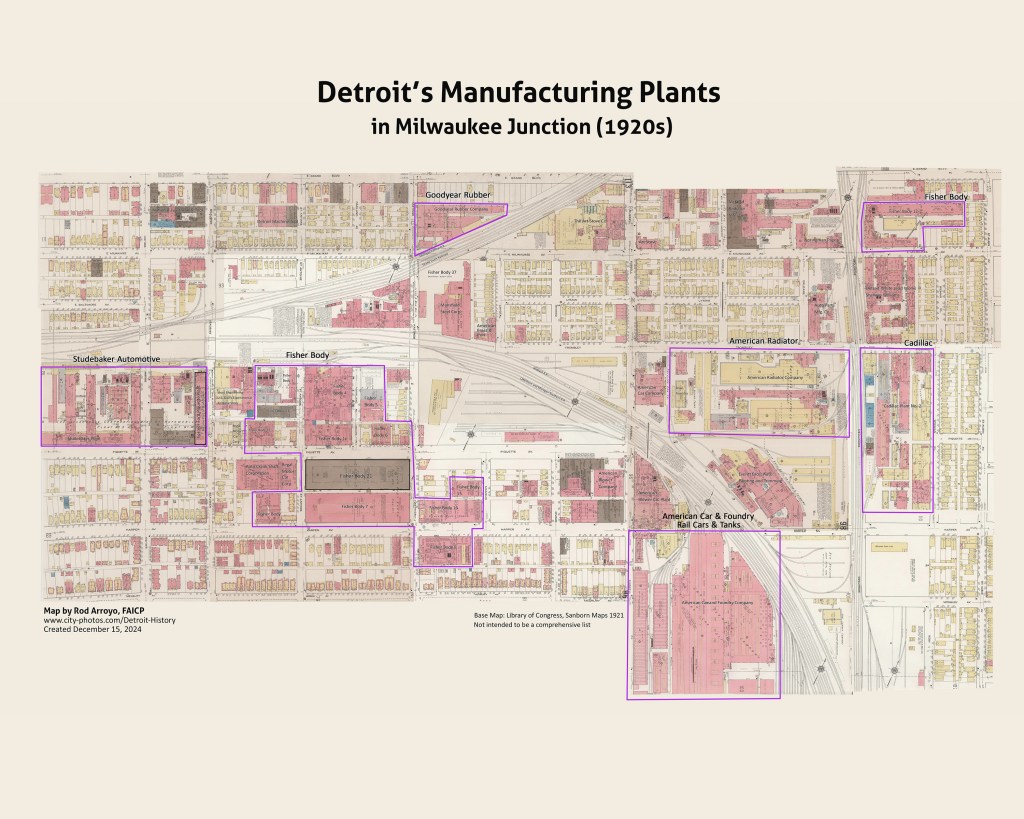
Using 1921 Sanborn Fire Insurance Maps, I created a map highlighting key automobile manufacturing sites in this district as they stood that year.
Have you ever wondered where all the Fisher Body plants were located across Detroit? I also put together a separate map pinpointing many of them — you can explore it via this Google Map link. If you know of any that are missing, please let me know, and I will add them.
The map included in this post documents 19 Fisher Body plants (Numbers 1–16 and 21–23) plus the A.W. Fisher Building. In total, Fisher Body operated more than 40 plants across Detroit, Cleveland, Flint, and Ontario, with the majority concentrated in Detroit. Also shown are other plants from other manufacturers, including Goodyear, Cadillac, American, Mansfield Steel, American Brass, and more.
Rod Arroyo, FAICP is a Detroit-based urban planner, researcher, and educator with a Master of City Planning from Georgia Tech. A Fellow of the American Institute of Certified Planners, he served as a Partner at Giffels Webster, one of Detroit’s leading planning and engineering firms, and as an adjunct professor at Wayne State University. His research focuses on downtown and Detroit’s historic and predominantly Black neighborhoods, including Paradise Valley, Black Bottom, and Sugar Hill. Rod shares that expertise as a lecturer and as the owner of Detroit Legacy Tours, connecting residents and visitors with the city’s diverse and complex history.
I’ve spent my entire career, and my six decades of life, living with the results of unplanned land use. I watched Detroit’s legendary decline from my front porch and in my city of Detroit work, and I continue to see and feel the disconnects between what people need to thrive and what is built near them. As a planner of public services, I’ve heard so many laments that city of Detroit management caused its own decline. Working papers of the Detroit City Plan Commission (CPC) in the 1950s are a fascinating counter to that.
I collected the documents behind Detroit’s 1946 and 1954 Master Plans when I was writing my dissertation. Now, these reports and others, can be accessed through The Online Books archive: Detroit (Mich.). City Plan Commission. The maps show CPC staff trying to understand forces affecting Detroit’s residential and economic bases, even before mass exodus. They surveyed business establishments and collected statistics from other great industrial centers. They drove every block and recorded observations of building conditions, developing a condition rating system for housing and industry that teed up pressing issues.
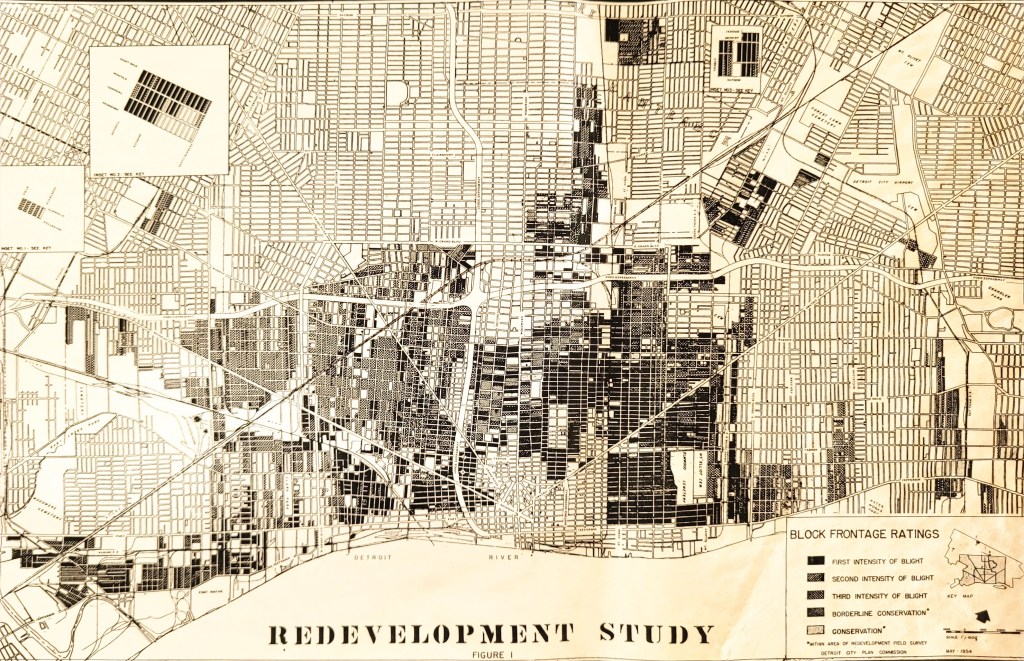
The “Redevelopment Study” map classifies frontage conditions in the oldest sections of the city. These were visual assessments of structures (foundations, plumb, roof, rot, heating) and their environment (cleanliness, overcrowding, traffic, commercial nuisances). Defined criteria can support needed discussion: for example, is a co-located storefront, or lack of parking, always blight?
Where whole sections are in the darkest (most blighted) category, wholesale clearance interventions were devised, such as what is now Lafayette Park. Blocks with few building problems (lightest fills) were slated for conservation which involved educational outreach to homeowner associations. In my early years, I knew of no direct city government outreach, so this seems groundbreaking.
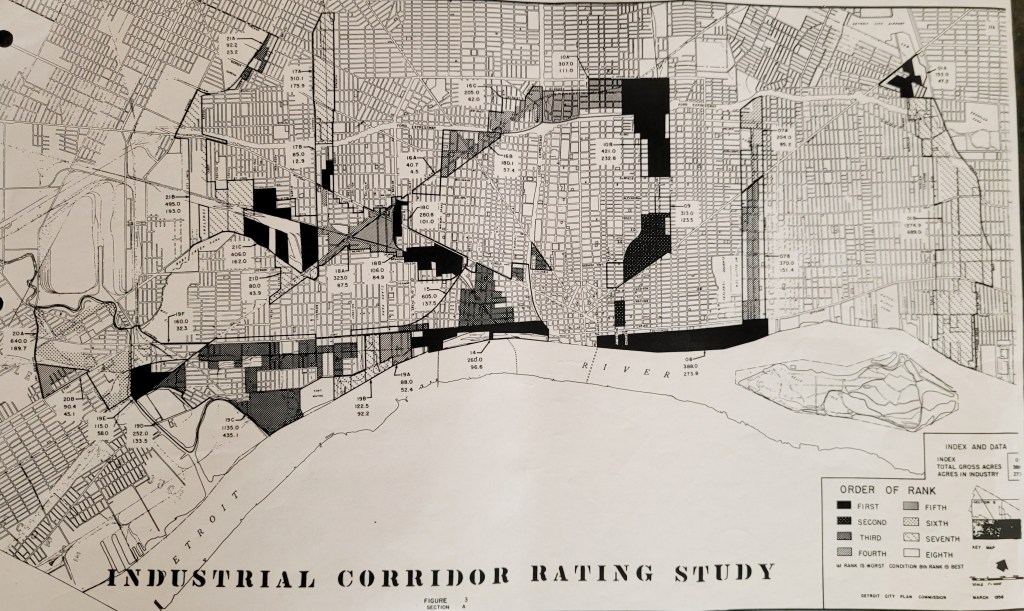
CPC studied options for renewal in industrial areas, many of which mixed residential, commercial and other uses. A rating system was built from opinions of manufacturing and non-manufacturing businesses (dissatisfaction with streets, plant layout or size) and from facility characteristics (yard loading or storage; number of stories; building coverage of land; off-street parking; age; owner occupancy). This allowed them to target conditions correlated with owners’ desires to move.
The “Industrial Corridor Rating Study” map is the result. Other maps analyzed factors such as shift employment and average commute distances. So much work highlighted the relative neglect as well as obsolescence of then-century old corridors. Maps often lead us to ask more questions.
I feel a kinship with the CPC staff who urgently grappled with Detroit’s disadvantages in the highly competitive postwar metro area. I think of my time struggling to downsize Detroit’s built footprint during our historic insolvency while urban sprawl continued. Land use in metro Detroit today should inspire this sort of urgency. We have to find a way to bring planners’ maps into the minds and hearts of all stakeholders, without whom, improvements in my lifetime are hard to imagine.
Janet Anderson, PhD is a lifelong Detroiter and urbanist with 30+ years planning public services for the city of Detroit and the Public Lighting Authority of Detroit. She has a PhD in Urban Policy Analysis and is on faculty of Wayne State University’s Public Administration Program, and she writes a free Substack “The Commons: All About Us”
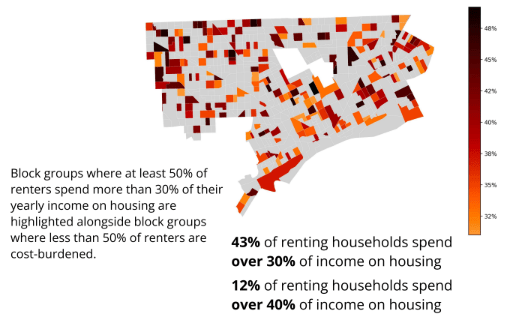
This case study visualizes yearly housing cost burden across Detroit’s census block groups using 2024 American Community Survey data. A density chart plots block groups reporting both renter and owner median housing costs as a percent of yearly income. The near-zero regression slope between renter and owner cost burden suggests these pressures are structurally distinct, indicating a rental market that extracts disproportionately from tenants independent of neighborhood-level ownership costs. Block groups where at least 50% of renters are cost-burdened, spending more than 30% of their yearly income on housing, are highlighted alongside block groups where less than 50% of renters are cost-burdened. 43% of renting households spend over 30% of income on housing, and 12% of renting households spend over 40% of income on housing.
Localized housing cost is a variable in Detroit’s urban system that links individual financial uncertainty to neighborhood-level disinvestment, displacement, and resilience. Housing cost burden does not exist in isolation — it is a pressure point within a larger network of urban dependencies, where the share of income absorbed by rent shapes what households can spend, save, invest, and contribute to the communities around them.
Hannah VanWingen Eckertova is a researcher working at the intersection of data-driven decision-making and social equity. My broader practice is oriented toward the premise that rigorous, accessible data visualization is an art form of advocacy. When patterns become legible — spatially, statistically, comparatively — they become harder to ignore. I make visual art because I believe a more equitable world is built through better decisions, and that better decisions begin with better understanding through creative means.
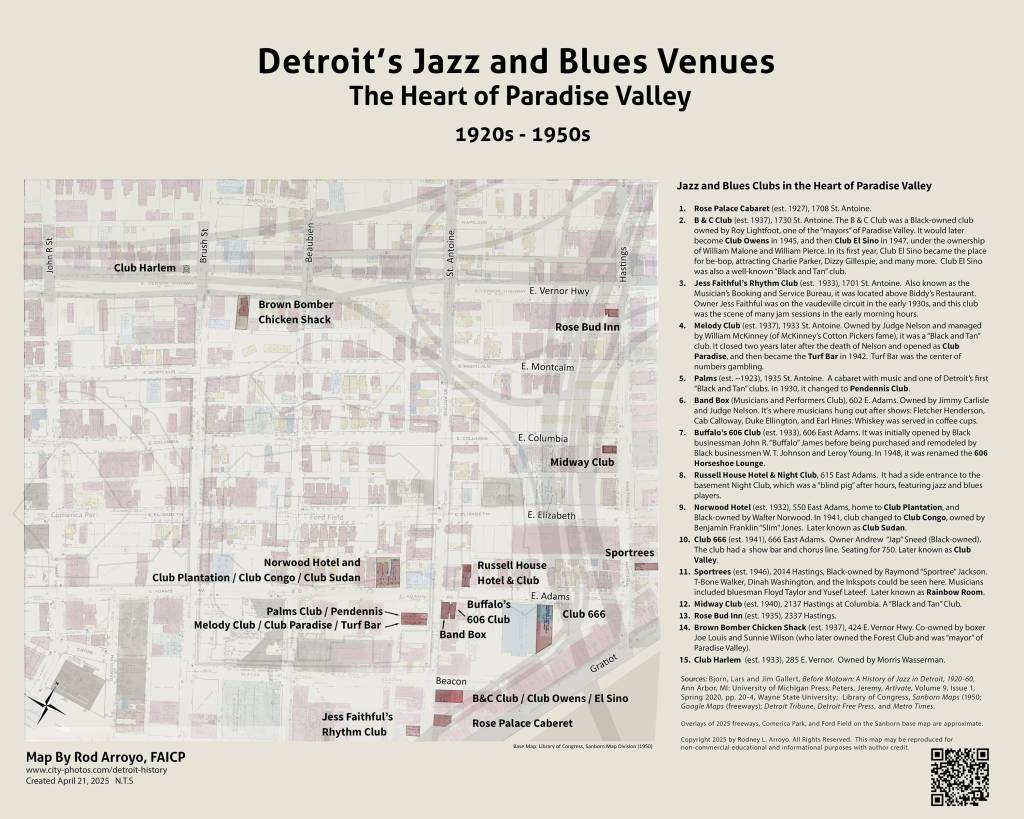
Before Motown put Detroit on the popular music map, the city was already swinging with jazz and blues venues. From the mid-1930s through the early 1950s, Paradise Valley and Sugar Hill — vibrant and mostly-Black neighborhoods clustered north of Gratiot, east of Woodward, south of Warren (Sugar Hill), south of Mack (Paradise Valley), and extending to Hastings Street (now the southbound I-75 service drive) — provided the beating heart of Detroit’s jazz and blues scene. Bars, cabarets, show bars, and nightclubs lined these blocks, drawing legends like Duke Ellington, Cab Calloway, Charlie Parker, and Dizzy Gillespie, and lifting up Detroit legends such as Milt Jackson and Yusef Lateef. In the Paradise Valley and Sugar Hill neighborhoods, there were over 50 venues in total. This map, created by urban planner, tour guide, and jazz archaeologist Rod Arroyo, charts 14 sites and 24 venues in the heart of Paradise Valley. They were community anchors, jazz incubators, and cultural gems in the city.
Rod Arroyo, FAICP is a Detroit-based urban planner, researcher, and educator with a Master of City Planning from Georgia Tech. A Fellow of the American Institute of Certified Planners, he served as a Partner at Giffels Webster, one of Detroit’s leading planning and engineering firms, and as an adjunct professor at Wayne State University. His research focuses on downtown and Detroit’s historic and predominantly Black neighborhoods, including Paradise Valley, Black Bottom, and Sugar Hill. Rod shares that expertise as a lecturer and as the owner of Detroit Legacy Tours, connecting residents and visitors with the city’s diverse and complex history.
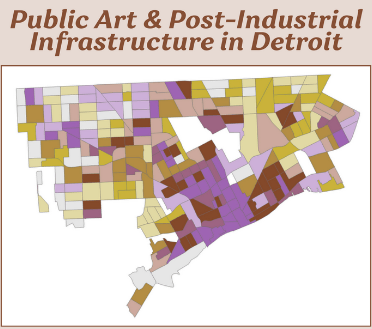
“Public Art, the Post-Industrial, and Economic Opportunity in Detroit” examines the geospatial and demographic relationships between Detroit’s physical and creative infrastructure with community financial prosperity. The practice of creative placemaking asserts that public art supports community and economic development, and Rust Belt cities such as Detroit have utilized their vacant areas as canvases for these efforts. On the other hand, vacant areas may also suggest a lack of community and economic development. Through using ArcGIS and open data, this research serves to answer the following: What correlations exist between public art and economic opportunity in Detroit? Are these trends impacted by a location’s relative blightedness?
This work explores correlations between creative and physical infrastructure, as well as the trends of economic health and opportunity for census tracts within each bivariate quadrant.
Andy Frantz is a graduating urban sustainability student at Oberlin College. She plans to pursue graduate study in urban planning this fall, focusing on community-driven economic development and public participation efforts, especially those involving public space and cross-sector collaboration. Her research focuses on pubic art and creative economic development in post-industrial spaces.
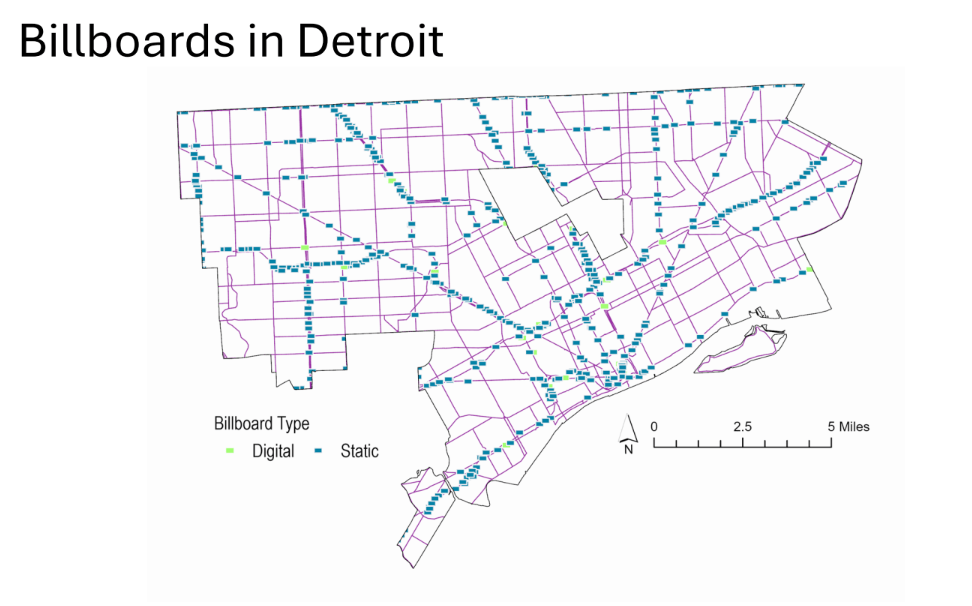
This map shows the billboards in Detroit using a dataset from MDOT. You can find the complete dataset at DetroitData.org.
The placement of billboards along major roadways reflect the busiest throughfares in the city. In a world of increasingly individualized and targeted advertising, billboards represent one of the last communal advertising experiences. The relative accessibility of billboard advertising creates a space for local organizations and businesses in a world dominated by mega-corporations. Coming back from abroad, I knew I was home as soon as saw Joumana Kayrouz’s face.
by: Laura Bailey “LB” Brandon, map by Joanne Coutts
From my apartment window, I see the Detroit River. On a sunny spring afternoon, small boats float along its edges, carrying silhouettes of fishermen as the current gently pulls them west. The surface is dimpled by ripples, vibrating like static on a blue screen. I imagine standing at the shore where air lifts warmth from water to land, and my body, between the two, acts as a conduit of heat. As I often do, I envision jumping in, riding the river past downtown and south around the bend, drifting downstream away from the city. For this mental journey, I grab hold of Zug Island and climb into the mouth of the Rouge River. I swim upstream, gagging at heavy industry and holding my breath past the sewage treatment plant. After the Dix Ave bridge, I turn right at the fork and paddle past mountains of steel mill slag, until the open river ends. Feeling adventurous, I dive beneath Ford factories to find the path of Campbell Creek, now enclosed by concrete. I track this natural waterway turned underground drainage system north past I-94, below homes and neighborhoods, exploring the streams now tunnels beneath the city. I follow the water to O’Shea Park on the banks of I-96.
My husband, Andy, and I met Jo Coutts at O’Shea Park in early March to lay the groundwork for a mapping project she envisioned. Jo is an activist, writer, and artistic cartographer who spends winters in the Sonoran Desert, supporting humanitarian aid at the US/Mexico border using counter-mapping*. She spends the rest of the year at home in Detroit, lending her time and creativity to advocate for water rights and the rights of water. We initially met Jo at our first Ride With Purpose event in July, 2023. She joined a group of scrappy riders, curious to see how we navigated the city by bike while promoting community efforts of resiliency. Since then, she’s made it to most of our rides and has even led a few, welcoming us and other riders to participate in her Mapping Detroit’s Buried Waterways project. Jo has become a dear friend — someone who challenges my conventional view of land navigation and place, helping me to see that reimagining geography can be an act of both resistance and solidarity.
*Counter-mapping is the practice of creating maps that challenge dominant, colonial, government-sanctioned geographies in an effort to uplift marginalized perspectives such as Indigenous knowledge, community experiences, and social injustices.
In 2021, Jo began a massive undertaking. She used historical maps of Detroit, layered beneath modern street maps, and a mobile navigation app to reorient herself based on natural waterways and manmade drains that were once exposed to fresh air and accessible to most beings. She mapped buried waterways by riding her bike over 300 miles within the city, following the path of water once seen by the sun. In 2024, she published the What’s Your Water Address Map, a tool for Detroiters to reinterpret their physical address from the perspective of water networks. This year, inspired by the fight for affordable water in Detroit, Jo had the idea to take this concept a step further and use mapping to visually represent a lack of water access in juxtaposition to buried creeks, seeking to reveal the hypocrisy of limiting water to homes built next to and over water sources (which is most of the city). She recognized that blue lines spray-painted in front of homes signified water shutoffs. These blue lines highlight residential water access points and are used to mark places where the Detroit Water & Sewerage Dept (DWSD) planned to terminate service by shutting off the flow of water to a home. Typically these shutoffs were carried out when someone couldn’t afford to pay their water bill, like in 2014 when DWSD initiated the largest residential water shutoff in US history, ending water service for over 30,000 households, an unjust act that was challenged by residents and local activists, brought to court by both the ACLU and NAACP, and condemned by the United Nations as a human rights violation.
From O’Shea Park in early March, Andy, Jo, and I followed a route we made using Jo’s buried creeks map as a reference — a bikeable loop which connected about 4 buried waterways. We rode slowly through neighborhoods in this northwest section of the city (Plymouth-I96, Schoolcraft-Southfield, Greenfield-Grand River, Hubbell-Puritan, Harmony Village, Bethune, Happy Homes, Grand River-I96, and Plymouth-Hubbell), mentally noting the number of blue lines on each block. During this practice ride we learned to keep on sidewalks to spot blue lines, avoid commercial areas (where homes were scarce) and dangerous intersections (where biking was hazardous). A week later, Andy and I returned to ride 3 more waterways through adjacent neighborhoods (Barton-McFarland, Littlefield, Northwest, and Grand-River-I96, plus Grandmont and Crary/St Marys). We recorded data by tallying blue lines on each block and noting the number on maps we kept in our pockets. All this was in preparation to lead a group of riders on a map-building quest for our 21st Ride With Purpose event.
On Saturday March 21st, the day before World Water Day, Andy, Jo, and I returned to O’Shea Park with maps, pens, and words to share with whoever decided to join our first ride of the year. Soon cars started pulling up with bike racks packed — a few friends, though mostly new acquaintances. Fourteen people came to ride that day, eager to enjoy an afternoon in the sun and intrigued about our counter-mapping project. From those who lived in the city to folks who drove from the burbs, some who hadn’t ridden in years to others who cycled year-round — all with a common goal to experience both outdoor recreation and community activism. Once the group had gathered, Jo spoke about her work mapping waterways, Andy talked about biking etiquette, and I explained the task at hand, how we’d carefully collect data and use it to build our map. We asked for a few volunteers to be data-collectors and note-takers, then we mounted our bikes and hit the trail. The beginning of our ride followed a grassy path to a highway overpass. We pedalled hard up and over I-96, then stopped on the other side to see an example of a blue line. From there, we rode steadily north along neighborhood streets, occasionally crossing commercial corridors. Everyone seemed relieved to feel the heat of the sun on their faces, their skin chilled by the cool air and eased by the light breeze. We stopped every few blocks for our note-takers to record the number that data-collectors discreetly shared with them. It was important that we didn’t single out residences, record personal information, or make assumptions.
Our route took us north, then east, then north, then east — a staircase pattern tracing the flow that water once took. When pursuing buried creeks, you can’t follow every turn and curve of a natural waterway with the squareness of the built environment standing in your way. We did our best using the grid of neighborhood streets. When we reached the end of one waterway along Puritan St (south of W McNichols) we turned back and used Schaefer to cut south towards another. Again we followed a staircase pattern, following the water we couldn’t see. We stopped for a break on a grassy corner and tended to a data-collector’s flat. One of the riders and his kiddo (who rode in a child’s seat on the back of his bike) had to pedal ahead for dinnertime. We shared hearty goodbyes. After changing the flat we realized that all 3 patch kits we brought were expired, and the best patch didn’t hold. (In hindsight, we should have used a tube!) Luckily a plan was devised to safely return the inoperative bike to O’Shea, leaving us down another 3 riders. Those that remained continued on the mapping journey. We rode the invisible water back to our starting point, glad to be together and reunite with our break-away riders. After some reflection and more connections, we gathered for a group shot and thanked each other for the time we shared together. It was inspiring to see so many like-minded individuals willing to explore less-frequented biking routes in pursuit of community well-being.
Before Jo pointed out the blue lines, I had never even noticed them. Now I see them everywhere. They remind me that the city controls our water and we are never guaranteed what should be a basic human right. When I spot a blue line, I hear the voices of comrades in the struggle for water rights, like my friend Val of the People’s Water Board Coalition who’s been directly impacted by the shutoffs and has been fighting for statewide water affordability for over a decade. To her, these markers were known as “blue lines of shame” — identifiers that stigmatized residents who struggled to afford high water bills. Our goal with this project was to reverse this narrative, showing, from a street-level view, that water access affects entire communities, not just individuals and families. We want people to see the absurdity of limiting water access in a city built on water. Having your water shut off is no moral failing, it is a consequence of a system that values money over people. The data we collected in northwest Detroit was used to create a map of water shutoffs over buried waterways. While the data isn’t 100% accurate, we feel that the map is a fair representation of this concept. Whether it’s your water, your neighbor’s water, or someone down the block, we all need water just as much. Water should be affordable, accessible, and sustainable regardless of where you live or how much you can afford. Maybe one day we can bring the light of day to some of our city’s waterways…
Save the date for our next Ride With Purpose event!
Follow @ridewithpurposedetroit to stay in the loop. Date: Sunday, June 28th Time: 2pm to 5pm Address: 1812 Field St, Detroit, MI 48214 Partner: Detroit Community Fridge Route: ~14 miles, round-trip Activity: Cleaning & stocking community fridges on the eastside
I created this map as part of a project with Friends of the Rouge and the University of Michigan Detroit Center to share the importance of shore fishing to the Boynton, Delray and Oakwood Heights communities around Fort Street Bridge Park and Zug Island.
Shore and small boat fishing are popular activities all across Detroit. Even in the neighborhoods far from the river there are boats lounging on their trailers ready to be launched into the water. Many of the city’s Fish & Chicken restaurants offer fish cleaning services for a small fee. On the Riverwalk there are special trash collection points for lines and hooks. And on a nice evening at all seasons of the year Detroiters pull their cars up as close to the river as possible, set up their lines, open a can of pop, and wait for a fish to bite.
This map is an attempt to bring a feeling of cohesion to the layout of the park. Many areas feel disconnected from each other, and I believe this is largely due to the overabundance of car infrastructure. As an island, I don’t think it makes sense to fully pedestrianize the park (as was done with Central Park and Prospect Park in NYC) due to the lack of transportation options for getting to the park. That said, I believe restricting car access to a few strategic roads would really help visitors feel like they’ve been transported to a magical realm as opposed to driving around an underwhelming theme park filled with a series of scattered, dilapidated attractions. To create the desired feeling of cohesion, I believe it is necessary to take a master planning approach to the whole island with full pedestrianization of Central Avenue as a core feature.
Comparison
See the slider below for a visual comparison between the existing park and my recommended improvements:
Summary of Changes
The list below is a summary of the changes that I made to the map and other recommendations:
Routes
Car Access
Cars are limited to the perimeter loop, three new/modified transverse roads, and a modified Loiter Way (which provides a secondary connection between the transverse roads).
Belle Isle Drive
The entire perimeter loop should be renamed Belle Isle Drive to avoid the confusion that results from using multiple names for the same road.
At most, the loop should have two through lanes for cars.
Ideally, I would love to see a dedicated streetcar lane added to the loop on grassy tracks to provide public transit access.
Transverse Roads
Grand Boulevard (Transverse Road 1 of 3)
Muse Road has been extended north and is treated as an extension of Grand Boulevard and the MacArthur Bridge.
Inselruhe (Transverse Road 2 of 3)
The Alpheus Starkey Williams equestrian statue has been moved from the intersection with Central Avenue to a circular plaza further east on Central Ave that demarcates the transition from a linear promenade to a nature path.
This must be done to facilitate the construction of an overpass over Central Avenue (see following section on overpasses).
Vista Drive (Transverse Road 3 of 3)
Vista Drive has been reconnected across the old zoo.
Overpasses
To facilitate an uninterrupted pedestrian experience from one end of Central Avenue to the other, the transverse roads will utilize overpasses at all intersections with Central Avenue.
The inspiration for these overpasses largely comes from the various arch bridges in Central and Prospect Parks in NYC.
In addition to allowing free flowing pedestrian movements, they create a “portal” between different sections of the park.
Pedestrian paths in a partial cloverleaf pattern will allow pedestrians to walk between Central Avenue and the transverse roads.
Canoe Routes
Modifications to bridges may be required to restore full canoe access to all the canals and lakes without requiring boaters to duck or portage.
Canoe stations are marked along the routes for the canoe-share system.
Similar to a bikeshare system (MoGo in Detroit), users can dock and undock canoes at various points around the island through the use of an app or kiosk.
This gives boaters the flexibility to paddle to an area, dock, explore, and then undock again (even at a different station) and continue boating around the island.
Welcome Area
The area West of the MacArthur Bridge landing will be used as a welcome center with parking, informational kiosks, and park offices.
This offers a natural place for such facilities as it is close enough to the bridge entrance to the park without car traffic backing up onto the bridge while waiting to park.
An overpass over Pleasure Drive will allow park patrons to park their car for the day close to the bridge, and then easily drive back to the bridge when leaving without conflicting with traffic entering the island or driving significantly out of the way.
Fountain Area
There are terraced, concentric paths that radiate out from the fountain that are inspired by the Concert Grove area of Prospect Park in Brooklyn, NY.
In general, the landscape in this area goes from a low point near the canal and works its way up to the fountain as the high point.
The first tier is lined with commercial buildings. These buildings would be two-to-three stories and include a grocery store, pizzeria, ice cream parlor, and other shops and restaurants on the first floor, while the upper floors would either include lodging or additional shops and restaurants.
There are 48 lots that range from 20 to 30 feet wide.
This commercial district gives parkgoers the option to pick up any last-minute picnic supplies, have a hearty breakfast before exploring the island, or enjoy an ice cream cone at the end of a long summer day at the park.
Botanical Garden
Loiter Way has been realigned to allow more room for the creation of a botanical garden with the Anna Scripps Whitcomb Conservatory, the adjacent formal garden, and the Oudolf Garden as the anchor points for expanded garden facilities.
Zoo
The zoo has been shifted to the area bounded by Inselruhe, Vista Drive, Central Avenue, and Loiter Way.
It should serve an educational purpose and contain animals native to Michigan such as deer, black bears, foxes, wolves, bobcats, coyotes, moose, turkeys, sandhill cranes, etc.
This replaces the existing Nature Center and the old zoo.
The playground and Giant Slide currently in this area have been moved west to the southern half of the Middle Grounds near the parking lot.
Golf
All golfing facilities have been moved to the area north of Lake Muskoday and adjacent to the Yacht Club.
This is done in part to restore full pedestrian access to the loop around the Blue Heron Lagoon.
Bandshell and Amphitheater
A new band shell and amphitheater have been added to the southern end of the Blue Heron Lagoon.
This is to replace the band shell that must be demolished to make room for the new Botanical Garden.
The new location takes advantage of an existing hill though additional fill may be necessary.
Beach House
The current Beach House has been replaced with a neoclassical structure inspired by Roman baths and has a covered pool which opens into the river.
Ferry service
A ferry and riverboat pier has been added to the northern extent of Fountain Way.
The route would connect several points along the riverfront and include express service between Hart Plaza and Belle Isle.
Belle Isle Research Station
The area that contains the stables, the greenhouses, and the White House will form the basis of a collaborative research station shared by Michigan’s major universities.
Seasonal study programs will provide students with the opportunity to gain hands-on experience in a variety of topics such as agriculture, botany, animal science, forestry, architecture, business, etc.
In addition to hosting research, this station will assist in the operation of Belle Isle, including horse rental, supplying the botanical garden with plants, managing the Nature Preserve, tending to the animals in the Zoo, etc.
Casino
The pond between the Casino and the loop will offer a staging area for canoe rental in the Summer and a skating rink in the Winter.
The Casino will house a counter for boat and skate rental as well as public restrooms, a café, a fine dining restaurant, banquet halls, and lodging.
Athletic Fields
Additional paths and facilities have been added to the area west of Vista Drive.
The area east of Vista Drive has been cleared for additional athletic fields.
This is largely inspired by the original Olmstead plan which called for this entire area to be part of the Parade Grounds.
Nature Preserve
Some changes have been made to the paths through the Nature Preserve area.
All paths in this area must be car-free.
A clearing has been added to the eastern edge of the area to provide picnic space in a more forested setting.
Park Areas
The map below includes labels to indicate each distinct area of the park.
Park Amenities
Below is a summary of the amenities that the park would offer:
Hiking
Biking
Swimming
Horseback Riding
Boating
Ice Skating (winter)
Picnicking
Fishing
Golf
Athletics
Baseball
Basketball
Football
Soccer
Tennis
Dining
Shopping
Lodging
Botanical Gardens
Zoo
Aquarium
Playground
Band Shell
University Research
Conclusion
These recommendations are meant to create a flowing park experience that feels more cohesive and more walkable than the current layout. I like a lot of the work that has been done over the past couple of years between the mobility study and the Belle Isle Commons projects, but I wanted to share my own vision as I believe it presents a strong, high-level perspective.
The addition of commercial and university research facilities would help secure consistent funding and create incentives for maintaining the park in a state of good repair while adding new amenities. I believe these changes, along with the others outlined in this article, would make Belle Isle a world-class park.
The What’s Your Water Address? project asks us to understand the place that we call home from the perspective of its relationship to water rather than concrete. The project was conceived by Great Lakes Creatives (a group of Michigan based water protectors from across the state) in response to an invitation from Jannan Cornstalk of the Little Traverse Bay Band of Odawa Indians for water protectors at the annual Water is Life Festival to introduce themselves including their water address.
The basis of your water address is the watershed. All of us in Detroit live in the Lake Erie watershed. This is like our state in the road atlas. Then there are four major river watersheds that Detroiter’s call home – the Rouge River, Clinton River, Lake St. Clair and Detroit River. The river watersheds can be seen as the water address equivalent of the city on a street map.
Detroit’s buried creeks and their tributaries, canals and drainage ditches are the neighborhoods and streets of our water addresses. To find them I looked at historical maps at the Burton Historical Collection at Detroit Main Library, University of Michigan’s Clement’s Library, the U.S. Geological Survey, the Library of Congress, the National Archives, and the British Library in London.
To find your water address on the map, use the freeways and main streets outlined to find the general location of your house. Then…
Find the 3 letter code for the creek, drain or ditch closest to your house. Look up the code on the table below to find the name of the creek, drain or ditch. This is your water street. Eg: MES = Messmore Drain.
Identify which creek system you live in. This is your water neighborhood. Eg: Baby Creek.
Determine which river watershed your neighborhood is in. This is your water city. Eg: ROUGE RIVER WATERSHED.
My water address is: Messmore Drain, Baby Creek, Rouge River Watershed, Lake Erie Watershed
I am delighted to be sharing more about the What’s Your Water Address? project at a couple of events around World Water Day, which is Sunday, March 22, 2026. Please join me on:
Saturday, March 21 at 2 p.m. to collaborate with Ride with Purpose on a bike ride along buried waterways, in search of “blue lines”. These blue lines were spray-painted on sidewalks near residences and businesses who were slated to have their water shut off by the city. We’ll tally blue lines, block-by-block, to create an artistic rendering of shutoffs in juxtaposition to buried waterways, seeking to visually represent the absurdity of limiting water access — that Detroiters could be cut off from the water they need to survive while water once abundantly flowed near their homes. The lines we’ll encounter were known by many as “blue lines of shame” — identifiers that stigmatized residents who struggled to afford high water bills. We seek to reverse that narrative by showing that water access affects entire communities, not just individuals and families. Having your water shut off is no moral failing, it is a consequence of a system that values money over people. We will meet at the O’Shea Playground, 15810 Capitol St, Detroit, MI 48227. The ride will be approximately 10 miles round trip.
Starting with Zeebee, just south of Joy Road, and running north to Livernois Fresh Fish on the southeast corner of Livernois and Seven Mile, Livernois Avenue has been called the “You Buy We Fry Miracle Mile.” This stretch of Livernois between 8 Mile and Joy is home to both the big names in Detroit Fish & Chicken, Captain Jay’s and Manhattan, and an array of stand-alone independently owned Fish & Chicken Joints.
The longest operating Fish & Chicken Joint on Livernois, Bosco Fish, Seafood and Poultry, just north of Fenkell Street has been cleaning fish for Detroit anglers and serving fish for dinner since 1951.
Both located between Grand River and Fenkell, Livernois highest rated Fish & Chicken Joints on Google are A1 with 4.6 stars and Blue Sky with 4.5 stars.
Detroit’s own Captain Jay’s, founded in 2003 and offering groceries as well as carry-out fish and chicken dishes sits on the opposite side of Livernois from University of Detroit Mercy and the Pink Diamond Beauty Mall.
The other big player in Detroit Fish & Chicken, Manhattan, has two locations on Livernois, one at the busy intersection of Livernois and Davison and the other almost next door to its rival, Captain Jay’s. Unlike Captain Jay’s, Manhattan is not a restaurant chain or franchise but a group of affiliated Fish & Chicken Joints known for their special style of fish and chicken and their lemon pepper seasoning.
All but one of the Fish & Chicken Joints on Livernois accept EBT.
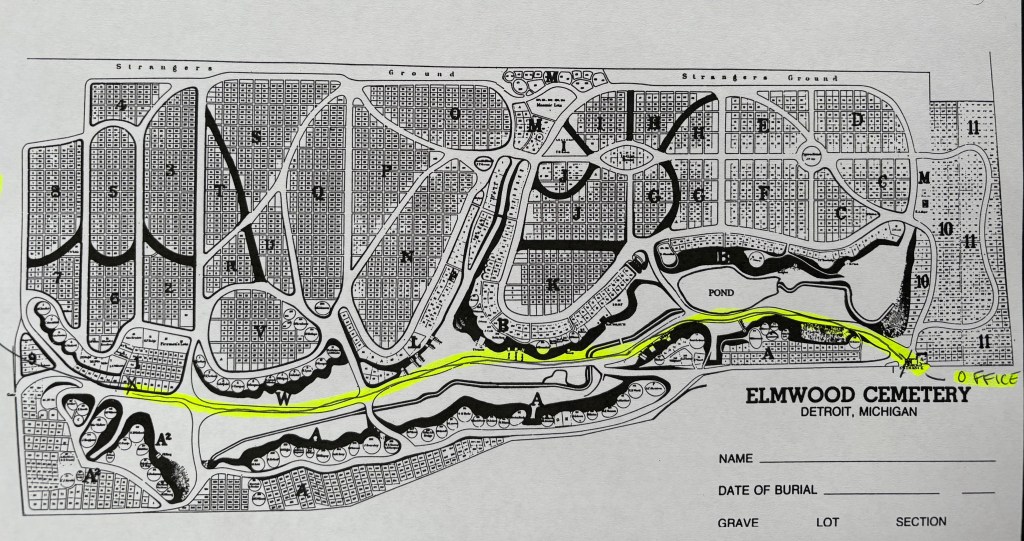
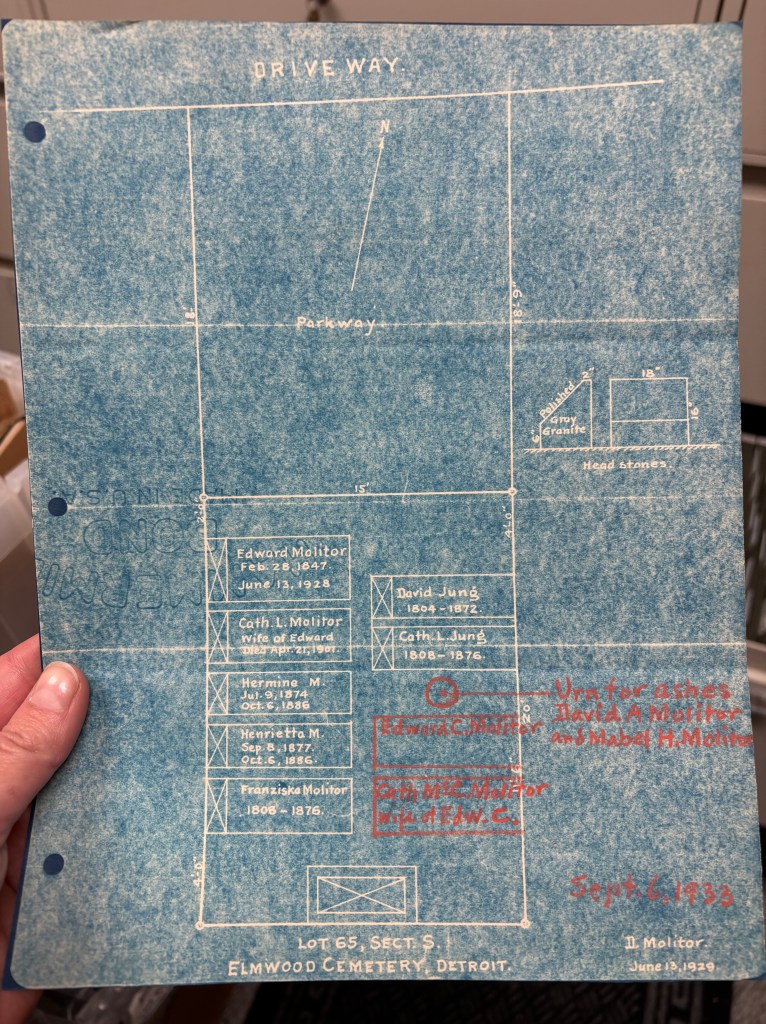
If you’ve ever visited Elmwood Cemetery and asked for the location of a gravesite, we may have given you a map. That map probably looked like this:
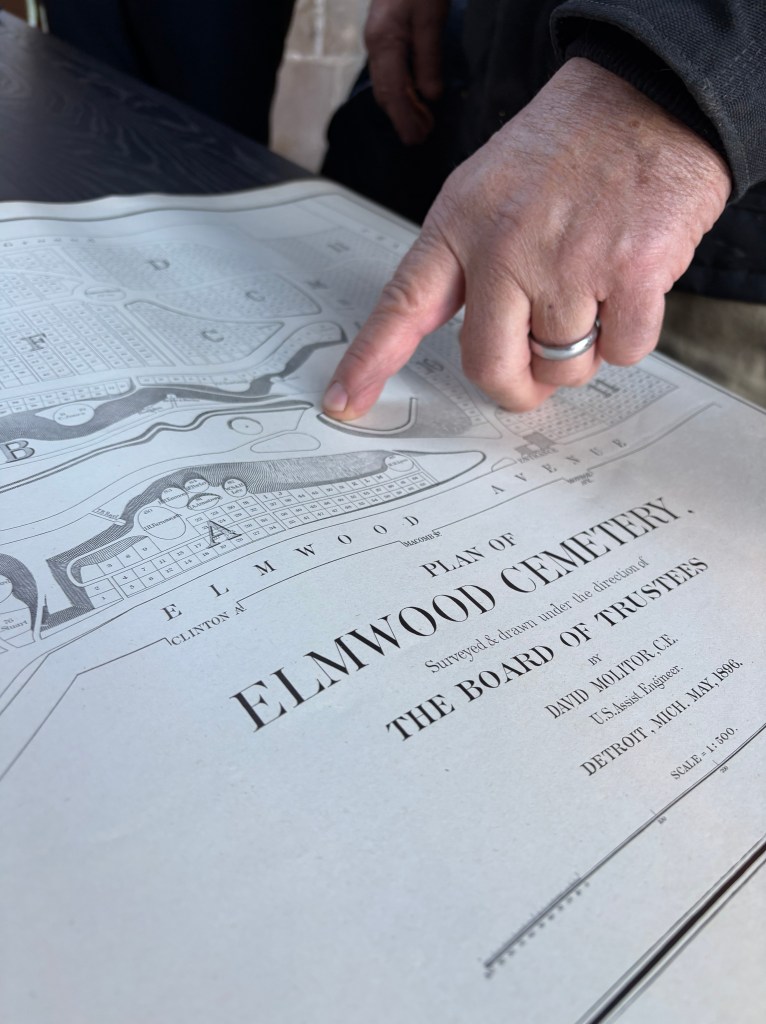
Hopefully, that map got you where you needed to go. If it did, you can thank our helpful staff, but also David Albert Molitor, who surveyed and mapped the cemetery about 130 years ago, when he was 30 years old.
Several other cartographers and surveyors have made significant maps of Elmwood throughout our history. Our first map was reportedly made by Augustus Canfield of the U.S. Army Corps of Engineers, although no copies of this map apparently survive. (The trustees reported they’d lost hope of finding it way back in 1880). Legendary mapmaker and historian Silas Farmer published a beautiful map of Elmwood in 1865, and our visionary superintendent A.W. Blain made his own map 20 years later. But the Molitor maps have a special place in our history as the maps that have lasted the longest, and the maps we still use today.
Molitor, born in Detroit in 1866, would become a civil engineer of international repute. Shortly after completing the Elmwood map, he went to work on the Poe Lock at Sault Ste. Marie, the largest lock in the world when it opened in 1896, where he oversaw construction of the lock’s gates. In 1906 he was commissioned to work on the Panama Canal, where he was the designing engineer of its locks and emergency dams. He worked on the sea walls of the Toronto Harbor and the superstructure of the Memphis Bridge over the Mississippi River. I think of Molitor whenever I see the Fisher Building, a crown jewel of Detroit architecture. You already know it’s an Albert Kahn – but David Molitor designed its steel frame.
When Elmwood’s trustees hired Molitor to make a new map of the cemetery in 1895, it was a pivotal time for the cemetery. The trustees were working to implement a set of recommendations from influential landscape architect Frederick Law Olmsted to preserve Elmwood’s historic and natural character. (These recommendations included removing excessive lot decorations, investing heavily in tree maintenance and planting, and avoiding straight lines and 90-degree angles when laying out roadways.) A new public mausoleum was under construction along the creekway. And they were adding acreage and laying out new burial lots to serve a population that had grown tenfold in the half-century since the cemetery was established.
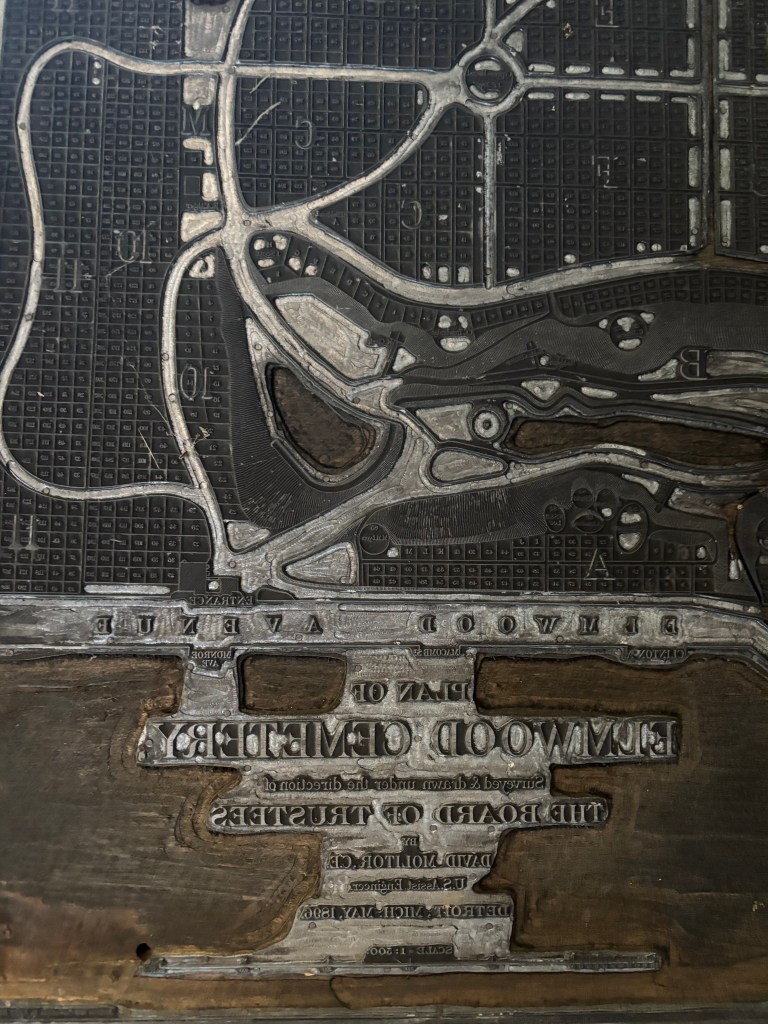
Molitor agreed to a fixed $500 fee for the entire project, which was completed the following year. Molitor joined several board meetings to discuss his specifications for the map and to present his drafts and invite critique. According to our minutes from these meetings, the trustees were pleased with his work and approved the final design without much back-and-forth. We still have the original copper plate that was used to print the Molitor map.
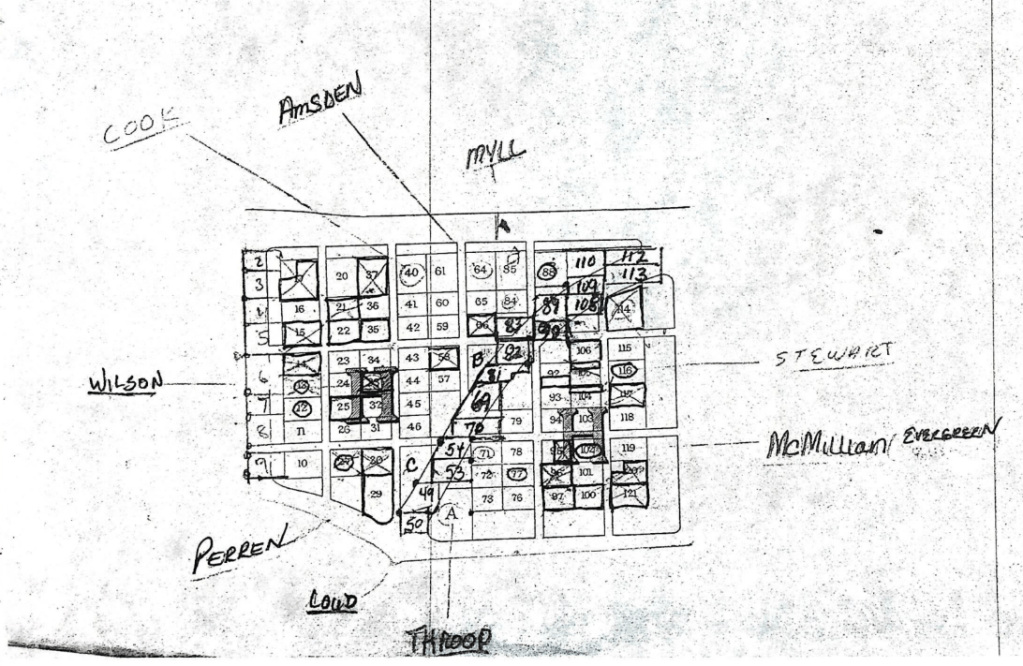
American cemeteries are designed with eternity in mind, but of course they do change over time. Elmwood’s boundaries are more or less the same today as when Molitor made his map, but more than a few things have changed on our grounds since then. We’ve laid out new burial lots, constructed a new public mausoleum, bumped out hilltops and infilled roads. Some of those changes were added to the Molitor map in 1906, when we hired the engineer Paul Heinze to make a few updates. Heinze began his career as a railroad engineer but later became known for his cemetery lay-outs; his c.v. includes Grand Lawn in Detroit, Roseland Park in Royal Oak, and Michigan Memorial in Flat Rock.
But in the century since Heinze added his byline to the Molitor map, we’ve made map changes in-house – by hand. It’s not the most sophisticated system, but it does what we need it to do.
Molitor died in 1939 and was buried on his family lot at Elmwood on Section S. He designed the lot himself.
There will come a day, and it may not be too far in the future, that we retire the Molitor map. But for generations of staffers and visitors, the Molitor map is the map of Elmwood Cemetery. Ask for a copy next time you stop by the office. Molitor made it to last.
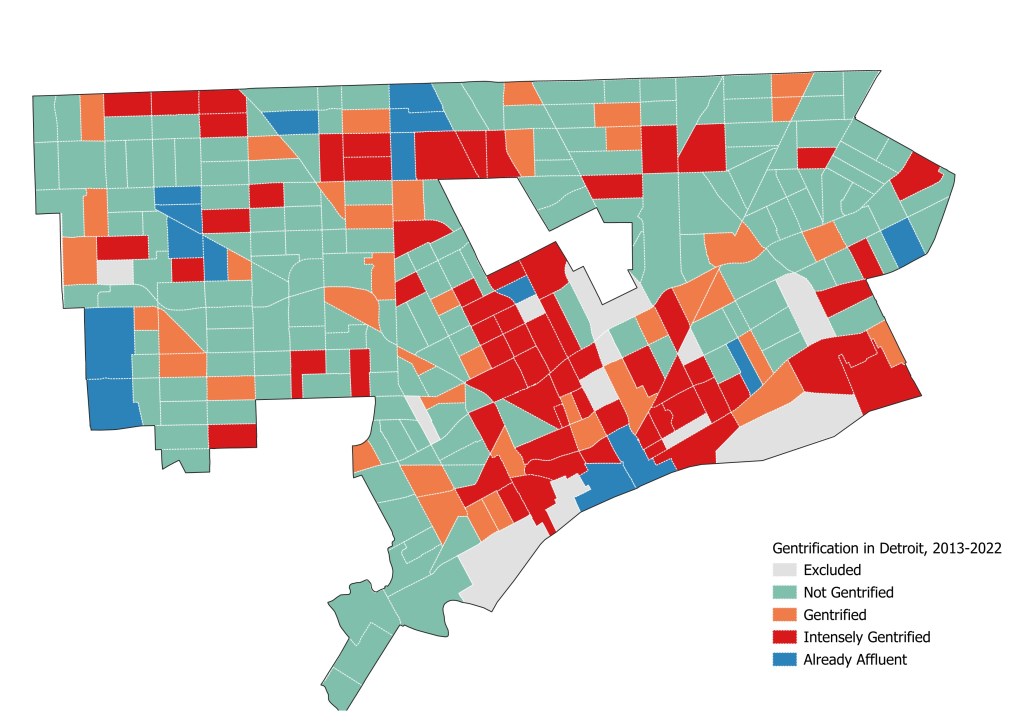
In a recent study, Alisha Butler (Wesleyan), Danica Brown (independent scholar), Michelle Taylor (Wayne State University), and I studied the dynamics of gentrification in Detroit and its relationship with middle-class families’ school choices in the city. As part of their analysis, they prepared a map of gentrification status by Census tract. The map provides a useful update on gentrification status after a decade of substantial but uneven development throughout the city. These findings update prior work from the 2000s and early 2010s, which had documented intense gentrification downtown but low overall levels of gentrification in the city.
We used a measure of gentrification proposed by the Urban Health Collaborative (UHC) at Drexel University. Their measure is based on changes over time in local incomes, college education levels, home values, and rent prices. Census tracts are classified as “not gentrified,” “gentrified,” or “intensely gentrified”—which helps goes beyond a binary of either gentrified or not. Their measure also provides guidelines for excluding tracts based on low population (<50 people) or missing data; and labeling tracts as “already affluent” based on high starting levels of household income, home values, and education levels. Following this method, we used one decade of Census Bureau tract data—from 2013 through 2022—to produce our measures of gentrification in Detroit.
We found that about 22% of Census tracts in the city intensely gentrified between 2013 and 2022, while another 14% gentrified (but not intensely), and 55% did not gentrify. We also identified 5% of tracts as “already affluent” and 4% were excluded. From the paper:
Intense gentrification was concentrated in the greater downtown and midtown areas, as well as neighborhoods expanding southwest, southeast, and north of the city’s downtown. Some intense gentrification is also concentrated in the northern part of the city. Gentrifying tracts are found throughout the city, though they are often found adjacent to intensely gentrifying tracts.
Changes over time in the socioeconomic characteristics of these tracts help illustrate the contours of gentrification. Both intensely gentrified and already affluent tracts had sharp increases in the share of residents with BAs, the median income, home value, and median rent. Gentrified tracts, compared to those that did not gentrify, had greater increases in the share of residents with BAs, as well as slightly higher home values, but median incomes and rents remained comparable. In addition, the share of residents with BAs and median home values in gentrified tracts remains much lower than intensely gentrified and already affluent tracts.
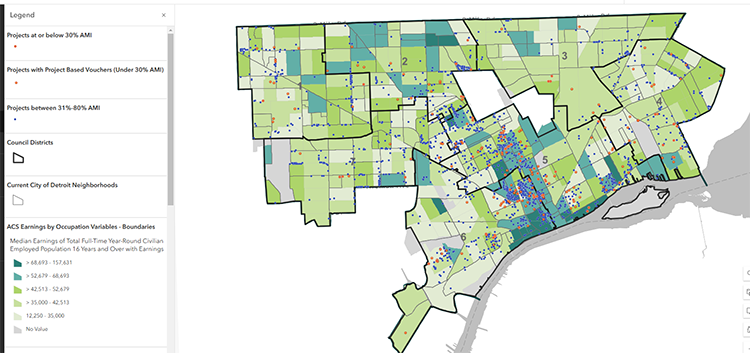
There’s been a lot of attention on Detroit’s affordable housing initiative recently from politicians who planned on using Detroit’s policies as an inspiration for the country’s policies. Having family who grew up in Detroit in the lower income brackets rallied my interest in what’s going on in Detroit’s housing department; I wanted to see how the City’s helping the less fortunate, and why it’s gaining so much attention. From HUD.gov, “The Project Based Voucher (PBV) program is a component of the Michigan State Housing Development Authority’s (MSHDA) Housing Choice Voucher (HCV) Program. The HCV program is federally funded by the United States Department of Housing and Urban Development (HUD) Public and Indian Housing (PIH) and is the primary resource for providing rental assistance to very low to moderate income families. MSHDA’s PBV program targets extremely low income (30% AMI) supportive housing target populations.” Also “The Project Based Voucher (PBV) program is a component of the Michigan State Housing Development Authority’s (MSHDA) Housing Choice Voucher (HCV) Program. The HCV program is federally funded by the United States Department of Housing and Urban Development (HUD) Public and Indian Housing (PIH) and is the primary resource for providing rental assistance to very low to moderate income families. MSHDA’s PBV program targets extremely low income (30% AMI) supportive housing target populations.”
In this map, the red dots show the ‘deeply affordable’ units, which is made up of 30% AMI and below, and projects receiving project-based vouchers. The blue dots show all other units that are still affordable between 31% AMI and 80% AMI. This shows there is a good spread of ‘deeply affordable’ units across the city, particularly in the higher earnings areas in the middle of the city. Using earnings as a proxy for higher opportunity areas, this shows a positive trend for the City. The colors of the map are broken out into different income levels shown by different colors. This information comes from the City’s Open Data Portal.
Overall, the City has a good spread of affordable housing, even in the lower income areas; this provides the resources for people to live comfortably, when they perhaps, otherwise, couldn’t. Deeply affordable housing in higher opportunity areas means that lower income individuals and families can benefit from living in these higher opportunity areas, and it’s a positive trend as the City aims to be somewhere where all can thrive as it redevelops post-bankruptcy.
Place names are an enduring and omnipresent way of remembering the past. The choice of place names informs whose version of history is commemorated and given precedence today, and in the future. Our daily interaction with the names of streets, parks, rivers, and buildings continuously reinforces a specific version of history and consciously and subconsciously informs our relationship to the places we live.
A Brief History of Place-Naming in Michigan
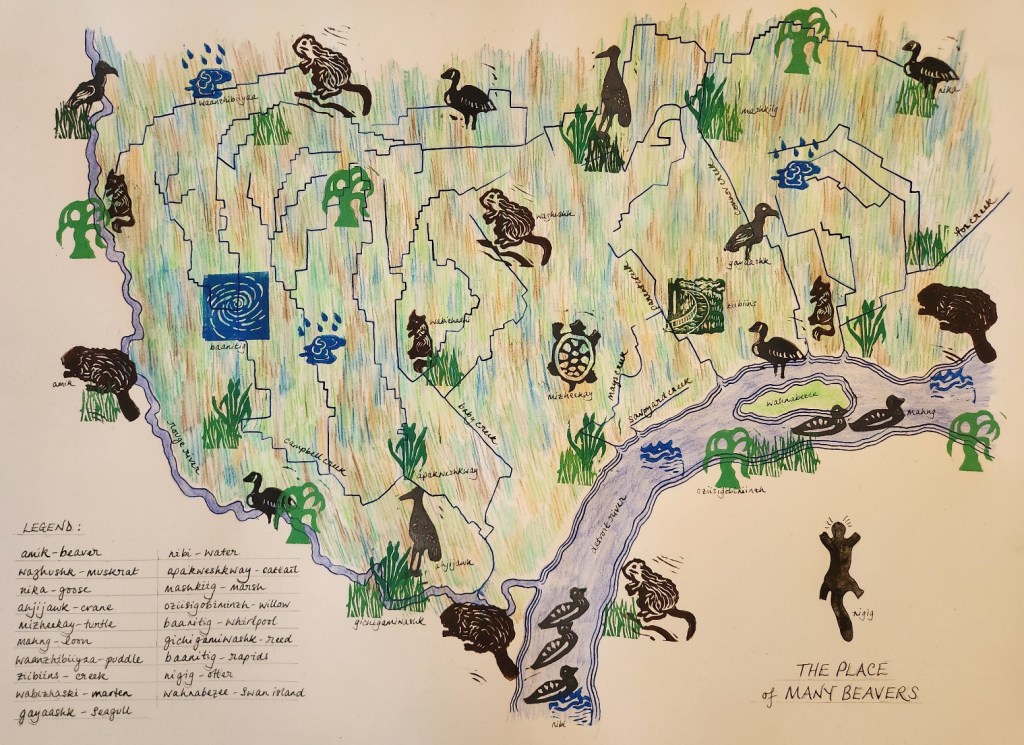
People have been naming places for as long as there have been people in places. Indigenous place names often relate to the intrinsic nature of the land. Teuchasa Grondie, the place of many beavers, is the place name Iroquois speakers call the place we call Detroit, and Maskigong, based on Ojibwe “mashkig” meaning “swamp,” describes the large wetlands at the headwaters of the Maskigong Ziibi (Muskegon River). Descriptive place names value the land for its innate properties and allow for the creation of practical maps that share knowledge of how to get from one place to another, using narrative stories, poetry, and song, as well as pictorial images.
Settler-colonialism brought with it the practice of naming places to claim land ownership. British, French, and Spanish colonizers asserted the collective ownership of their rulers and cultures through naming places for kings and queens, Christian Saints, towns and cities, and famous figures from their history. Hence across the river in Ontario there is a town called London and a river called Thames, and any number of places across the U.S. named for St. _____ and various Charleses, Marys and Georges.
Individual colonizers claimed ownership of land by affixing their names to the places they settled. To give just two of many examples in Michigan; Pellston was named by William Pells in 1882, to claim his ownership of a camp on the Grand Rapids and Indiana Railroad (Petoskey News Review, 14 April 1966), and on the Lake Michigan coast, Bliss was named for Rhoda Bliss, the first white woman to colonize there (The Petoskey Record, 19 September 1883). Many of the places the colonial settlers slapped their names on already had names. Some of these names were erased and replaced, such as Teuchasa Grondie by Detroit, and some were erased and colonized by language, for example, Maskigong to Muskegon, Michigami to Michigan, and Michinimakinaang to Mackinaw.
Later settlers stole not only Anishinaabe land but also Anishinaabe language to name places. Peter White, iron mining tycoon, appropriated the Anishinaabemowin word “ni-ga-ni” meaning “he walks foremost or ahead,” and anglicized it to Negaunee, to name a colonial settlement on the Upper Peninsula in honor of the “pioneer” ore furnace in the region. Henry Schoolcraft, US “Indian Agent” in Michigan, who incidentally has a street named after him in Detroit, made up place names by combining Anishinaabemowin and Latin. For instance, Arenac is a combination of Latin “arena” meaning sand and Ojibwe “ac” meaning land or earth made up by Schoolcraft to mean “sandy land” or “sandy place.” Some other Schoolcraft appropriated names include Alcona, Alpena, Iosco, Kalkaska, Oceola, and Oscoda. Before assuming that a place name is Indigenous in Michigan it is worth researching to ensure it was not made up by Henry Schoolcraft.
Place naming for individuals did not just rename the land, it redrew the map. Instead of explaining, verbally or pictorially, how to get from A to B by describing the features of the land, maps now facilitated navigation using the names of the local colonizers. This orientation around ownership claims removed a layer of connection to the land as people walked or rode along the path navigating, not by the wetlands at the headwaters of the river, but by Pells’ Railroad Camp.
Redrawing the map also erased and rewrote history. Many books, blogs, historical societies, websites, and Wikipedia posts have been dedicated to the stories of settlers who named places for themselves. All these sources, directly or indirectly, legitimize colonizers’ land ownership claims and orient us to place from a settler colonial perspective. Trying to dig beneath the layers of William Pellses, Rhoda Blisses and Arenacs to learn the original place names and the stories of the people who called them home is not an easy task.
A New Gazetteer for Downtown Detroit
To visit downtown Detroit to be immersed in a space created to laud a specific version of the city’s past and perpetuate a vision of the future where that vision is seen to be the natural, and only possible, order of things. This space is created using monuments, statues, parks, fountains and, most ubiquitously, street names. In his work on the naming of Martin Luther King Jr. Streets in the Southern US, Derek Alderman notes that, “Naming is a powerful vehicle for promoting identification with the past and locating oneself within the wider networks of memory” and, “[street names] make the past intimately familiar to people in ways that other memorials cannot.”
What does it feel like to move through a land where your place names, language and history have been erased or ignored? For People of European Descent with our language and history so prolifically and seemingly indelibly inscribed on the land, it is almost impossible to imagine.
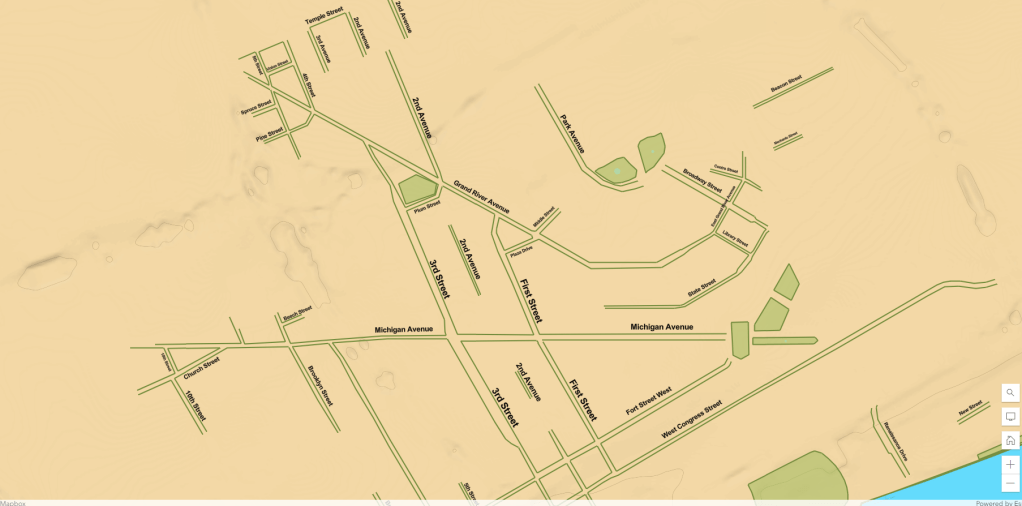
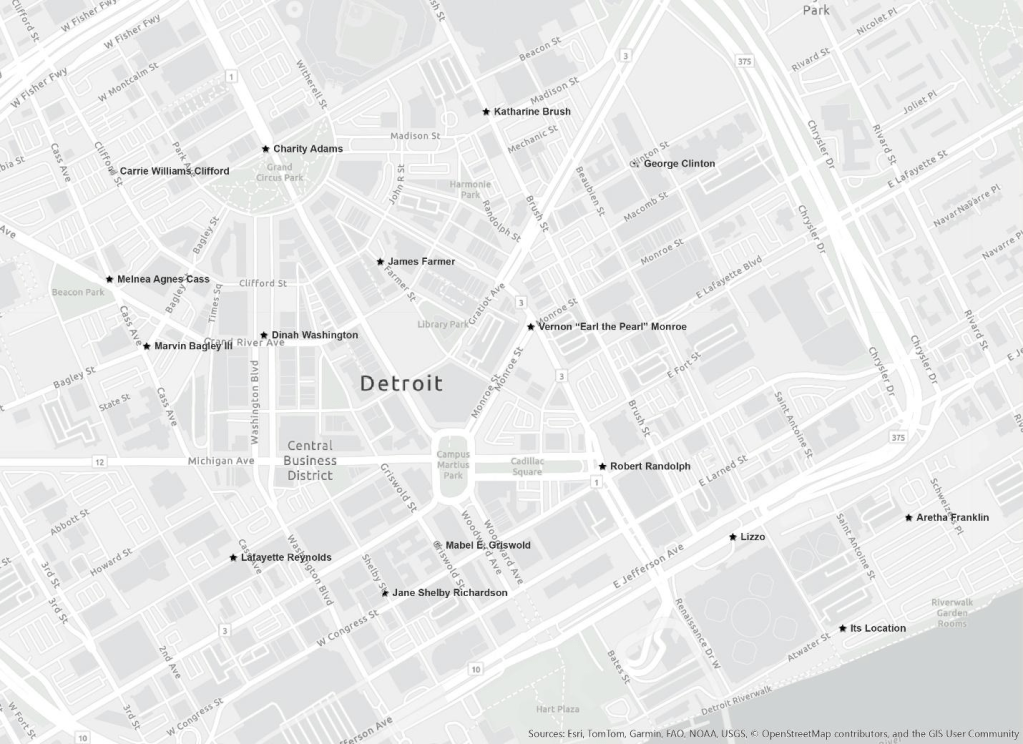
This map shows what downtown Detroit would look like if you erased the streets and street names that honor the colonizers. While in no way parallel to hundreds of years of human, land, history, and language theft and erasure, may this map give you pause to acknowledge it and to recognize the impact of its inscription on the land.
Map: Downtown Detroit with the street and street names that honor French, British and U.S. American colonizers removed.
Unlike removing monuments or changing the names of private buildings, such as university halls, changing street names is a hard and expensive task and one that, frankly, we do not have the time to organize around given all the other needs of our communities. We also cannot boycott or divest from street names, they are everywhere; on signposts, maps, your ID, your mail, every form you fill out, your online billing statements, your RSVP to the DSA meeting, and many more.
This Gazetteer asks us to change the conversation by subverting the street name narrative to tell another version/s of our shared history…
Map: A New Gazetteer for Downtown Detroit
This project is not intended to be the final word on street names. I am in no way anymore qualified to be naming Detroit’s streets than the city’s so called “founders.” My intention is to inspire Detroiters to use street names to tell different narratives of place that expand our learning of history and thus our vision for the future.
In working on this project, I noticed I was only able to find Black and White honorees for the street names. I want to recognize that this is directly related to the legacies of colonialism and imperialism as discussed above, and to the legacy of slavery, which erased the indigenous names of enslaved people, and replaced them with the names of their White enslavers.
Charity Adams was an educator, soldier, and community leader. Adams studied at Wilberforce and Ohio Universities to become a teacher. On the outbreak of WWII, she joined the Women’s Army Corps (WAC) and later commanded the first Black WAC unit to go overseas. After the war, Adams returned to Ohio to complete her studies and worked at the Veteran’s Administration.
Katharine Brush was a journalist and author. Almost forgotten today, Brush was a critically acclaimed and popular writer during her lifetime. She was best known for her short stories and syndicated newspaper columns, which covered among other things, Ohio college football…and therefore probably Michigan football as well.
Marvin Bagley III is a basketball player with the Detroit Pistons. While perhaps not the greatest player ever to grace a basketball court, naming a street for Bagley represents the importance of recognizing everyone’s contribution to the team. And his career is still young, there is time…
Melnea Cass was a civil-rights activist, suffragette, and labor organizer. Cass worked tirelessly to protest racist hiring practices, register women to vote, and train domestic workers to advocate for social security and other benefits in her hometown of Boston. She also helped found Freedom House to advocate for Black civil-rights and address issues ranging from “urban renewal” to education.
Carrie Williams Clifford was a poet and founder of the Minerva Club, a reading club dedicated to seeking a better world for Black women. She also co-foundered of the Ohio State Federation of Colored Women and actively recruited for the Niagara Movement.
George Clinton “Free your mind….”
James Farmer was a co-founder of CORE (Congress of Racial Equality) and organizer of the Freedom Rides in the summer of 1961. Farmer studied at Wiley College and then Howard University where he was introduced to Gandhi’s teachings. He advocated for and practiced non-violent direct action such as sit-ins and freedom rides.
Carrie Fisher “May the Force be with you….”
Aretha Franklin “R E S P E C T….”
Mabel E. Griswold was an activist and founder of the National Women’s Party in Wisconsin. Following the passage of the 19th Amendment granting women the right to vote in 1920, Griswold and her partner, Elsie May Wood, worked in the Wisconsin Governors’ office.
Melissa Jefferson aka Lizzo is a flutist, rapper, songwriter, and singer. Lizzo was born in Detroit in 1988. Her family moved to Houston, Texas when she was 9. She is the winner of numerous awards including 4 Grammys and a strong supporter of LGBTQ+ rights.
Lafayette Reynolds played by actor Nelsan Ellis (1977 to 2017) on the HBO Series True Blood. Lafayette is a cook and medium who can communicate with ghosts and spirits. Ellis’ portrayal of Lafayette won him a Best Supporting Actor Award from the International Press Academy and millions of fans around the world.
Vernon “Earl the Pearl” Monroe is a NBA Hall of Fame Guard. Monroe scored 17,454 points with the Baltimore Bullets (now Washington Wizards) and New York Knicks during his 22-year career. He won the NBA Championship with the Knicks in 1973.
Robert Randolph is a pedal steel guitarist and gospel band leader. Randolph plays both secular and Sacred Steel, a gospel musical style introduced to into worship in the 1930s. Detroiter, Felton Williams, was one of the most talented sacred steel guitarists. Felton designed and built his own guitars and mentored young musicians in the Detroit area.
Jane Shelby Richardson is a biophysicist. As a child Shelby Richardson was keen astronomer, she calculated the orbit of the Sputnik satellite from personal observation. In 1981, she published her work on The Anatomy and Taxonomy of Protein Structure, which included the Richardson Diagram or ribbon diagram method of drawing the 3D structure of protein. Her diagram remains the standard expression of protein structure throughout the world today.
Dinah Washington was a jazz, blues, R&B, gospel, and pop vocalist. Washington called herself the “Queen of the Blues, she was a prolific and influential singer in a variety of genres and her work continues to inspire musicians and audiences today. Washington was inducted into the Rock and Roll Hall of Fame in 1993.
A version of this article originally appeared in the Detroit Socialist in 2023. Today, as the current Presidential administration embarks on re-naming projects that further a white supremacist version of history, it feels even more important to recognize the impact of street names on our collective understanding of our history and culture.
The inspiration for the Fish & Chicken Joint project came from a friend visiting from Washington State who loves bodega food. We went for the required Coney hot dog at American Coney Island downtown, but it didn’t feel quite “bodega” enough. Driving around the city he pointed out Harlem Fish & Chicken on Grand River. So, we went to a Fish & Chicken Joint. Not Harlem, but East Jefferson Fish & Chicken in the liquor store at the corner of Jefferson and Holcomb. I was hooked, literally and figuratively. What is up with Fish & Chicken restaurants?
As I finish up mapping the buried waterways I have started noting and sketching the Fish & Chicken Joints that I pass on my rides.
I am curious about the relationship between Fish & Chicken Joints and fishing in the Detroit River. Many of them offer fish cleaning services. Do they also serve fish caught in the Detroit River?
I love that they have found a way to accept EBT. The prohibition on using EBT for prepared or restaurant food feels to me like another way to make more work for poor people. Cooking every night is not just additional labor. It is also a lot of additional energy in heat for cooking and cooling for air conditioning added to our already high DTE bills.
I wonder how many of them are small to medium sized local businesses with connections to the neighborhoods they serve rather than national chains making money for distant billionaires. Are they recognized and applauded by the Detroit Economic Growth Corporation or Motor City Match? I doubt it.
And as with everywhere I go in Detroit I am fascinated by the architecture. They may not have all the unique decorative elements of our fancy skyscrapers but there are fun shapes and colors, patterns in the brick work, and murals on the walls.
This map is my first Fish & Chicken Joint visualization. It shares all 14 Fish & Chicken Joints along 7 Mile Road between Telegraph and Moross. I hope you enjoy it. And go and get some Fish & Chicken!
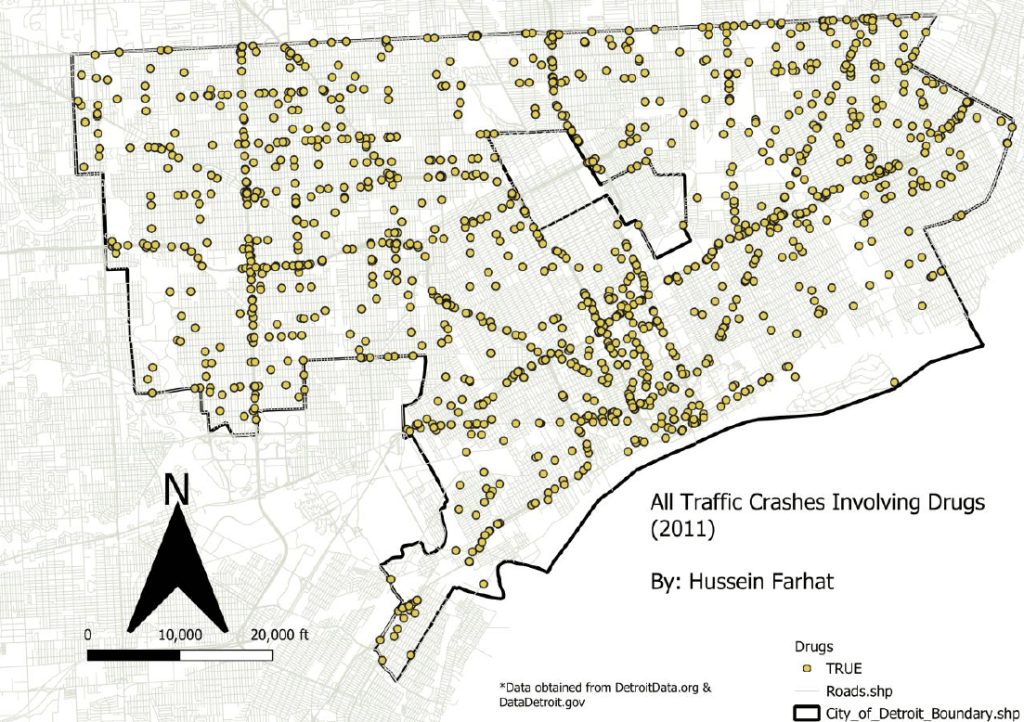
by: Hussein Farhat, Wayne State University, Intro to GIS, Fall 2024
In this map, we see all the traffic crashes that involve drug use. The crashes are relatively scattered across the map, with a bit of a grouped cluster in the more southern part of Detroit also known as Downtown Detroit. The map accounts for all drugs that are involved in crashes and doesn’t exclude any that cause impairment.
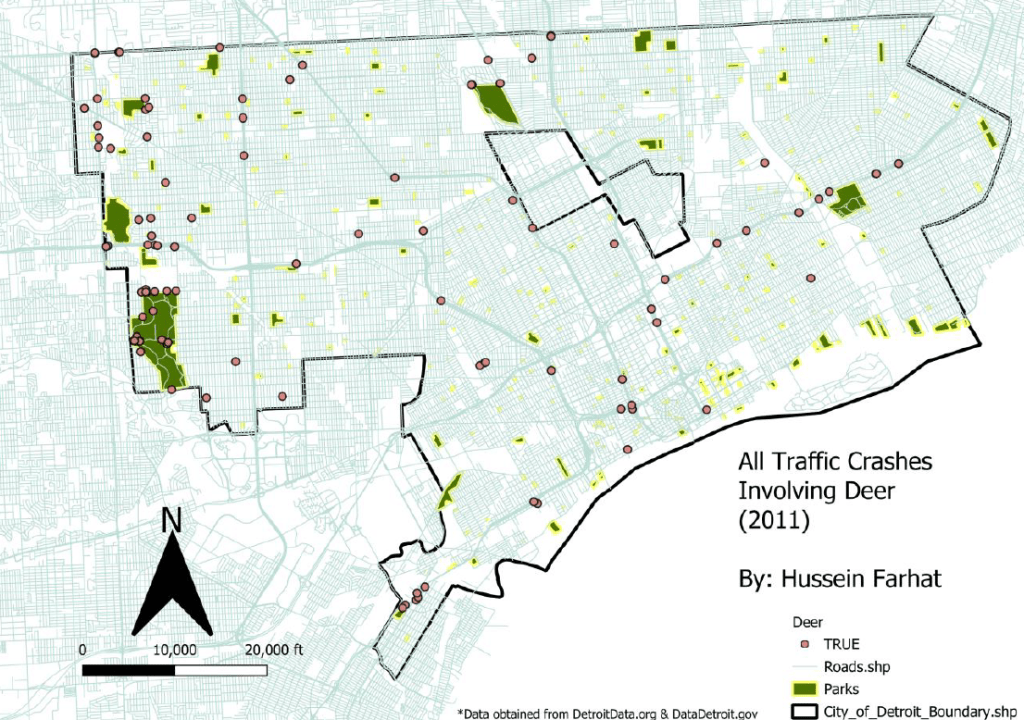
In this map, we see all the traffic crashes that involve deer. The crashes are relatively scattered and minimal across the map. We now see a bit of a grouped cluster in the more western part of Detroit, more specifically, River Rouge Park. This makes a lot of sense; due to the increase of relative wildlife it is natural for more deer to be present. With an increase in deer, the risk of a traffic crash with a deer increases.
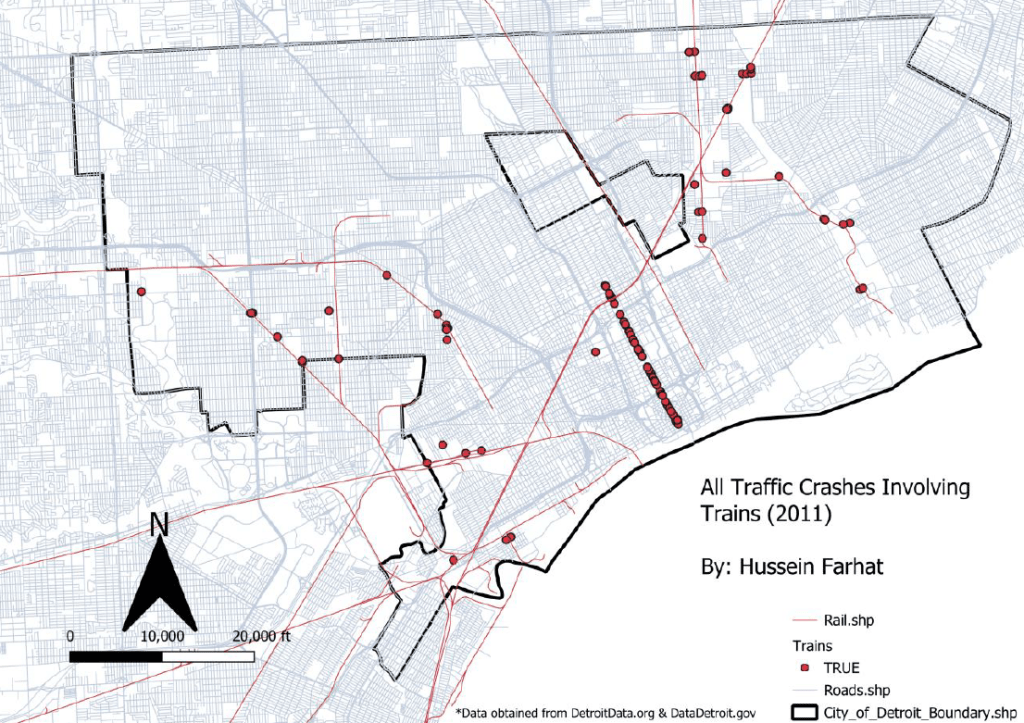
In this map, we see all the traffic crashes that involve trains. The crashes are not scattered, and as expected, tend to be exclusive to areas around railway systems. We see a strong lined cluster that cuts right through the railway system near Midtown. There could be many reasons for the increased susceptibility for collisions with trains in this area. It’s possible that the railway design, paired with the road could be a bit faulty.
This map is one of my first explorations of how I might interpret the data I researched and collected on Detroit’s buried waterways to share visualizations of the city. I am very convinced that the way we talk about a place impacts our relationship with it. I created this map to learn the Ojibwe names of some of the Indigenous plants and animals of Teuchash Grondie (The Place of Many Beavers) / Waawiyaataanong / Karontaen / Motown / Midnight / Motorcity / Detroit.
Following two Michigan Supreme Court rulings, Rafaeli v. Oakland County in 2020 and Schaeffer v. Kent County in 2024, Michigan residents who experienced property tax foreclosure between 2015 and 2020 were granted the right to retroactively claim surplus proceeds from their homes being auctioned for more than the tax debt owed. For example, if a homeowner hadn’t paid their $1,000 annual property tax for two years and lost their home to foreclosure, and the county later auctioned the property for $20,000, the homeowner would now be owed $18,000. This practice of retaining surplus proceeds resulted in Wayne County reportedly collecting $92 million between 2005-2015.
Based on data provided by Alex Alsup (link), it became clear that, among Wayne County’s 41 cities, Detroit residents were disproportionately impacted, effectively sacrificing their homes to keep the county financially afloat. Filtering out commercial properties and speculators, Alsup and Outlier Media identified approximately 2,700 former Detroit homeowners who qualified to claim surplus proceeds, with an average amount of $8,000 each.
Outlier Media became aware of this in late 2024 (link)(link), resulting in a very short window to identify and notify affected residents before the March 31, 2024 claim submission deadline mandated by Michigan statute. Starting in late January 2024, Outlier began hosting phone banking events (link). Initially, we only had the address and the name on the deed at the time of foreclosure, making it difficult for volunteers to locate phone numbers. As a workaround, many phone bankers had to rely on Google searches to identify current contact information.
Outlier partnered with the Detroit Justice Center (DJC) to gain access to public records via LexisNexis. From there, Detroit Documenters and DJC volunteers began looking up both contact information and whether the former homeowners were still living. If deceased, volunteers were asked to identify likely next of kin or potential beneficiaries. Tragically, 40% of the former homeowners were found to be deceased. With limited clarity from the Wayne County Treasurer’s office, Outlier operated under the assumption that it was best to submit claims by the deadline, even if no probate cases or estates had been opened. After searching for contact information, more phone banking events were held where unlike the first sessions, these later events had a noticeably higher contact rate as volunteers were actually reaching people.
I was hired on a three-month contract as project manager in the first week of February after contributing as a Documenter, helping look up contact information, and attending a pilot phone bank in January. Recognizing the scale of the outreach, I bought a cheap flip phone to keep communications organized, as I was responsible for dozens of follow-up calls after each phone bank.
In the two months leading up to the deadline, we made 4,321 calls, resulting in 481 successful contacts. We estimate these efforts could lead to $5,882,473 potentially being returned to impacted former homeowners and their families. Out of those 481 contacts, I personally responded to 200 follow-up calls, which I tracked individually. Fortunately, the Detroit Housing Network’s call center stepped in to assist with additional follow-up efforts.
On March 29, just days before the deadline and after our final phone bank, I attended the workshop “Mapping Your Local Environment” led by CJ Knoble and presented by Detroit Documenters, Planet Detroit, DetroitData, Urban Data Response, and Rooted Futures Lab. We learned how to use Felt for mapping and were encouraged to create one ourselves. The day before, I had organized a one-stop claim submission event at the Joseph Walker Williams Recreation Center where free notary services were provided, and the City of Detroit’s Department of Revitalization collected claim forms to deliver to the Treasurer’s office. As I helped people complete their paperwork, I realized I had previously been in contact with many of them. Inspired, I created a map at the workshop to explore whether the residents I’d reached represented the broader geographic spread of the windfall profits owed, and whether some areas saw more concentrated profits than others.
Data Layers Included:
The boundary of Wayne County
The boundary of Detroit
A heatmap of addresses eligible for surplus proceeds, released by the Wayne County Treasurer’s office
📲 Emojis from my claimant follow-up spreadsheet, each representing a home I personally consulted
Observations:
To visualize areas with higher concentrations of qualifying foreclosures, I converted the list of eligible addresses into a heatmap. The results are likely not surprising to most Detroiters: the issue was widespread across the city except in areas such as Wayne State University/Cass Corridor/Midtown, the riverfront, and neighborhoods near Ferndale and Grosse Pointe. Although there were pockets that were less impacted by property tax foreclosure between 2015-2020, it was painful to see how prevalent they were in Detroit compared to the other cities in Wayne county as depicted in the heat map.
The distribution of the 📲 symbols, representing homes I personally contacted, was wide but I could see that I lacked strong outreach in some heavily impacted neighborhoods. I was especially disappointed that I didn’t assist more residents in Southwest Detroit, where I live, and where the heatmap showed many eligible properties. Given that Southwest is a predominantly Spanish speaking community, they may have routed their follow up calls to our partner there, Bridging Communities or other organizations. Although there are gaps on my personal outreach map, I presume that a map of total calls to 2,163 out of nearly 2,700 impacted former homeowners that were placed during phonebanking events would fill those pockets. If there had been more time it would have been great to map earlier on to track the distribution and build more localized partnerships.
Next Steps:
Michigan statute requires that claimants receive a response from the Wayne County Treasurer’s Office by July 1st 2025. It is the second week of June and I am getting calls from anxious claimants who still have not heard back. I am able to relay that no one has received their letter as of yet, and their calls assure me that I will know when they do arrive. The expected letter from Treasurer Sabree is supposed to confirm the amount that is owed and instruct the claimant on next steps. I expect that a large portion of claimants will be disappointed to find that there is another step, which is to file a motion in court. This might be particularly intimidating for those who claimed interest as heirs or beneficiaries. We do not know how WCTO will be responding to claimants who didn’t have a probate open when they submitted the initial form March 31st. Detroit Justice Center is contracting experienced probate attorney Deborah Choly to assist heirs with filing. I am back at Outlier as of last week for this second phase and will be organizing workshops where claimants can be guided through filing as well as receive specialized support and resources for the process. I will be keeping track of who reaches back out in this phase and hope to map again to compare and contrast my outreach in each phase.
Shiva Shahmir holds a BA in Fine Arts from the University of British Columbia, with a concentration in architectural theory and environmental design, and an MPS in Arts and Cultural Management from Pratt Institute. Since 2017, she has voluntarily managed Spread Art, a nonprofit, community-programmed cultural space, as President of the Board. In 2023, Shiva joined Wayne State University as part-time faculty in the Music Department, where she lectures on studio recording and music technology. In 2024, she became an active Detroit Documenter with Outlier Media, where she is now contracted as a Project Manager. Shiva is also an artist and a proud FCC-licensed amateur radio technician.
When I started the Mapping Detroit’s Buried Waterways project in 2022, I had no idea I would still be trying to complete it 3 years and 283 miles later.
This map is a screenshot of the current state of the project from my GAIA account, which I use to record tracks as I follow the routes of the buried waterways as closely as I can in real time on today’s streetscape. The base map is the current Open Street Map with the U.S. Geological Survey (USGS) 1905 1:62,500 series map and my tracks and waypoints (GPS coordinates of points of interest) layered on top. I started the project by following Baby Creek and its tributaries because it is the closest buried waterway to my house. To begin with I simply recorded the track as I followed the creek on my bike. As I moved west to Campbell Creek, I began marking waypoints of things I noticed that related to, or reminded me of, water. There are now more than 500 waypoints on the map representing everything from puddles, rain gardens and marshes, to boats, paddling pools and desire paths, to fish lawn ornaments, Canada Geese and Weeping Willow trees. Around summer 2023, when I headed over to the Eastside to map the channels of Fox Creek, I started adding photos (represented by the camera icon) to the map.
I love looking at this map. I love that it documents the evolution of the project and the profusion of the mess of waypoints and the memories they bring back of visiting different areas of the city.
Voter Mobilization efforts should focus on a simple equation that indicates the potential available voters in each U.S. census block. The Voter Participation Rate (VPR) as defined as the Voter Totals / Voting Age Citizens located in each block indicates the untapped quantity of voters available in each tract.
Using reliable data sets for each of the key variables, VPR indicates the highest potential for tracts for voter mobilization activists in the city. The analysis below suggests that these groups should prioritize the following 5 Census Tracts:
Census Tract
VPR
Census Tract 5240.01
14.30%
Census Tract 5242
14.40%
Census Tract 5241.01
17.60%
Census Tract 5173
20.30%
Census Tract 5234
20.70%
Data Sets:
The data used in this analysis is pulled from two sources. The first is a very interesting data set available from Michael Bryan and the Harvard Dataverse where they aggregated precinct level voting totals from 2020 and projected them onto U.S. Census geometries. This allows the analysis to by past known issues with exit polling and use actual voting totals in the calculations. Although this data is reported in a partisan fashion in terms of votes for the president, uses the aggregate total votes across a Census Tract for targeting non-partisan voter registration efforts.
The second data set used is data published by the Census on the count of Voting Age Citizens in a given Census Tract as calculated by the 2022 5-Year estimates which is the most recent data available for this type of estimate and geography.
These data sets provide information on the participation of voters in elections, specifically, the last presidential election as well as the overall available number of voters in a given area, in this case, a Census Tract. Census geometries are useful in that they can also provide various demographics and other data that is not available for precinct areas.
Calculating VPR
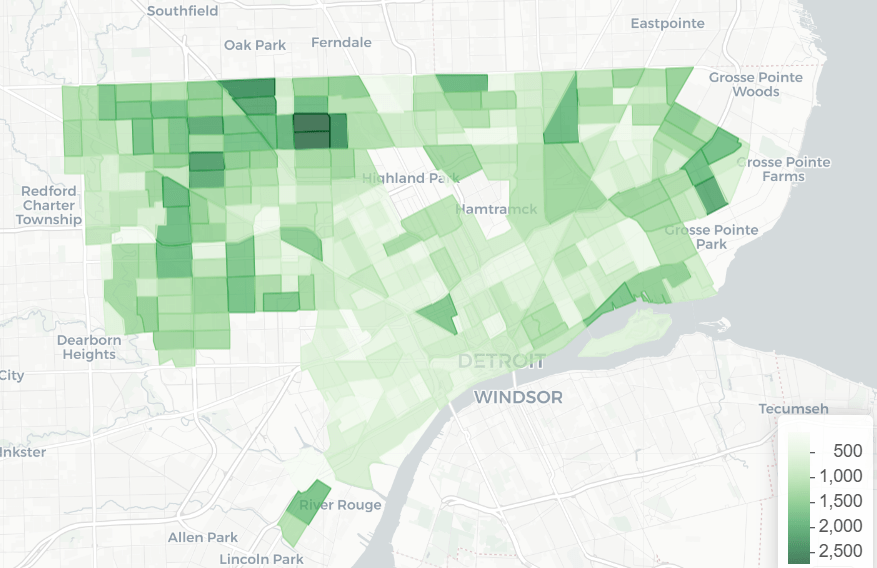
The Vote Totals by Census Tract are shown below:
This data shows that the Bagley neighborhood (Census Tracts 5385 and 5386) seems to have the highest counts, while Southwest Detroit shows less voting overall.
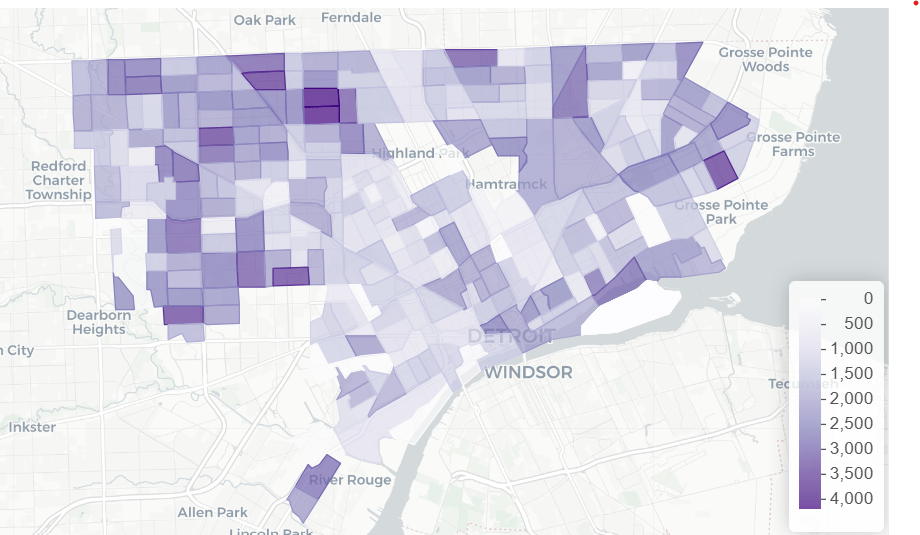
Figure 2 shows the counts of Voting Age Citizens from the 2022 ACS data:
There are several items to note from this plot. The first is that populations of Census Tracts vary widely across the city. Most notably, there are several (Belle Isle, the Stellantis Plan on the east side, Rouge Park on the west side, etc.) where the estimated population is 0. These Tracts must be taken into account differently as they cause issues with the analysis.
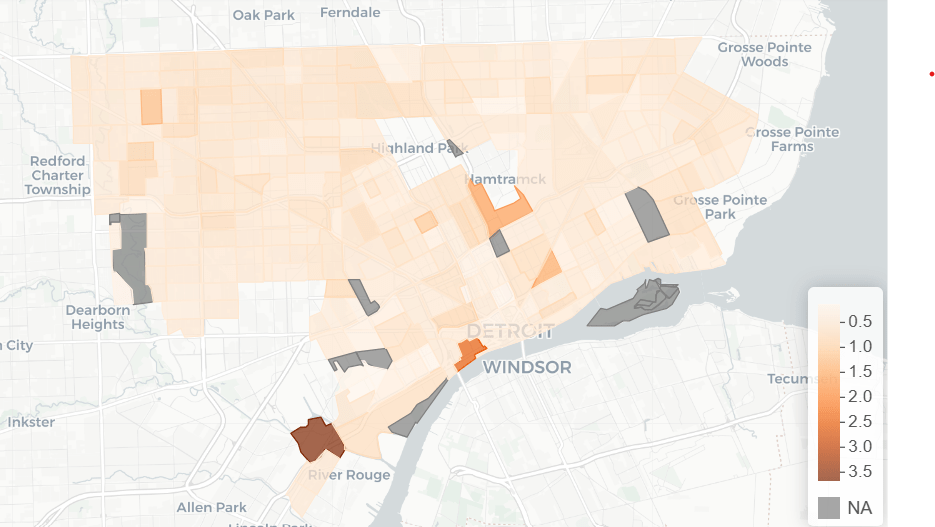
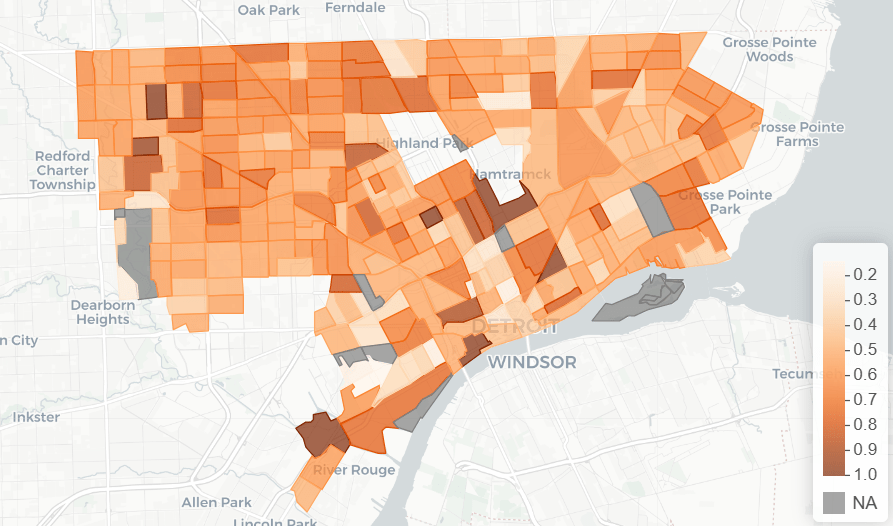
Using these values, the Voter Participation Ratio (Vote Totals per Census Tract/ Estimated population of Voting Age Citizens per Census Tract) can be calculated:
This plot shows greyed out Census Tracts where no Voting Age Citizens are estimated to live, these are marked as “NA”. Additionally, there are several tracts where the projections exceed the estimates from the Census generating a ratio above one. One possibility is that these are tracts where there was significant decrease in population from 2020 to 2022. Another possibility is that the precinct population from which the projections were drawn is geographically heterogeneous and the projections don’t do a great job for these particular areas. This is likely true for highly industrialized Census Tract 5245, which shows a ratio of 3.7. The Census only estimates that 36 Citizens of Voting Age live in this tract.
If the ratios are capped at 1 by using the Voter Totals as the estimates where the ratio exceeds 1, the plot shows a better looking and more useful chart:
Interestingly, although the prevailing belief is that Detroiters don’t vote, most Tracts have relatively high participation with two thirds of Tracts showing over 50% VPR. Overall, Detroit has a VPR of 56%. Using this data, a list of Census Tracts to target for voter registration and outreach can be generated, including some of the lowest participation Tracts like 5240 (14%), 5242 (14%), 5173 (20%), etc. If voter outreach were to bring these 5 lowest Census Tracts up to the average VPR of 56%, it would boost turnout by 3200 votes in the city.
Contact
Submit a map or just get in touch. Thanks for following!