by: Jeffrey Herbstman, PhD, data scientist
Voter Mobilization efforts should focus on a simple equation that indicates the potential available voters in each U.S. census block. The Voter Participation Rate (VPR) as defined as the Voter Totals / Voting Age Citizens located in each block indicates the untapped quantity of voters available in each tract.
Using reliable data sets for each of the key variables, VPR indicates the highest potential for tracts for voter mobilization activists in the city. The analysis below suggests that these groups should prioritize the following 5 Census Tracts:
| Census Tract | VPR |
| Census Tract 5240.01 | 14.30% |
| Census Tract 5242 | 14.40% |
| Census Tract 5241.01 | 17.60% |
| Census Tract 5173 | 20.30% |
| Census Tract 5234 | 20.70% |
Data Sets:
The data used in this analysis is pulled from two sources. The first is a very interesting data set available from Michael Bryan and the Harvard Dataverse where they aggregated precinct level voting totals from 2020 and projected them onto U.S. Census geometries. This allows the analysis to by past known issues with exit polling and use actual voting totals in the calculations. Although this data is reported in a partisan fashion in terms of votes for the president, uses the aggregate total votes across a Census Tract for targeting non-partisan voter registration efforts.
The second data set used is data published by the Census on the count of Voting Age Citizens in a given Census Tract as calculated by the 2022 5-Year estimates which is the most recent data available for this type of estimate and geography.
These data sets provide information on the participation of voters in elections, specifically, the last presidential election as well as the overall available number of voters in a given area, in this case, a Census Tract. Census geometries are useful in that they can also provide various demographics and other data that is not available for precinct areas.
Calculating VPR
The Vote Totals by Census Tract are shown below:
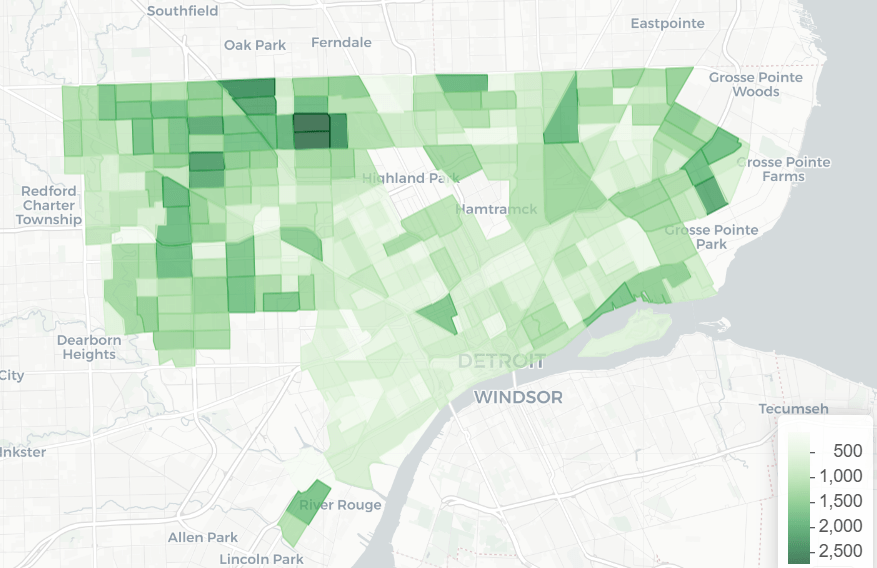
This data shows that the Bagley neighborhood (Census Tracts 5385 and 5386) seems to have the highest counts, while Southwest Detroit shows less voting overall.
Figure 2 shows the counts of Voting Age Citizens from the 2022 ACS data:
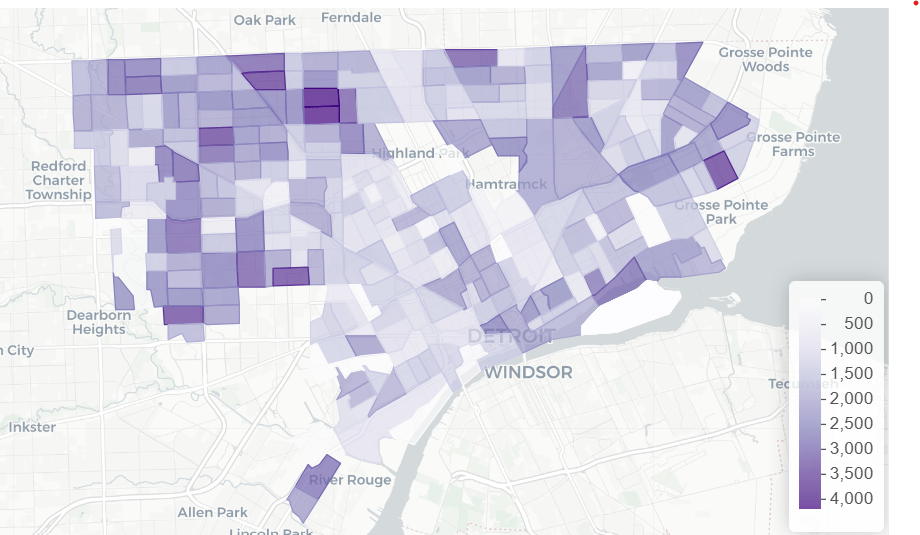
There are several items to note from this plot. The first is that populations of Census Tracts vary widely across the city. Most notably, there are several (Belle Isle, the Stellantis Plan on the east side, Rouge Park on the west side, etc.) where the estimated population is 0. These Tracts must be taken into account differently as they cause issues with the analysis.
Using these values, the Voter Participation Ratio (Vote Totals per Census Tract/ Estimated population of Voting Age Citizens per Census Tract) can be calculated:
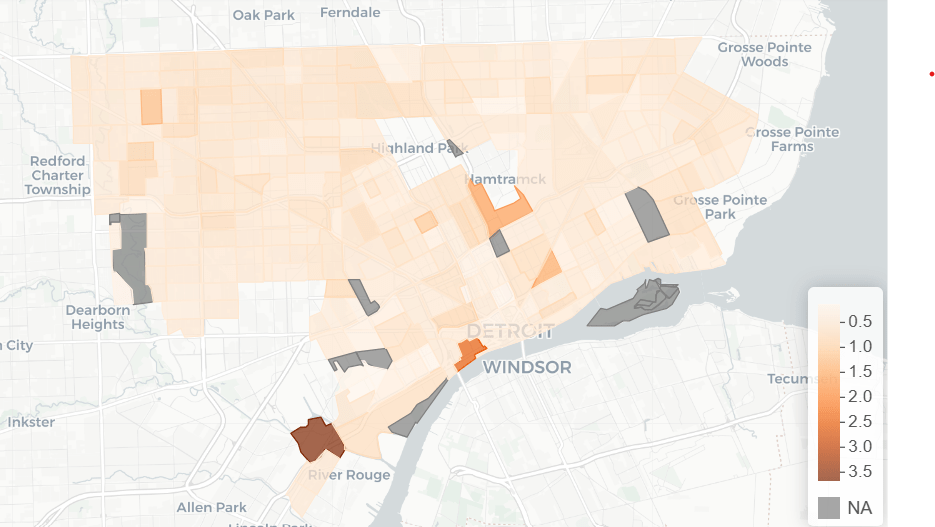
This plot shows greyed out Census Tracts where no Voting Age Citizens are estimated to live, these are marked as “NA”. Additionally, there are several tracts where the projections exceed the estimates from the Census generating a ratio above one. One possibility is that these are tracts where there was significant decrease in population from 2020 to 2022. Another possibility is that the precinct population from which the projections were drawn is geographically heterogeneous and the projections don’t do a great job for these particular areas. This is likely true for highly industrialized Census Tract 5245, which shows a ratio of 3.7. The Census only estimates that 36 Citizens of Voting Age live in this tract.
If the ratios are capped at 1 by using the Voter Totals as the estimates where the ratio exceeds 1, the plot shows a better looking and more useful chart:
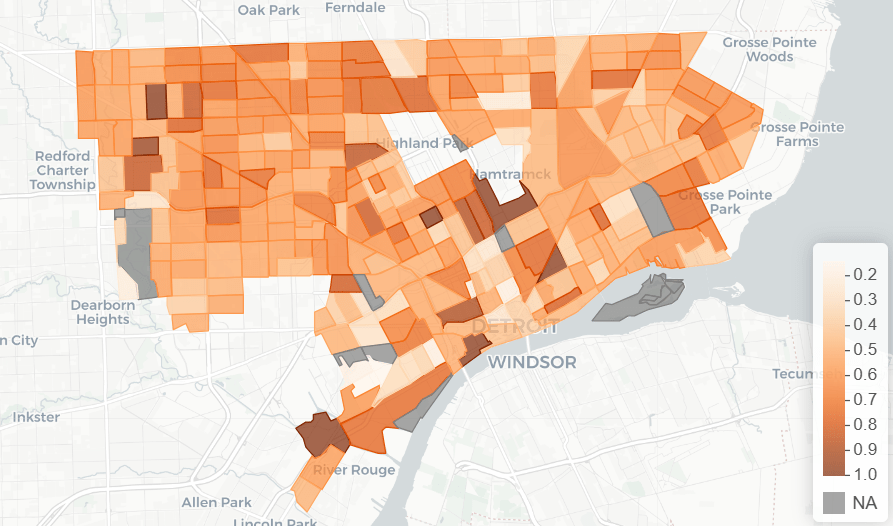
Interestingly, although the prevailing belief is that Detroiters don’t vote, most Tracts have relatively high participation with two thirds of Tracts showing over 50% VPR. Overall, Detroit has a VPR of 56%. Using this data, a list of Census Tracts to target for voter registration and outreach can be generated, including some of the lowest participation Tracts like 5240 (14%), 5242 (14%), 5173 (20%), etc. If voter outreach were to bring these 5 lowest Census Tracts up to the average VPR of 56%, it would boost turnout by 3200 votes in the city.
