by: Hussein Farhat, Wayne State University, Intro to GIS, Fall 2024
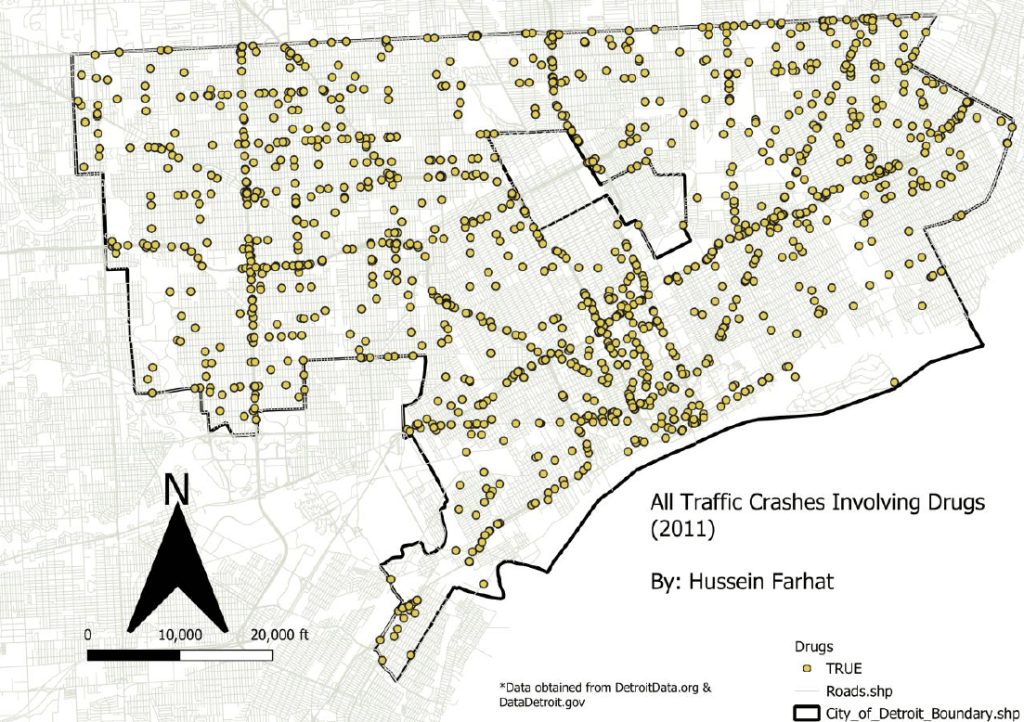
In this map, we see all the traffic crashes that involve drug use. The crashes are relatively scattered across the map, with a bit of a grouped cluster in the more southern part of Detroit also known as Downtown Detroit. The map accounts for all drugs that are involved in crashes and doesn’t exclude any that cause impairment.
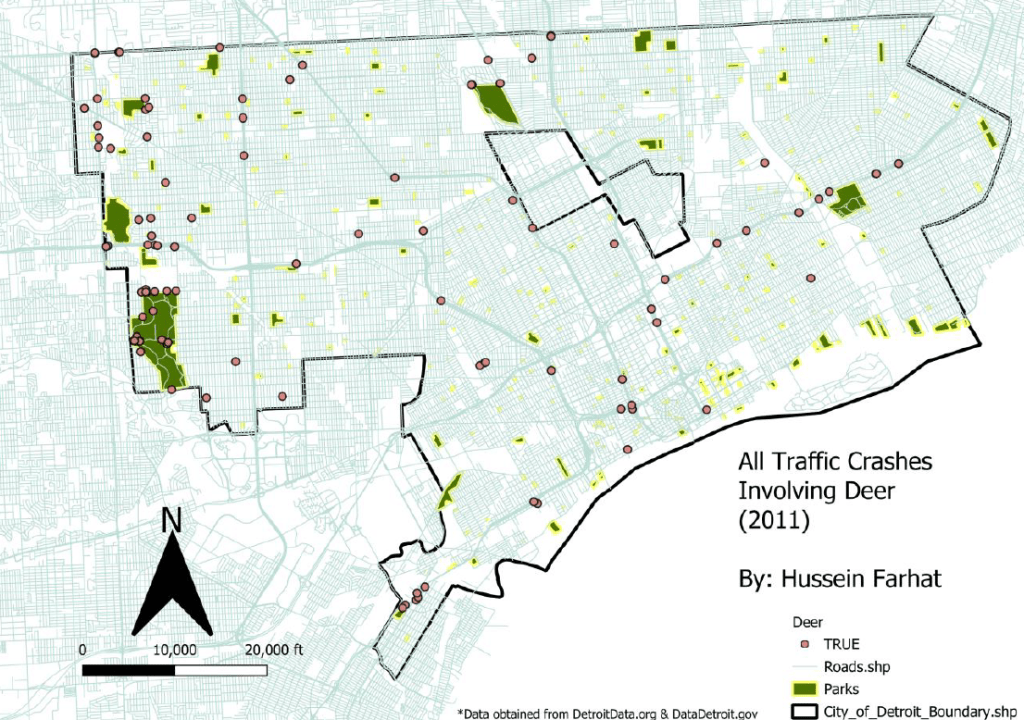
In this map, we see all the traffic crashes that involve deer. The crashes are relatively scattered and minimal across the map. We now see a bit of a grouped cluster in the more western part of Detroit, more specifically, River Rouge Park. This makes a lot of sense; due to the increase of relative wildlife it is natural for more deer to be present. With an increase in deer, the risk of a traffic crash with a deer increases.
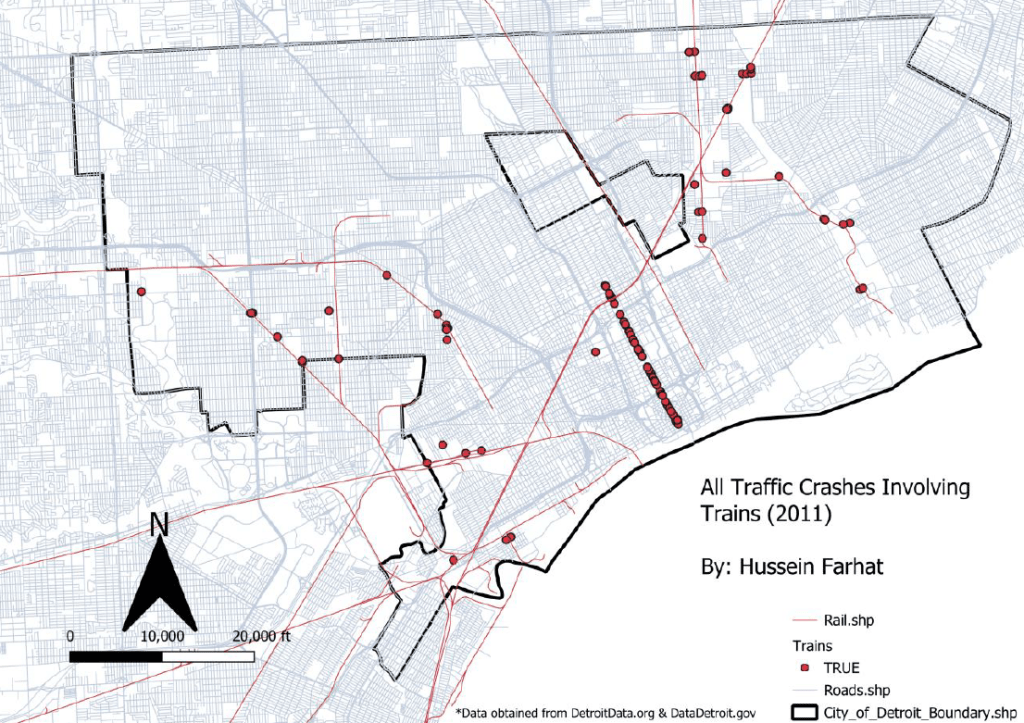
In this map, we see all the traffic crashes that involve trains. The crashes are not scattered, and as expected, tend to be exclusive to areas around railway systems. We see a strong lined cluster that cuts right through the railway system near Midtown. There could be many reasons for the increased susceptibility for collisions with trains in this area. It’s possible that the railway design, paired with the road could be a bit faulty.

Those are likely not “all the traffic crashes that involve trains”. UD-10 crash reports are only required for crashes involving vehicles. Trains, pedestrians, and bicycles are not vehicles. So if the QLine hits a bicycle, there’s no UD-10.