by: Hannah VanWingen Eckertova
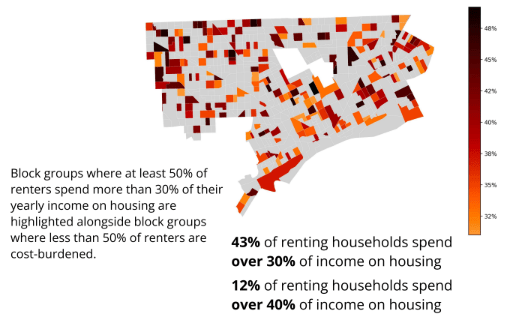
This case study visualizes yearly housing cost burden across Detroit’s census block groups using 2024 American Community Survey data. A density chart plots block groups reporting both renter and owner median housing costs as a percent of yearly income. The near-zero regression slope between renter and owner cost burden suggests these pressures are structurally distinct, indicating a rental market that extracts disproportionately from tenants independent of neighborhood-level ownership costs. Block groups where at least 50% of renters are cost-burdened, spending more than 30% of their yearly income on housing, are highlighted alongside block groups where less than 50% of renters are cost-burdened. 43% of renting households spend over 30% of income on housing, and 12% of renting households spend over 40% of income on housing.
Localized housing cost is a variable in Detroit’s urban system that links individual financial uncertainty to neighborhood-level disinvestment, displacement, and resilience. Housing cost burden does not exist in isolation — it is a pressure point within a larger network of urban dependencies, where the share of income absorbed by rent shapes what households can spend, save, invest, and contribute to the communities around them.
This map was part of the Visualizing Detroit: The Art of Data competition and exhibit in March 2026.
Hannah VanWingen Eckertova is a researcher working at the intersection of data-driven decision-making and social equity. My broader practice is oriented toward the premise that rigorous, accessible data visualization is an art form of advocacy. When patterns become legible — spatially, statistically, comparatively — they become harder to ignore. I make visual art because I believe a more equitable world is built through better decisions, and that better decisions begin with better understanding through creative means.
