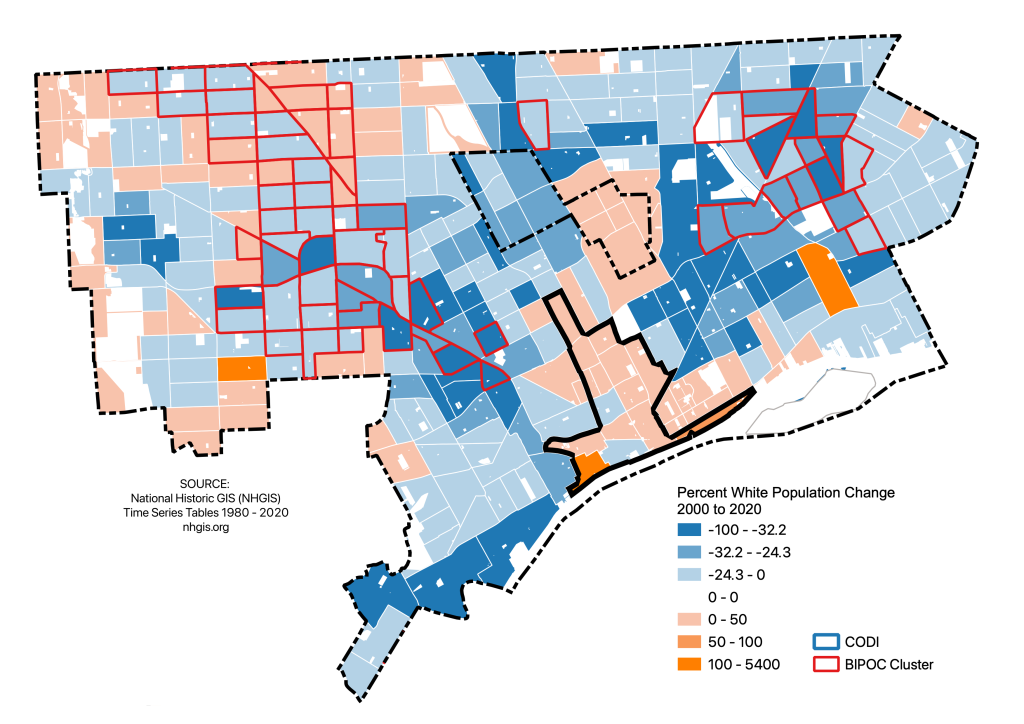
Population in Detroit is often talked about as losses, which has been a long-term trend that has not reversed under the current mayor. As a majority Black city, the losses are among Detroit’s Black middle class and families who seek better schools and safer neighborhoods. White population isn’t discussed as much, but presents some significant influences on population dynamic.
The white population increased by 115% within the city’s 7.2 sq mi Greater Downtown area, even though it decreased by 12% citywide since 2000.
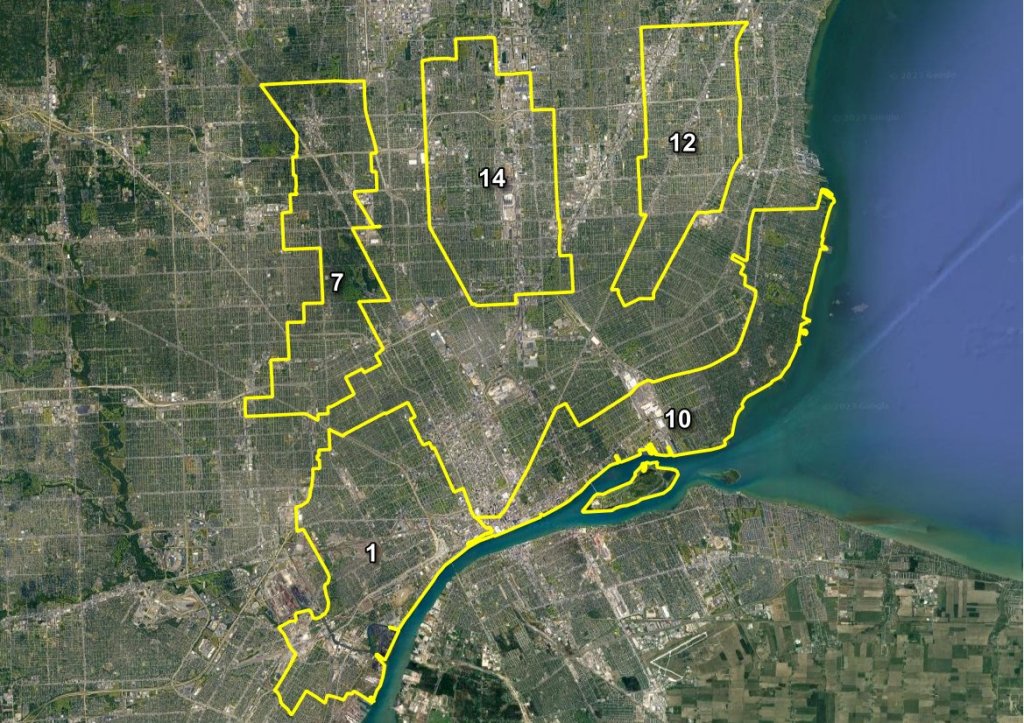
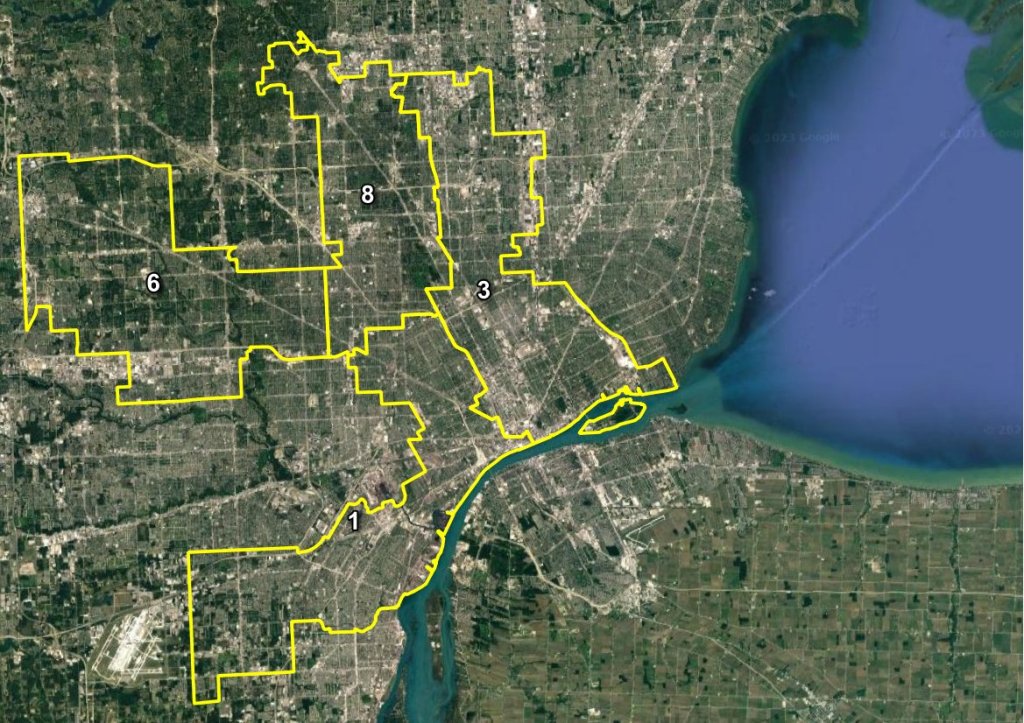
The City of Detroit has made a handy interactive tool to compare proposed options for City Council redistricting. I’m still confused why “Election Precincts 2023” are listed when the only known update was made in 2022 before the midterm election without any record of approval by the Detroit Election Commission (DEC). The last time I know the DEC met was in August 2022 and it lasted all of 20 minutes. The Detroit Documenters covered the October 23, 2023 meeting and it seems that election security was the primary topic, but the meeting was a similar mess to what I saw in August 2022.
When were 2022 election precinct changes reviewed and approved? When were 2023 precinct updates made? Both the city council redistricting and the redistricting of statewide offices show how important and unaccounted these small precinct changes are for the people’s political representation.
I’m sharing this map from my book, Detroit in 50 Maps, because I’ve seen a lot of the old maps shared recently from 2010 and 2000. I also keep getting requests to update those maps. On this map in particular one dot equals 25 people and data come from the 2020 Decennial Census.
Not too much has changed from the earlier maps except for the significant population losses. The border of Detroit can still be easily picked out without needing the boundary line drawn. Some notable difference from the 2020 Census data is the increased Downriver migration of Latino populations as noted in my mapping of taco places with Tostada Magazine as well as the continued growth of the Bangladeshi community in Hamtramck and bordering areas within Detroit.
An important limitation of the Census data is that race and ethnicity are not well defined for all groups. For Southeast Michigan, that means that the Middle East/ North African populations are grouped into the “white” racial category. The other limitation is that much of Detroit is categorized as “hard to count” meaning the Census is the best data, but we might not have the best representation of everyone in Detroit.
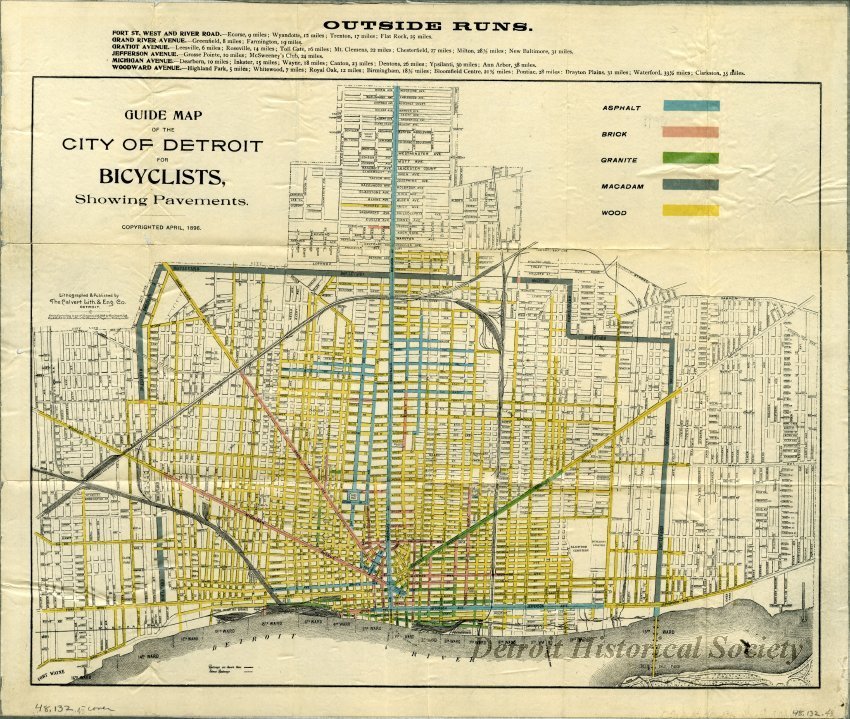
In honor of the 155th anniversary of the first bicycle ride on Detroit’s streets in 1868 I’m going to finally post this historic gem of a map that somehow I have never posted in the 10 years of cataloging Detroit maps. The map’s title points out the critical map detail: the color-coded pavement types, ranging from unpaved to wood to brick to asphalt.
Even though the League of American Wheelmen had formed over a decade earlier, this map was published in the peak of the Good Roads movement, when cities across America were responding to demands for better rights-of-way for bicyclists by paving their roadways. While most of Detroit’s streets were paved with wood, its large radial avenues and other high-traffic roads had been upgraded to granite or asphalt by 1896. Along with the numerous freight railway lines (the Dequindre Cut shows up as a railroad line that it was at the time), other streetcar lines are noted for bicyclists’ convenience.
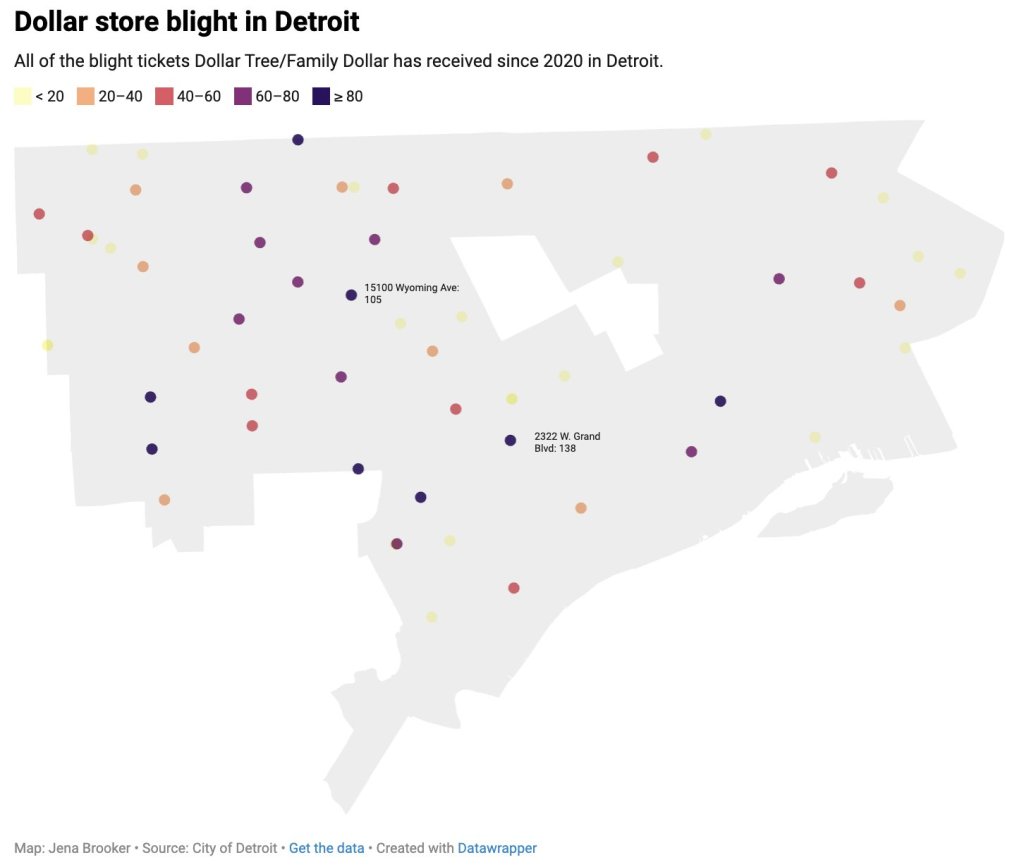
Bridge Detroit reporter, Jena Brooker, did some incredible open data digging to find that Dollar Tree, owned by Family Dollar, was cited with 2,400 blight tickets since 2020. Dollar store moratoriums have been put in place in more than 50 cities. Nationwide, dollar stores are known to have higher rates of crime, lower quality products, and have a negative effect on suppressing new grocery stores.
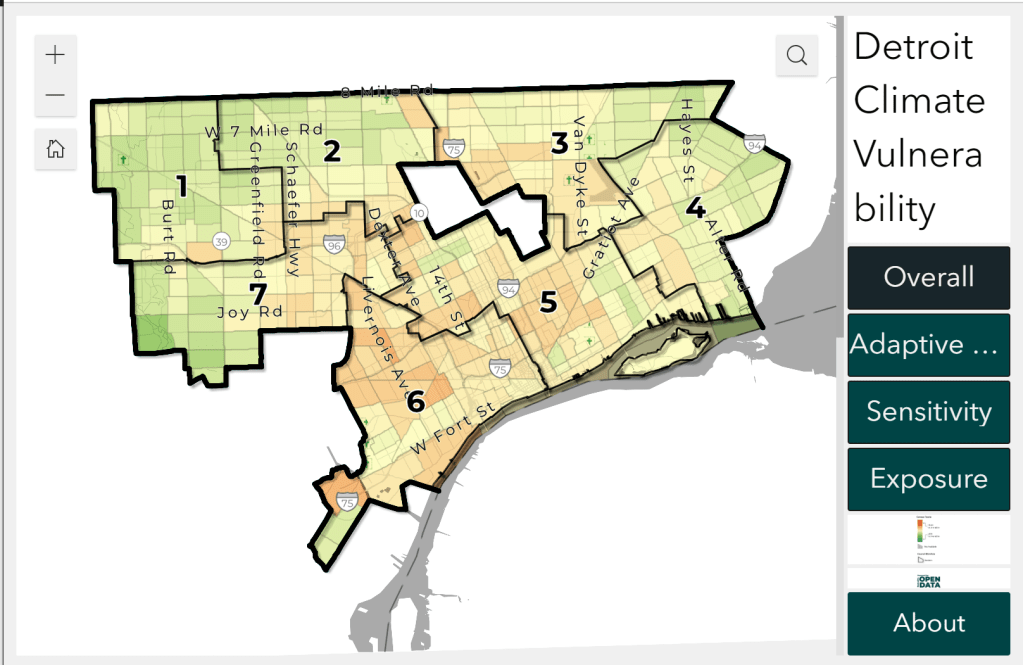
This map is part of the City of Detroit Climate Strategy informed by the Climate Equity Advisory Council. The goal of this map is to visualize climate vulnerability factors at the census tract scale. From the site:
Mapping climate vulnerability is important because the impacts of heat, flooding, and air quality are not felt equally across the city. Some areas and populations are more likely to be harmed by climate hazards than others, and visualizing what areas are most impacted can help in decision-making.
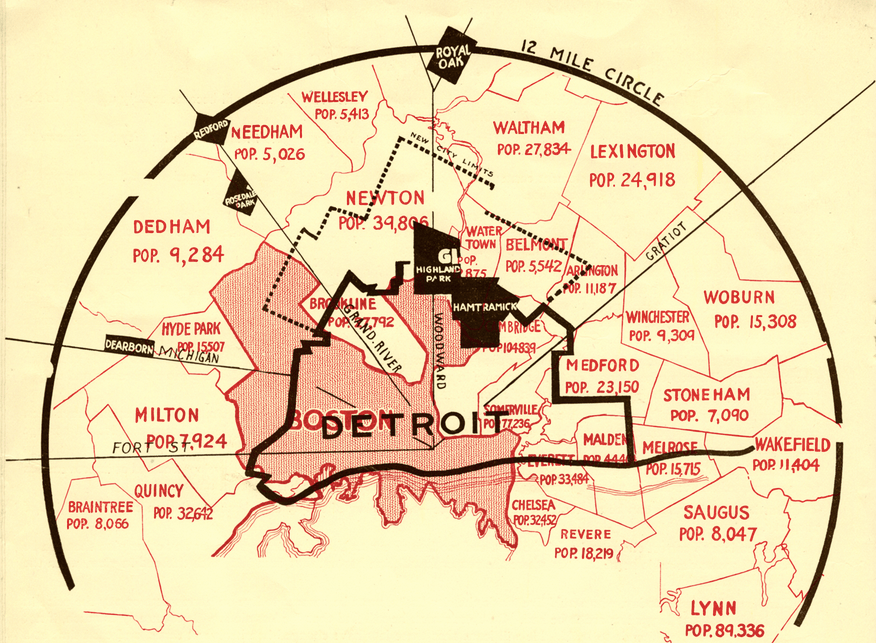
In a 1919 brochure for the Rosedale Park development highlighted the clean air “out of the smoke zone” and the great opportunity of a growing region. At this point, Detroit was still relatively small by today’s city boundary definition, but the comparison to the Boston regional development and cooperation – specifically on public rapid transit – was another selling point for Rosedale Park (future rapid transit that was never constructed).
“The maps reveal a striking contrast and furnish an example of what must take place around Detroit with the coming of better transportation and a comprehensive plan of city development. Other cities would show a proportionate contract with Detroit, but Boston was selected because of having many of the same features in common with this city.”
And:
“The people of Boston solved their problem because it had to be solved. It will be done in Detroit for the same reason.”
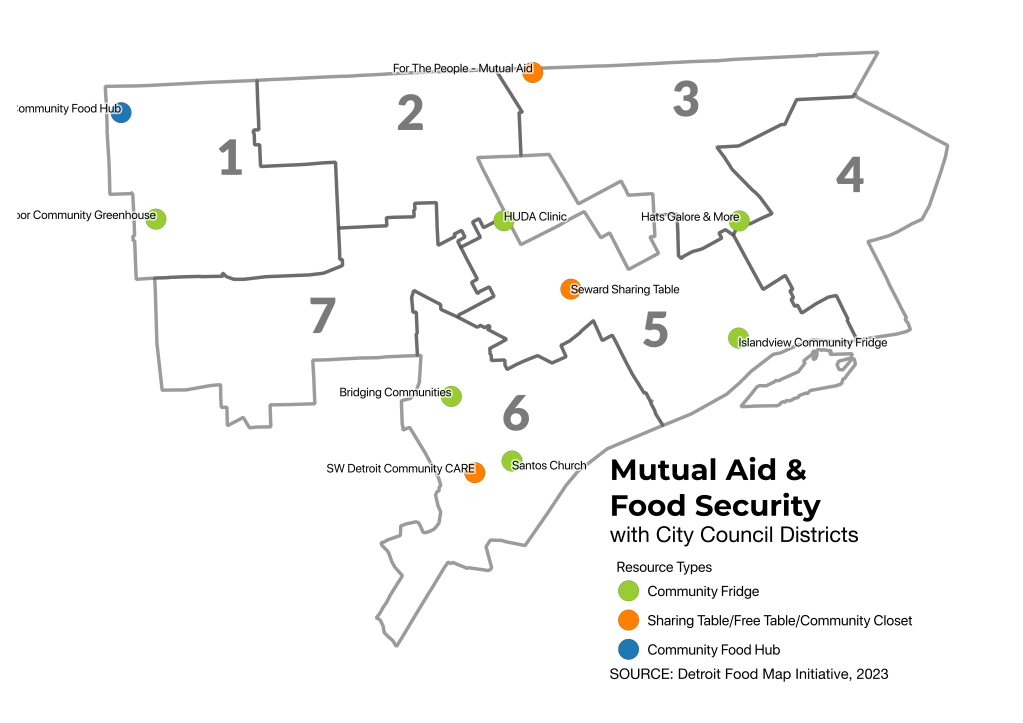
I worked with the Detroit Food Policy Council (DFPC) to produce their latest Detroit Food Metrics report. This map in particular is helpful to understand resilience in Detroit communities and adaptation in the food system.
“Detroit’s hunger crisis is far from over. Pandemic benefits reduced the burden significantly, but now many families and elderly residents are falling back into regular food insecurity as benefits end. In some communities mutual aid has filled the gaps.”
for NHL sports bars near Little Caesar’s Pizzarena with 35 bars within 1 mile (Detroit Free Press)
71%
of unhoused households experienced “first time homelessness” according to new report led by Homeless Action Network Detroit (HAND) (Bridge Detroit)
13%
of all Arabic speakers live in Metro Detroit (Axios)
3.5
miles of riverwalk expansion that opened this month on the, hopefully soon to be renamed, “Uniroyal Promenade” (a corporate polluter who couldn’t clean up their mess shouldn’t get a riverfront promenade named after them)
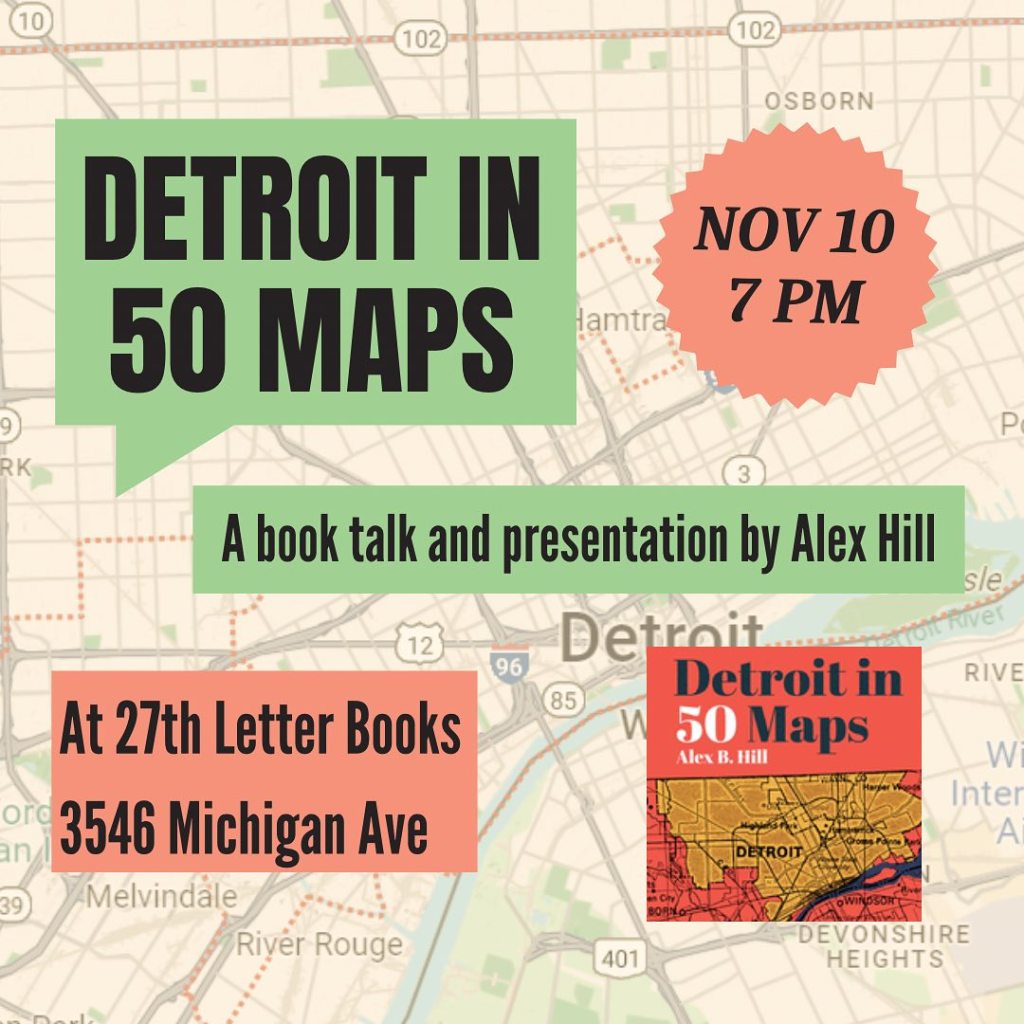
Alex Hill has 20 years of experience working with nonprofit organizations on campaigns that impact policies and communities. He launched the Detroit Food Map initiative in 2011 and founded DETROITography in 2013. His first book, Detroit in 50 Maps, was published in 2021. As a data nerd and anthropologist, he loves sifting through spreadsheets and sitting down with people to tell meaningful stories. By combining human experiences with data and analytics, he’s able to evaluate and elevate the strategic impact for all types of organizations through mapping, infographics, and campaigns. His personal research is focused on food access, racial justice, data literacy, and health equity.
The obvious answer is yes, Detroit neighborhoods have been mapped many, many times by many different people, groups, and entities. Some Detroit neighborhoods are best understood as historic districts, others are born of strong neighborhood associations (for better, for worse), some are simply terms given to a geographic area, and others are strictly defined by non-profits and investing organizations.
“I vote that the people who live there get to decide and history must be referenced.”
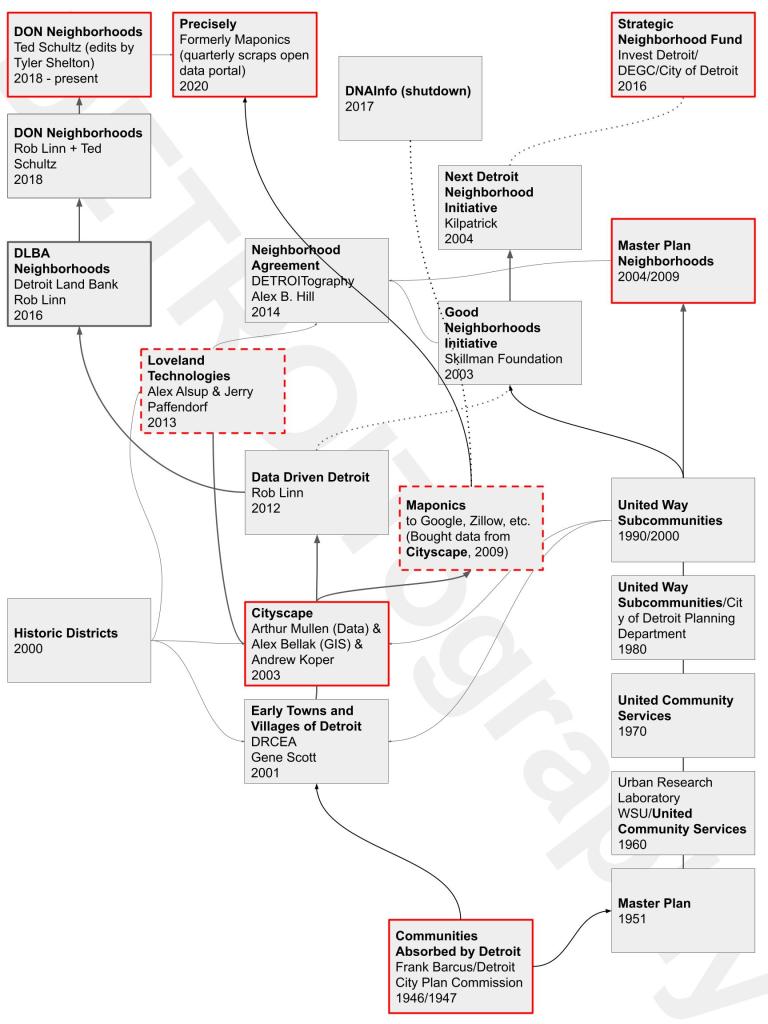
Historic neighborhood areas have had staying power. Most notably Corktown, although it has gone through significant changes over the years, remains the oldest neighborhood, oldest neighborhood name in continuous use in Detroit. One of the most influential programs that defined much of the city’s neighborhood was the United Community Services, what became the United Way, “subcommunities” that were drawn after each Census as a way to subdivide and track change over time in the city. Through the 1960s and 1970s those defined areas were referred to as Detroit’s neighborhoods, but with population loss many of those neighborhood names were forgotten or at least much less recognizable. The former subcommunitites were adopted as Detroit’s official master plan neighborhoods.
There is a genealogy to Detroit’s neighborhood maps and naming choices. Often times, the line drawing and naming have not involved Detroiters let alone the very people who reside in a geographic area because naming and claiming space can be very political or have broader economic or real estate aims that are not concerned with resident perspectives. That is the very reason that we launched Detroit-Neighborhoods.com
Countless “paper neighborhoods” have proliferated in Detroit. I questioned all of the “neighborhood” map products available in 2013 and others had similar concerns about places called “The Eye” or “Fishkorn” and the, at the time, “Corktown Shores.” Presently, the neighborhood name that is most confusing is “Buffalo” near the recently named Banglatown neighborhood at the Hamtramck border, that was quietly renamed “Buffalo-Charles” for the street intersection. Yet, no residents of the area have ever use or have heard of the name. Even the Planning Department’s outreach for the Strategic Neighborhood Fund (SNF) Banglatown framework never listed either Buffalo or Buffalo-Charles. Since the City’s Department of Neighborhoods (DON) has defined the name, it has entered the media discourse – including a handful of recent mentions in 2023.
Neighborhood naming by City government has larger implications too. All of the incorrect names or made up boundaries that the City DON has adopted get added to the open data portal, which is then downloaded – not by Google – but by a group called Precisely, formerly Maponics, that has made its business to map every neighborhood in the world. Precisely and Maponics were the preferred data providers for real estate companies like Realtor.com, Zillow, etc. that wanted to optimize searching for a new home, but were quickly contracted by any new digital company offering a map and search function. The neighborhood names many people were mad about on Google Maps came from Precisely/Maponics not Google itself.
Detroit neighborhoods can be mapped, but I’d like to see every resident have the opportunity to provide input.
Here are the Michigan legislative districts mapped by Will Ferguson that the U.S. District Court ruled will be allowed to go to trial on grounds that their drawing violates the Voting Rights Act. If the lawsuit succeeds it is likely that much of Southeast Michigan will again be redrawn to be more compliant.
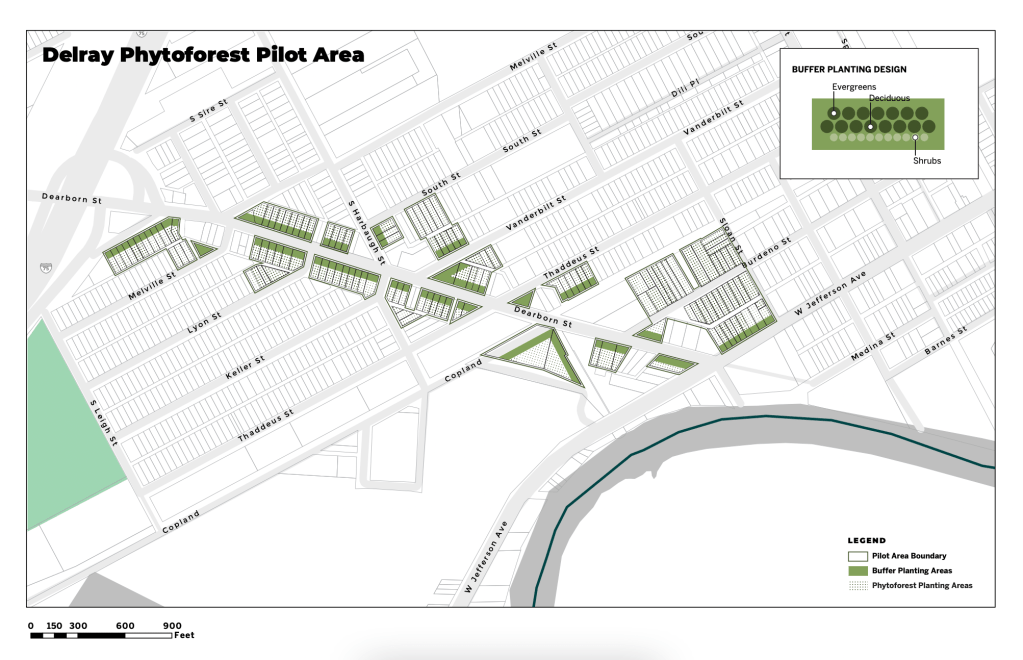
Malachi Barrett of Bridge Detroit reports that the “Delray Phytoforest Pilot” project is underway. The concept came out of the city’s 2021 neighborhood framework plan. City Council approved the transfer of 64 Detroit Land Bank (DLBA) properties for the project where 4,000 trees and shrubs will be planted to act as a vegetative buffer in the very polluted area. Based on our 2021 analysis of potential sites for tree buffers, Delray had very few DLBA properties available to effectively mitigate pollution from expressway or industrial sites. The greatest benefit may be leveraging existing city owned properties with increased tree plantings.
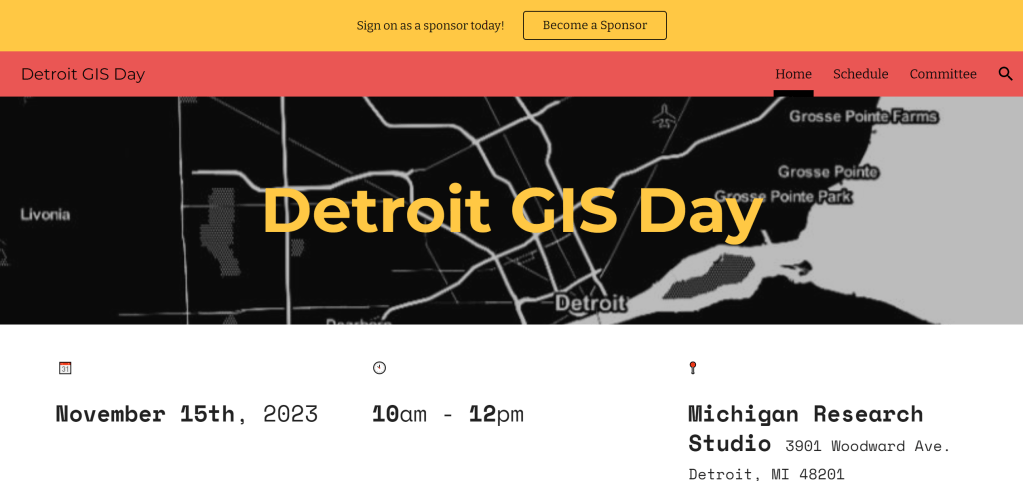
We’re a hosting partner for the City of Detroit GO DATA Commission’s new annual data art competition and exhibit. The inaugural theme is “Detroit data storytelling.”
What: Detroit data art exhibit
When: Submissions due by November 8, exhibit will happen during Detroit GIS Day November 15th.
The City of Detroit’s Office of Digital Equity and Inclusion has a series of data points and maps that set the baseline for their work on increasing access to high speed internet across the city. They’ve calculated Council District and Current “Neighborhood” rates using an interesting methodology based on occupied housing units per census tract.
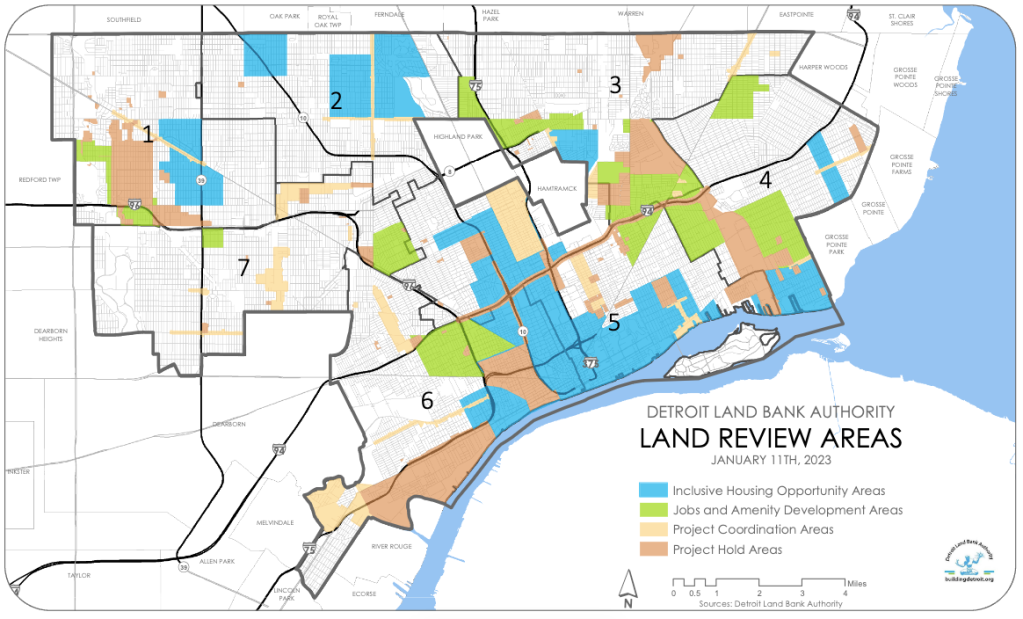
Many Detroiters have stories of trying to work with the Detroit Land Bank Authority (DLBA) to acquire land, move an agricultural project forward, or just secure the side lots near their home. Typically I have heard these stories involve a denial with not clear reason given. I stumbled across this map that seems to be semi-regularly updated with “project areas” that may be the cause of many negative interactions with the DLBA.
The DLBA website outlines the definitions for these areas and link to the longer policy document:
Inclusive Housing Opportunity Areas: where home sales have averaged $100/square foot, or more, over the last year. These are areas where housing inclusivity is, or is likely to become, a pronounced challenge.
Jobs and Amenity Development Areas: where publicly owned vacant lots account for a third or more of all parcels. These may create opportunity for the development of large-scale public or private Revitalization projects.
Project Coordination Areas: where City planning, housing, infrastructure, economic development, or recreation agencies have formally requested that the DLBA coordinate sales in connection with planned or ongoing Revitalization projects that use DLBA properties.
Project Hold Areas: where City Revitalization Offices have agreements in place barring or restricting the sale of DLBA property in that geographic area.
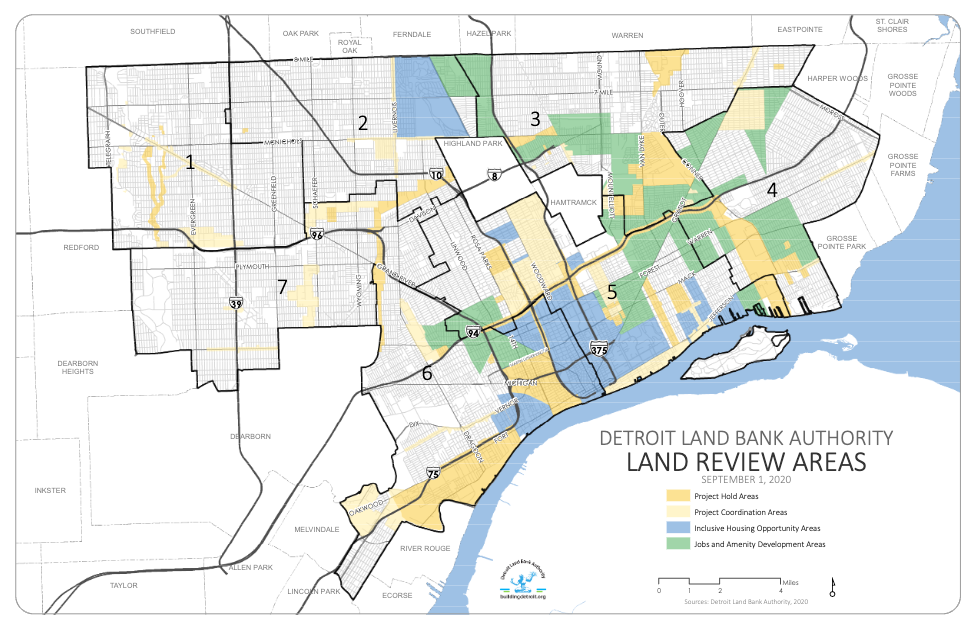
Same map below for 2020. In 2023, there have been expansions mostly on the Westside for inclusive housing, job and amenity development, and project holds.
I’ve added the term “access” to the City of Detroit’s listing of “tech hubs” since that seems to be a term with a wide and varied definition. In this case the City is talking about:
[…] free wifi, devices, and basic digital literacy training
The sites range from support from major telecom companies like Comcast and ATT to the Connect313 efforts. Previous researchers have also included a broader number of access points with free wifi like McDonalds and municipal buildings. The City of Detroit Office of Digital Inclusion notes that 42.6% of households lack high speed internet access up from 40% in 2013.
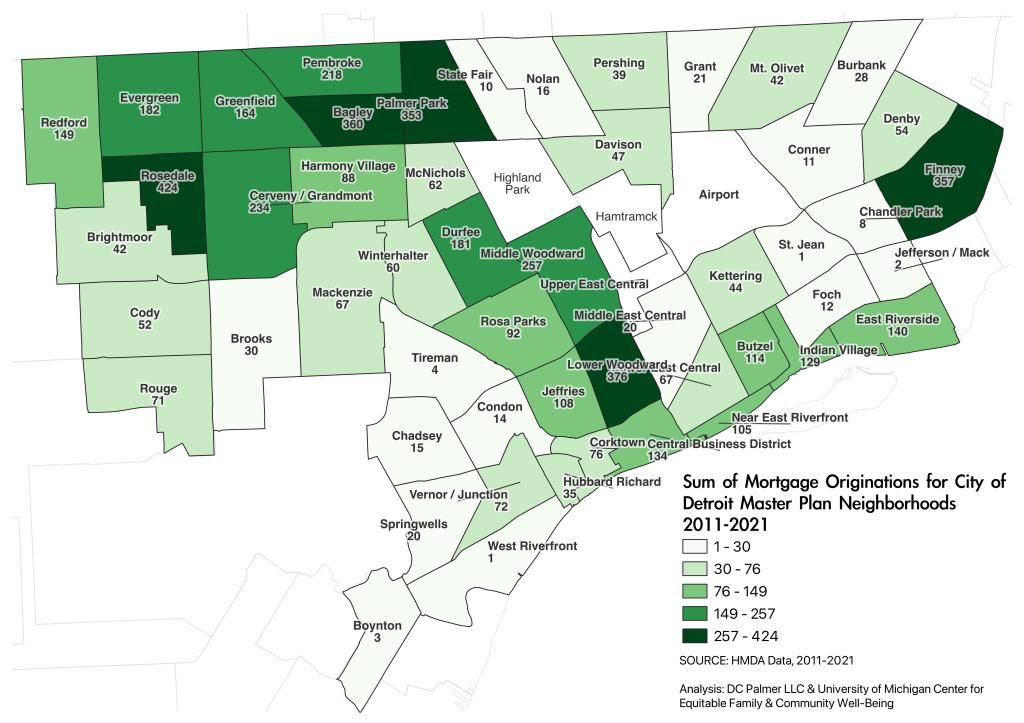
I contributed some mapping support to the research conducted by DC Palmer and the UM Center for Equitable Family and Community Well-Being on home mortgage data in Detroit.
“According to Anthony Smith, the City of Detroit DPA program manager, as of May 11, there were 2 applications successfully originated (closed), 11 vetted for approval, and 35 applications in process. By June 20, Dina Harris, CEO of National Faith Homebuyers – the contract organization managing the program for the city – reported that 38 home loans were originated (closed), 53 were approved pending closing, and 49 were in the application process. With roughly $5 million available for DPA assistance, there are enough funds for at least 200 successful DPA applications available on a first come first serve basis. City officials and contractors have hinted that there is an opportunity to re-seed the fund with additional dollars if the program is successful. If these trends hold true, current City of Detroit DPA funding will be exhausted before the fall of 2023.”