Detroit Coffee Map 2024

Tracking and mapping coffee shops is becoming an annual activity. The demand to know where to get caffeinated is so high and the turnover has a breakneck pace. Regardless, Detroit now has 100 spots to find coffee!

Since last year there have been 11 closures including 3 Starbucks locations and 3 more Tim Hortons (after 6 others previously closed), 2 locations on a break (Detroit Sip and Encarnacion). Closures included the hyped Haraz Coffee opening in Midtown. Building issues seemed to be what pushed them to move on, but another specialty Yemeni coffee shop is already staffing up. New York based, Moka & Co. is prepping the space and now hiring. The Midtown Starbucks site is being picked up by Qargo Coffee which has a number of locations in Florida, Texas, and California.

There are 18 new coffee shops, including unique offerings like Moon Dog Cafe, startup brick-and-mortar at Mission Cafe (coffee only on Wednesdays), the rebirth of the former Avalon International Breads as a second Kitab location, or blending books and coffee at Eastside Roasterz adjacent to Next Chapter Books. In the chain coffee category Dunkin has recently exploded and added multiple locations. The Detroit Coffee Club is also an exciting new addition where pop-up espresso coffee is offered at non-cafe locations like Dyno Climbing Gym, Beaverland Farms, and Two Birds.

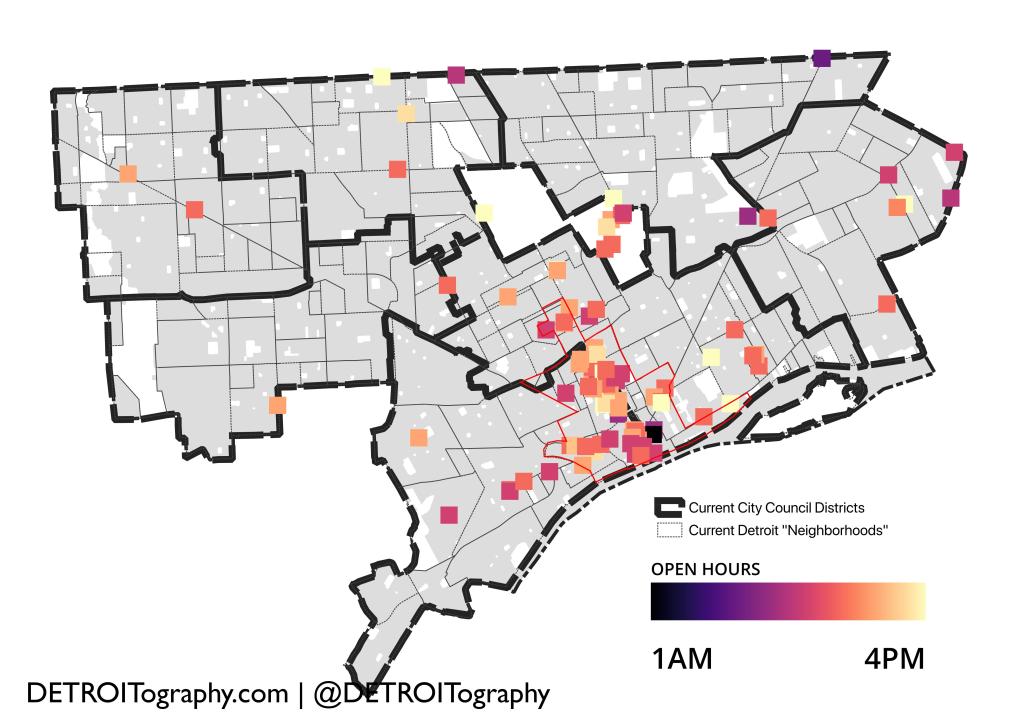
One of the most important questions I’m always asked about these coffee locations is how early and how late are they open. If you are an early bird, there are 27 options open by 6AM and another 25 open by 7AM. By 8AM over 75% of all coffee locations are open and serving hot coffee.

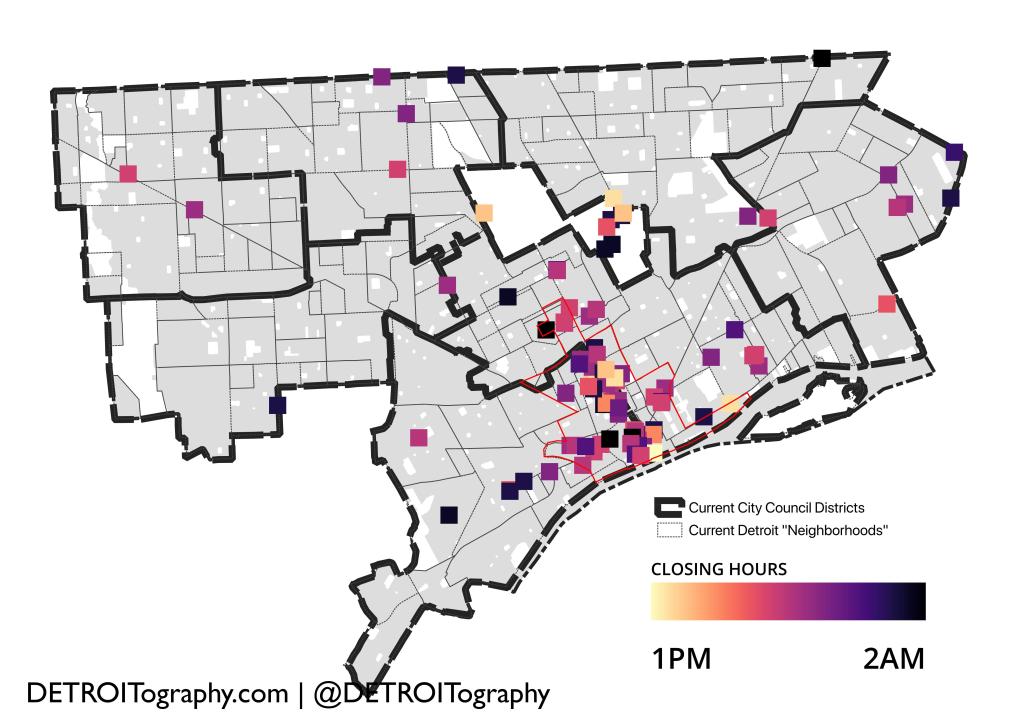
Coffee spots are harder to find if you want your coffee late into the evening. Most locations close either at 3PM or 8PM. By 6PM, 60% of coffee locations are closed and by 8PM over 80% are closed. There are only two coffee spots open until midnight and two open until 2AM.

Future coffee spots that I’m are watching include Detroit Rosa’s second location in the Water Square Hotel, Sepia Coffee Project’s brick-and-mortar in Highland Park, and Haraz Coffee’s Corktown location opening.

Check out these locations collected on DetroitData.org

Map: Pharmacy Locations in Detroit 2017 vs. 2024

I had a great time collaborating with Laura Herberg, civic reporter for Outlier Media, on examining the change in chain pharmacy locations in the city. I’ve mostly tracked pharmacies and convenience stores like CVS, Rite Aid, and Walgreens as they are often a secondary food retail access point preferred by Detroiters. Many of these locations have converted over the last decade into dollar stores, which have their own issues and generally suppress grocery opportunities.

Check out the slider below to compare 2017 locations with 2024 locations.

On Outlier Media:

Detroitography put together maps for Outlier Media that show current and closed locations. While the number of CVS and Rite Aid stores declined, the number of Walgreens locations increased after the chain opened a small, pharmacy-only shop on Woodward Avenue and three pharmacies inside hospitals.

Event: Jane Jacobs and the Detroit Economy + Jane’s Walk

WHEN: Saturday, May 4th at 3pm + walk at 4pm

WHERE: Book Suey, Hamtramck

WHAT: Book Suey is excited to host a talk by urban planner and commentator Idrees Mutahr on how the Detroit economy influenced the thinking and writing of celebrated urbanist Jane Jacobs. The presentation will be followed by a “Jane’s Walk” around Hamtramck to explore these ideas in the real world.

RSVP: Eventbrite

Map: NatureScore in Detroit 2024

Detroit has made substantial investments into its parks, secured funding for a city loop greenway, and fostered partnerships to improve amenities. This map shows off a number of neighborhoods where access to greenspace is plentiful, but nearby cities like Dearborn, Hamtramck, and Downtown Detroit are lacking. Northwest Detroit is a the main standout in Detroit where improvements could be made. The Lodge cuts through some very densely populated neighborhoods and most parks in the area are relatively small.

More from article:

Using satellite imagery and data on dozens of factors — including air and noise pollution, park space, open water and tree canopy — NatureQuant has distilled the elements of health-supporting nature into a single variable called NatureScore. Aggregated to the level of Census tracts — roughly the size of a neighborhood — the data provide a high-resolution image of where nature is abundant and where it is lacking across the United States.

Map: City of Detroit Employee Disclosures by ZIP Code 2022

When the Detroit Free Press published their extensive PDF list of FOIAed disclosure statements from City of Detroit senior employees, Directors, Deputy Directors, Chiefs, and similar senior roles, I was fascinated by how little information was included in those disclosures as well as the wide range of regional home addresses.

I present here and close the case for regional transit. The residence furthest South was in Dayton, OH (or Parkland, FL if you count second properties), the furthest North was in Grand Blanc, MI, and the furthest West was in Eaton Rapids, MI. If this is the spread where executive leadership comes from then just imagine where the full roster of staff resides.

In total 41% of senior staff live in the City of Detroit, clustered in the University District, Palmer Woods, Sherwood Forest area.

Find a spreadsheet of the data on DetroitData.org

Detroit By The Numbers: March 2024 Data Roundup

5,525

homes where official owner was deceased (Michigan Public)

11 million

DDOT riders in 2023 (DDOT)

9%

Detroit home owners are uninsured (Consumer Federation of America)

400 workers

Stellantis let hundreds go in mass firing event (FOX 2)

Event: Transit Fantasy Support Group with YPT Detroit

Detroiters and non-Detroiters alike will never stop fantasizing about having a robust and connected rapid transit system. These transit fantasy maps are often trailed by comments of “what’s the point” or “we’re never gunna have that,” but why stop dreaming? and planning? and connecting?

WHEN: Tuesday, April 30th at 6pm

WHERE: North End Taproom, 111 S. Main, Royal Oak

WHAT: Meet others who fantasize about regional transit, look at cool maps, make your own map of the people mover expansion!

RSVP: Google Form

Map: Where Fires Happen in Detroit 2015

Back in 2015, Loveland Technologies, now ReGrid, listened to the scanner from January to July and visited hundreds of fires to survey the impact on property and people. There were 2,938 structure damaging fires surveyed with 58% under suspicious circumstances or arson. The hot spots really stood out to me as areas facing high levels of crime and areas on the fringes of population centers in the city.

Map: Flight Obstruction Area Detroit City Airport 1968

The “flight obstruction area” comprises all areas of land or water below the airport referenced imaginary surfaces for each airport. Since its beginning, the Detroit City Airport has continued to gobble up residential space in the name of development, but also safety. In the recent budget presentations, the City Airport Director said they condemned 35 additional residential properties.

The upcoming NFL Draft event is also expected to bring 120 private planes while Detroit Metro Airport (Romulus) expects 290 private planes. A major air traffic influx, but it’s yet to be seen if there will be an influx in investment to become the “premier business airport in the region” as Director, Jason Watt hopes.

This map is part of the Hill Map Collection digitized in partnership with the Reuther Library and Archives as part of the Detroit Atlas Collaboration funded in part by the WSU Union of Part Time Faculty (UPTF) Professional Development Fund.

Map: Detroit School Absences and WIC Enrollment 2016

I’ve been digging through my archives and came across a set of maps I made while working for the Detroit Health Department (DHD). It seems a good time to share now that DPSCD is launching health hubs with funding support from the Pistons. School absenteeism is a widespread and known issue among the Detroit school age population. The factors and causes are numerous and variable, but broadly Detroiters face many barriers and that is not news. This map from 2017 highlights some of the more child-focused neighborhoods where both WIC enrollment is high and school absenteeism is high. That is partly due to these being the most dense areas with children. While I worked at DHD we attempted to plan with a lifecourse approach: how can we set you up for health and success from birth to school to old age?

Event: Open Data Day 2024

I’m really excited to share that DETROITography was awarded a mini-grant from the sponsors of Open Data Day 2024 sponsors: Jokkolabs BanjulOpen Knowledge Foundation (OKFN), Open Knowledge GermanyDatopian and Link Digital.

DETROITography’s focus has always been on small data, neighborhood level data where others focused on the big or institutional data. We’ve always wanted to get Detroiters mapping their own neighborhoods and providing their own voices to the city’s data narrative.

To that end, we are relaunching a CKAN open data portal with the goal of expanding community engagement with data and find-ability of local data.

WHEN: Thursday, March 7th @ 12pm

WHERE: Simons Rooms, WSU Purdy/Kresge Library or Zoom

WHAT: Neighborhood Data Discovery

Join us on Open Data Day 2024 for the relaunch of the DetroitData open data portal – the open data catalog for the Detroit community. Previous efforts in 2013-2016 were focused on filling a gap, but then open data proliferated. We’ve noticed again a drop off in the regular sharing and discovery of the available data. 
Come out and explore the DetroitData catalog, ask questions, and register. The open data portal intends to serve as an agnostic, neutral venue for community groups to share their local survey results, local media to share datasets acquired via FOIA request, and open up the opportunity for more Detroit-based people and organizations to influence the city’s data narrative.

RSVP: Event Link

Map: African American Monument Disparities in Detroit

The National Monument Audit by Monument Lab revealed that there are just two “monuments” dedicated to African Americans out of nearly 130 monuments documented.

  • Joe Louis Fist
  • Martin Luther King Jr. scuplture

You could add the new MLK statue at Hart Plaza and the underground railroad feature at the riverfront by Hart Plaza, but still that’s only four. The Martin Luther King Jr. statue was just installed last year and was a left over statue from the Smithsonian. It feels rather absurd that a city that grew to be majority Black or African American has so few monuments dedicated to the people who have made the city what it is today.

Learn more about public art in Detroit where there has been more African American influence on the visual landscape of the city in the Concrete Canvas exhibition at the Detroit Historical Museum.

Map: Detroit Edison Route Map of the City of Detroit 1980

This simple map of main roads and expressways served as a minimalist route map for the Detroit Edison Co., what would become DTE Energy. The most interesting element is the typed title of the source and publisher of the map “Generation Engineering, Cartography.” DTE had a cartography division into the 1980s and I wonder how much of a bridge that team was from the grandiose maps and plans of Doxiadis commissioned by DTE to the present day mapping of power outages.

This map is part of the Hill Map Collection digitized in partnership with the Reuther Library and Archives as part of the Detroit Atlas Project funded in part by the WSU Union of Part Time Faculty (UPTF) Professional Development Fund.

Map: Reliable Detroit Transit

by: Connor Pierce, Wayne State University (Intro to GIS, Fall 2023)

I believe transit frequency to be one of the best metrics for evaluating the success of a public transportation network. If a system has long wait-times between vehicles, it reduces the reliability of the system for the average rider. If a person is traveling on more than one transit line, the chance of making their transfer becomes increasingly lower as headways become higher. Long waits can manifest a decrease in overall ridership, as they turn away would-be passengers who require a high degree of
reliability for commuting to work or school. I also view frequency as an accessibility issue. Accessible spaces on buses and other non-paratransit vehicles is limited, and if all available spaces are taken, riders should only need to wait a short while for the next vehicle to arrive. Additionally, if a rider needs to exit the bus to take care of a medical issue before resuming their trip, it is important for them to be able to onboard the next vehicle within a reasonable amount of time. Therefore, when evaluating a city’s public transportation system, it is important to know where the high-frequency transit lines are
located and which areas fall within their catchment zones. The map above shows the location of these areas for the City of Detroit.

This was done by importing transit stop and route data for the QLine, People Mover, DDOT buses, and SMART buses (in addition to street and city boundary shapefiles) from data.detroitmi.gov. I then, capped the frequency at 20 minutes for peak times to show which routes operate with lower headways. These routes included the People Mover, QLine, and eight DDOT bus lines, including the: #3 Grand River, #4 Woodward, #6 Gratiot, #7 Seven Mile, #9 Jefferson, #10 Greenfield, #16 Dexter, and #17 Eight Mile routes. None of the SMART bus routes have headways of 20 minutes or less. Then, I created a quarter-mile buffer around these transit lines to show which parts of the city
fall within the catchment area of these stops.

The initial map of this post represents the results found in the second map. It includes the total calculated size of the catchment area for frequent transit lines in Detroit compared to the size of underserved areas. The underserved areas of the city make up almost 2.5x the area that is served by frequent transit. I see these shortcomings as a sign that the city should invest in improving the frequency of bus services on existing routes rather than attempting to create new infrastructure for other modes of transportation. If infrastructure improvements are made, they should be to improve bus services in the city (i.e. creating dedicated bus lanes, bus rapid transit upgrades to existing routes, improving bus stop shelters, etc).

Map: New Detroit City Council Districts for 2025

During their vote on February 6, the Detroit City Council swiftly selected “Option 6.” It was the last requested council redistricting map option that creates the least amount of change, but meets the bare minimum of the redistricting requirements for population distribution. The most populous, District 1, will still have 8% more people than the least populous District 3. I’m not sure that the council has truly taken on the task of redistricting adequately. The new districts will take effect on January 1, 2026 after new city council members will have been elected based on the new districts in November 2025.

During the January 16th City Council Public Hearing on Council Redistricting, Council President, Mary Sheffield asked the City Planning Commission (CPC) whether they had considered the impact on “neighborhoods” or neighborhood groups that might be split by the new boundaries. Jamie Murphy, CPC staffer, responded that they had not considered that because the city’s neighborhood layer didn’t correspond with what residents felt their neighborhood boundaries were.

Residents of Grixdale Farms came out in force to the public hearing and other meetings to voice their opposition to being removed from District 2. The Lower Eastside Action Plan (LEAP) at Eastside Community Network (ECN) advocated for a boundary that kept their members together. The HOPE Village initiative also submitted a map that would keep their focus area from being split. If you ascribe to the city’s definitions of neighborhoods, there is a lot of significant change. Notably, “The Villages” are split down the middle and Wayne State moves from District 6 to District 5.

Besides an imbalance in population across the districts, there is also an imbalance of voter participation. The political challenge with redistricting is getting physically drawn out of your District. The political opportunity is to get elected with very low turnout like in District 3, 4, and 7. District 4’s expanded boundary provides it a handful of more active voters while District 3 and 7 haven’t gained in similar ways.

Detroit By The Numbers: January 2024 Data Roundup

542

“Detroit” places in Detroit, next most is 23 in Southfield (Model D Media)

39%

Homeless families report domestic violence (City of Detroit)

$16.5 million

Awarded to the City government for service line replacement in two areas: Midtown (Cultural Center, Medical Center, Midtown) and Barton-McFarland [McFarlane?] (EGLE)

1 million

Qline riders in 2023, a 50% increase from 2022 (QLINE)

Maps at Home with Brittany Simmons and a Historical 1899 Bicyclist Map of Detroit

What is your map from home (title, year, etc.)?

This 1899 Map of the City of Detroit reprint shows paved streets (of various materials), public schools, police stations, street names, and more!

Where did you find/acquire the map?

I purchased this map from a historical map print seller on Etsy.

What made you hang it on your wall? What stood out to you? What details do you enjoy about the map?

I love maps – I’ve been gifted and purchased a few of my own. Detroit is the city that introduced me to my profession of urban planning, the city that I’ve studied most in-depth, and ultimately the city that I wanted to work in.

This particular map stood out to me because of the intersecting colored lines and the bold symbology – it reads like a piece of art. Detroit is my favorite city, so to have a piece of “art” that reflects this City’s history on my wall is special to me.

What in your background has drawn you to maps?

As an urban planner, I’ve spent a lot of time analyzing maps, and now creating maps. Maps are such a powerful medium that tell a unique story of place, how it functions, and how it changes over time.

Map: Detroit’s Downtown Shoppers Parking Guide 1954

Downtown Detroit was literally built on the premise of parking lots when the city population was at its peak of over 1.8 million people in the 1950s. This “Shoppers Parking Guide” in 1954 promoted the message, “To Shop Drive Car, To Work Ride DSR.” The pamphlet notes that there is always a parking space available and if you find yourself at a parking lot that is full, simply use the guide to find another parking option. The guide shares the tax benefits of parking Downtown and that Downtown has a “greater and better” concentration of amenities and attractions.

The pamphlet guide and map were produced by Educational Cards Inc. and are clearly hand drawn and hand colored to denote parking lots and parking decks or garages as well as future parking. Detroiters and national pundits alike often shout the ills of dedicating land to parking, but perhaps the real metric is the parking space relative to population?

This map is part of the Hill Map Collection digitized in partnership with the Reuther Library and Archives as part of the Detroit Atlas Project funded in part by the WSU Union of Part Time Faculty (UPTF) Professional Development Fund.

Detroit By The Numbers: December 2023 Data Roundup

60

recent Legislative Policy Division of the City Planning Commission (CPC), serving City Council, reports there are 60 scrap yards in the city – a significant difference from the 95 reported by BSEED in June 2023 or the 110 number listed by EGLE in August 2023

$300

median income went up in Detroit per new U.S. Census Bureau data, but rent costs are increasing at a higher rate (U.S. Census Bureau)

80-81

updated Tree Equity Score for Detroit from American Forests and the Detroit Tree Equity Partnership, which falls into their moderate category for desired tree canopy coverage. They find 24% of block groups have a score less than 75 and need more tree equity

252

lowest number of homicides in 50 years in 2023, Detroit also has the lowest population numbers in 50 years. Overall the homicide rate per 100,000 people dropped from 50 in 2022 to 41 in 2023. Typically, the “justifiable homicide” rate is also quite high with 24 in 2022, but per the city’s open data there were just 5 justifiable homicides in 2023. (FOX 2)