Welcome to our Data Forum where we will explore a new category of data each month. This month we will be focused on property data, the relaunch of Property Praxis, and the important details when trying to utilize parcel data.
We’ll be joined by Chase Cantrell of Building Community Value, Joshua Akers, instigator of Property Praxis, and Aaron Mondry from Outlier Media writing on the “speculators of Detroit.”
Don’t miss out on this opportunity to connect with fellow data enthusiasts and expand your knowledge in this exciting field. Register now and secure your spot!
WHEN: Friday, December 13th, 12:30-1:30pm
WHERE: Virtual
WHAT: Join us at the Data Forum to dive into the world of election maps, precincts, and more – all from the comfort of your own home!
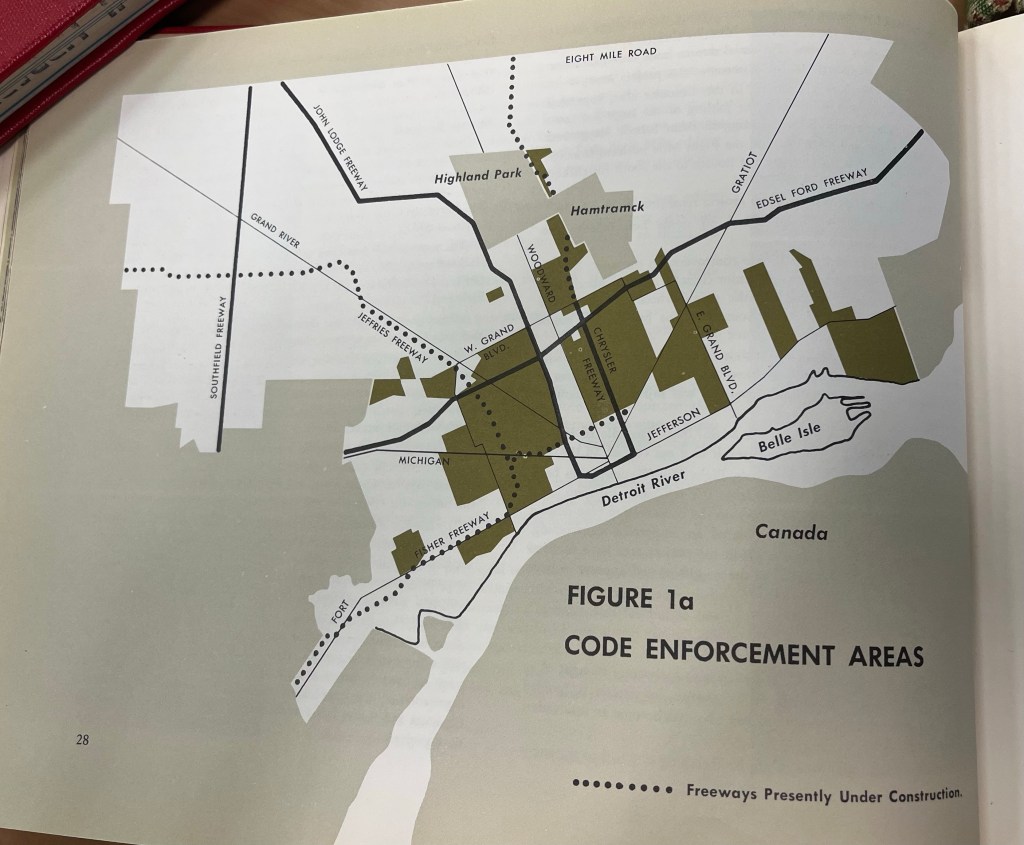
I was pleasantly surprised by the maps in the report: “Detroit: A New City” from the Mayor’s Committee on Community Renewal and prepared by the City of Detroit, Department Report and Information Committee. The city’s Community Renewal Program (CRP) was the vehicle for studying and planning Detroit’s future amidst the federal urban renewal regime. For better or worse the CRP produced numerous reports and maps that chronicle the condition of the city at the time. In particular this map of code enforcement, mostly focused in the “The Middle City” stood out to me as in present day Detroit these areas have seen a fair degree of reinvestment.
The National Community Reinvestment Coalition (NCRC) has put together an incredible interactive map and dataset of all Home Mortgage Disclosure Act (HMDA) data since 1981. HMDA was created as a stop gap to use data to identify if redlining was still occurring. In recent history, HMDA was a data source that demonstrated “reverse redlining.”
“this interactive map shows the geographic spread of originations at the metro-, county-, and Census tract-level throughout the United States in circles of various sizes. High Minority (50-80%) and Very High Minority (> 80%) are shown in light purple and dark purple, respectively.”
Welcome to our Data Forum where we will dive into the world of Election Maps, Precincts, etc. specific to Detroit data. Join us online for lunch-and-learn filled with insightful discussions, tips, and tricks on all things related to election data. Whether you’re a seasoned data analyst or just starting out, this event is perfect for anyone interested in learning more about how data shapes our elections.
We’ll be joined by State Representative Donavan McKinney, reporter Malachi Barrett at BridgeDetroit, and local election data wizard Jackson Franks!
Don’t miss out on this opportunity to connect with fellow data enthusiasts and expand your knowledge in this exciting field.
WHEN: Friday, November 15th, 12:30-1:30pm
WHERE: Virtual
WHAT: Join us at the Data Forum to dive into the world of election maps, precincts, and more – all from the comfort of your own home!
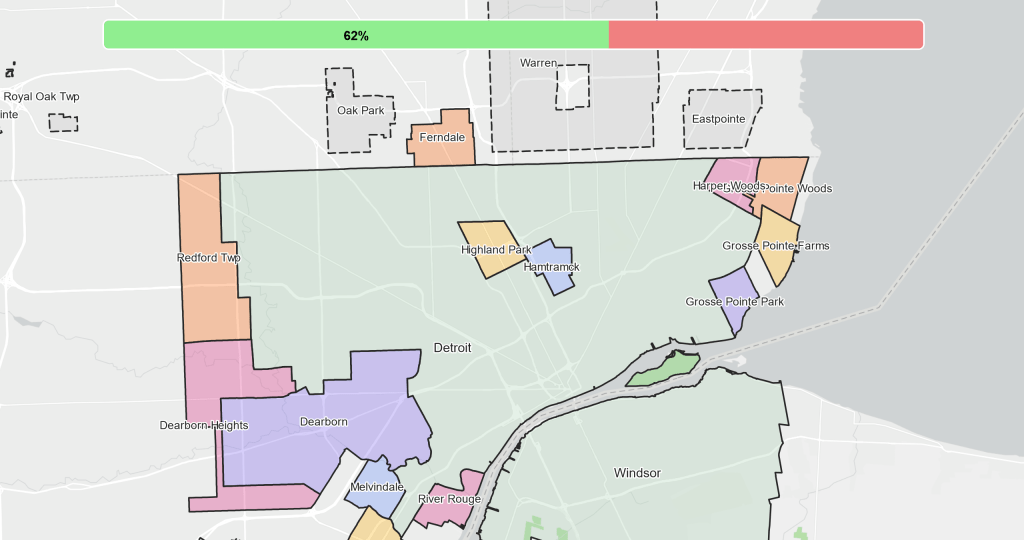
Map puzzle results skewed on purpose, use the link below to try yourself. [Map puzzle] developed by Marie Yu for DETROITography.
Detroit is bordered by 20 municipalities, can you correctly place all of them? Michigan’s “Home Rule City” Act halted many smaller municipalities from being absorbed by the City of Detroit when it passed in 1909.
Besides being a city, Detroit is also a broad concept in our metropolitan region. Depending on who you talk to Detroit can mean the 9-county economic zone defined by the Detroit Regional Chamber or simply the small expressway bounded area of Downtown if you are a visitor or transplant to the city. Residents of many adjacent cities affiliate with Detroit in order to be recognizable, but don’t always want to be affiliated with the issues associated with the city. Detroit city government leaders live all across the region and overall 70% of workers in Detroit commute in to their jobs.
Today we have a mixed region of large and small municipalities, some successful – some struggling, others very diverse and some not so diverse, but we are all neighbors. How we face the future depends on our collective understandings and shared connections.
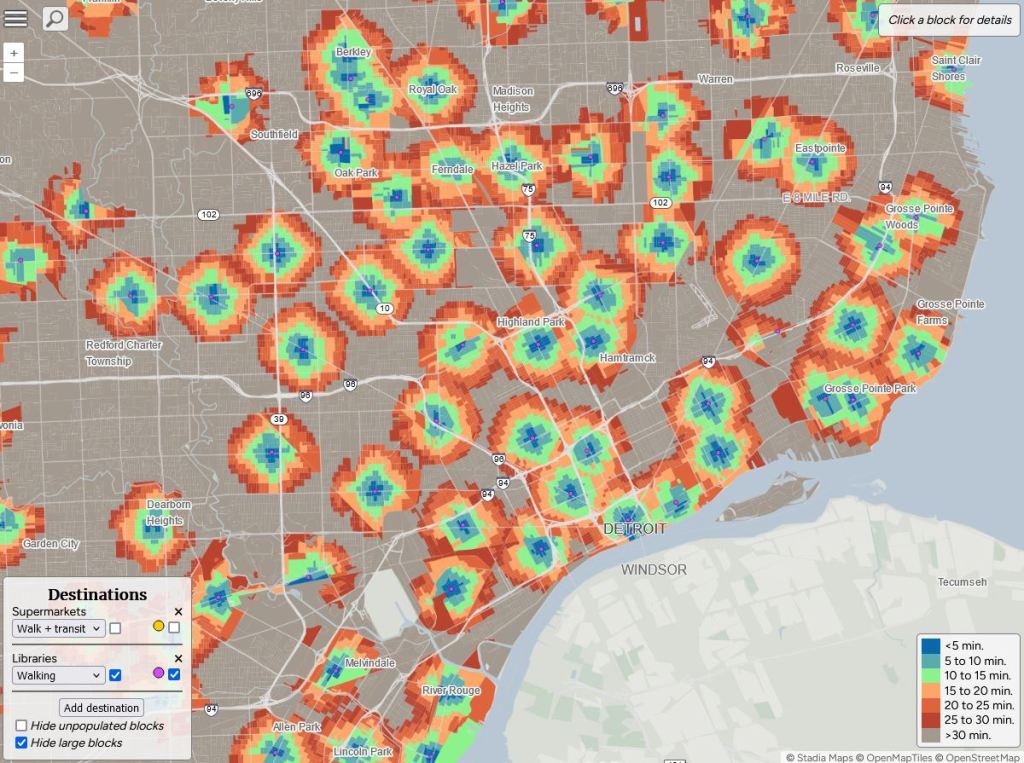
A new tool to measure accessibility and walkability in cities is out called Close from Nat Henry. The tool relies on supermarket and libraries data points in order to assess closeness. Oddly the data sources are not listed, so it is tough to measure supermarkets against our annual updated list of grocery stores and the data clearly doesn’t account for Detroit’s trouble with library funding and branch closures.
These kinds of tools are fun and interesting, but the lack of local nuance makes them tough to get too excited about when these maps might be used to paint a narrative about Detroit that isn’t quite right. The need for improved local data collection is critical.
We are very excited this year to have Jarell Brown, Director of Analytics & Business Intelligence @ The Henry Ford and Principal Innovator of the Innovation Atlas as our keynote speaker this year. We will also be hosted in an incredible space, the Urban Tech Xchange in Downtown Detroit.
Check out the full list of panels, lightning talks, and workshops! Register, submit, or sponsor!
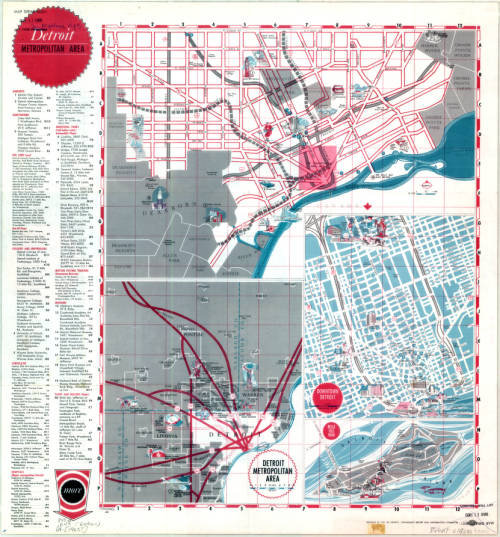
This map in the American Geographical Society Library Digital Map Collection at University of Wisconsin Milwaukee was created by the City of Detroit Department of Report and Information Committee. It’s always interesting to see maps that note the planned expressways. Beyond the city limits the expressways get very curvy and ephemeral.
The route that we would recognize today as the Lodge Freeway is labeled here as I-696 heading from Downtown to Northwest Detroit. Woodward Avenue still had the M-10 designation. The dashed line for the I-94 addition to the West took a bit of a different direction.
I stumbled across this 1995 HUD plan from when the Planning and Development Department was still on the 23rd floor of Cadillac Tower. I can’t figure out why the Detroit Receiving Hospital is not called out as a point of interest, but enjoy seeing many of the community hospitals marked.
From the report:
The City of Detroit’s Consolidated Plan includes a one-year Action Plan for the expenditure of $56,584,000 in Community Development Block Grant (CDBG) funds, $ 14,105,000 in HOME funds, $2,163,000 in Emergency Shelter Grant funds and $1,207,000 in HOPWA funds.
Anti-Poverty Strategy
Detroit has a poverty rate of over 32 percent. It’s unemployment rate, expected to be 11.6 percent in 1995, is nearly double the state and national rates. As a means of reducing and preventing poverty, the City assigns highest priority to attaining full employment for its residents, with special attention given to those with low skills and other special needs. All major development is assessed for maximum potential for temporary and permanent job retention and creation. The City’s community and economic development activities all have the goal of improving the availability of employment and/or access to employment. The City will continue to follow this policy as the major means of combatting poverty. It is realized that training and re-training in many cases are the primary means for equipping persons out of work with the skills to take jobs which become available in the current and future work place.
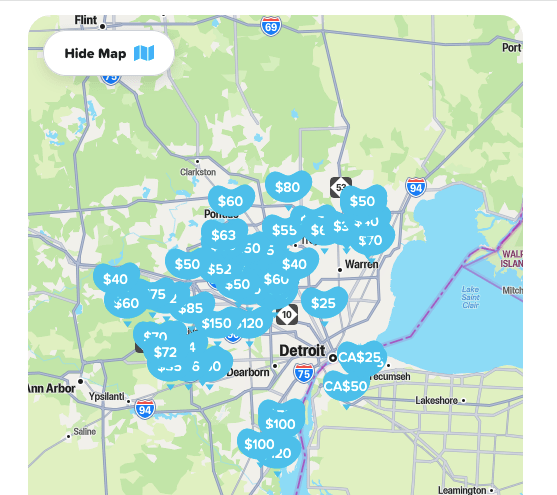
I’ve been asked many times over the years where all the pools are in Detroit. It is a tough question that I’ve tried to crack with aerial imagery, but that was too tedious. Recently, the Swimply site has been popping up in ads this summer and I wondered if this was a useful proxy for pool availability. Swimply let’s you list your pool or other backyard amenities for rent similar to AirBnB except that no one stays the night. Pool rates range from $25/hr to $150/hr including options in Windsor.
The only pool listed in Detroit proper is an above ground pool that can host up to 50 guests although I’m not sure that many people would fit inside the pool listed.
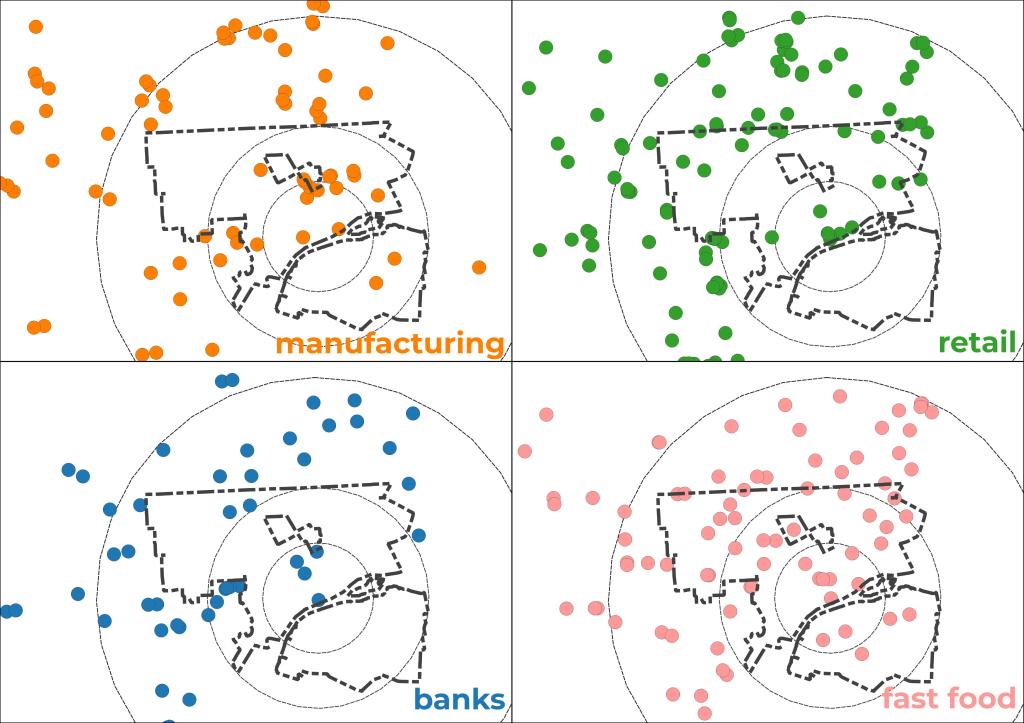
Detroit is a city of change even though we often seem relatively steadfast or even stagnant. I first mapped “business rings” of Detroit in 2014 and largely concluded they were empty except for national fast food chains. Now, 10 years later, I wanted to explore what has changed and what has remained the same related to the presence of national brands’ footprints in Detroit.
Retail
Downtown has benefited the most from significant investment, redevelopment, historic preservation, and large scale new construction. The new development brought in retailers like H&M, Lululemon, and even Gucci. Amazon did not select Detroit for their HQ2 location after a concerted effort by city elites, but the company did build a distribution facility on the old State Fairgrounds as well as a distribution center Downtown. In Detroit’s neighborhoods, key retailers like convenience stores, dollar stores, and pharmacies all had fits and starts and closures. Convenience stores and pharmacies closed many locations leaving even more limited retail options for Detroiters. Meijer opened up two additional locations in the city while independent grocers have been on a steady decline. Other regional retail loses included the closure of Eastland Mall (Macy’s, Target) and the Bed, Bath, and Beyond bankruptcy.
Manufacturing
The Poletown Plant nearly closed before being converted into Factory Zero to produce electric vehicles, but otherwise car building is still quite limited in Detroit. Other kinds of manufacturing have seen an increase in the city at corporations like Dakkota, Flex N’ Gate, and LEAR expanding operations into Detroit. Supposedly a large electric battery plant is coming to the city as well. The locations mapped are based on the 2024 Crains Detroit list of top Michigan manufacturers.
Banks
In the last decade, there has been a significant amount of bank consolidation. TCF Bank bought Chemical Bank and then the combined bank was bought by Huntington Bank. Compared to 2014, there are just 25% of bank branch locations left. Fifth Third Bank has kept an office Downtown and Huntington Bank also built a headquarters in Detroit and retains the naming rights for what most know as Cobo Hall.
Fast Food
Oddly, fast food in Detroit has had an reduction largely related to a Burger King franchisee losing their franchise agreement. There are empty and burned out Burger King locations across the city now compared to 2014. Other fast food hasn’t expanded much in Detroit, but regionally Chick-fil-A has been expanding.
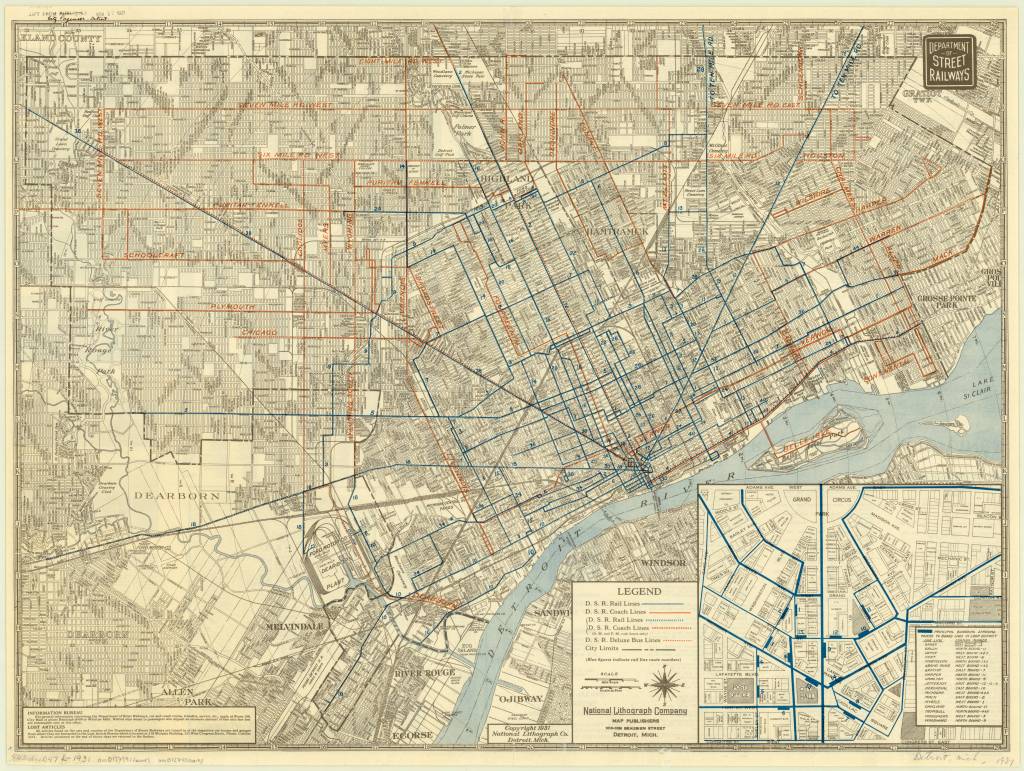
This 1931 Detroit Street Railways transportation map from the digital collections at the American Geographical Society Library, University of Wisconsin-Milwaukee Libraries is a beauty.
Can we bring back the bus route through the center of Belle Isle?
I’ve been cataloging maps in various archives and collections to get a comprehensive picture of Detroit’s cartographic history. In the Fall, efforts will be going full force to georeference as many maps as we can to analyze the city through history.
Check this map out on AllMaps, a platform to georeference any map from any institution that supports IIIF.
This University of Michigan team explored the repeat flooding within specific Detroit neighborhoods and the social determinants of health. The bright red clusters are areas of greatest concern. Notably, flooding is not limited to areas near the Detroit River, but is experienced frequently in multiple areas.
“Hot and cold spots of flooding using the Getis-Ord Gi* statistic. Red dots represent “hot” spots, or locations of statistically significant clusters of homes that experienced flooding. Blue does represent clusters of homes that reported not experiencing flooding.”
What a day, a long, hot, sad day. Detroit loves to roll out the welcome mat for major events for visitors Downtown, but closed down numerous city parks along the entire roughly 10 miles of Detroit coastline from Riverside Park in Southwest to Mariner Park at the Grosse Pointes border. Detroit limited viewing areas to Spirit Plaza and Hart Plaza downtown while Belle Isle was limited to capacity that could fit into the old Grand Prix paddock parking area. Belle Isle opened at 2pm to cars and hit capacity at 6pm. The space limitation was for vehicles so you could travel anywhere on the island on foot or bike, but I assume more people stuck to the Sunset Point area for viewing.
Meanwhile, the City of Windsor across the river with all riverfront parks open, 34 restaurant patios, ran a free shuttle for people to park at a nearby mall and get to the downtown parks. The city closed off downtown roadways as well for everyone to enjoy the Ford fireworks. The Detroit to Windsor juxtaposition is tough, they aren’t the same cities or population sizes, but the optics are mindbogglingly painful. One Detroiter even noted that they purchase a hotel room in Windsor for the fireworks every year because the experience is so much nicer across the river.
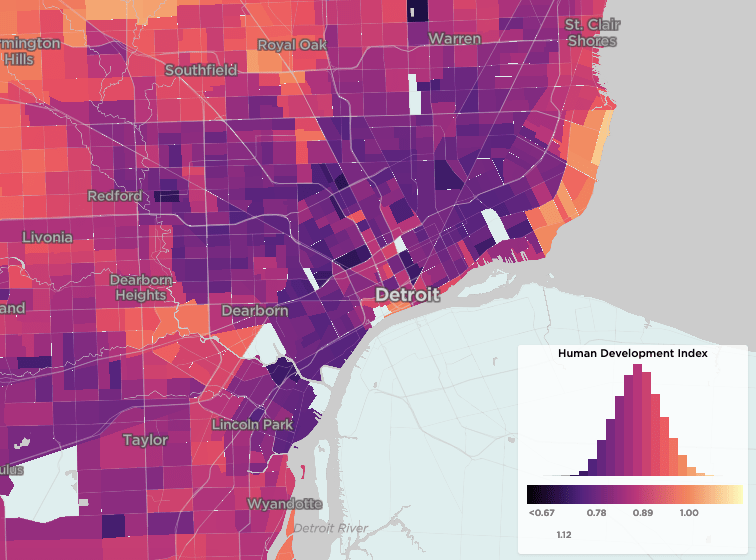
There have been close to 300 different indices created to measure demographics, health equity, and opportunity over the last decade. Nearly all of those indices rely on Census data, specifically 6 key indicators are used across many indices. The University of Chicago Mansueto Institute has create an index based on the UNDP’s Human Development Index for “communities” across the US and world.
More from UChicago:
“The Community Human Development Index is a way of measuring human development at the community level, with the potential for helping neighborhoods and societies address disadvantage. The human development index (HDI) is a statistic that represents a composite of educational attainment, life expectancy, and gross income, and is considered the gold standard measure of human development. It was developed by Indian economist and philosopher Amartya Sen and researchers at the United Nations Development Program (UNDP) to measure “human capabilities”, the extent to which a person in a specific context can pursue their happiness. It is, in the words of UNDP, a measure of “a long and healthy life, being knowledgeable, and having a decent standard of living.” HDI has been used to compare nations, but until the Community Human Development Index, it hasn’t been used to compare cities or local communities, because the statistic had not been calculated at the neighborhood level.”
DTE Energy is again requesting a $450 million rate increase just four months after being approved for a $368 million rate increase.
“DTE is following their usual playbook, incessant and oppressive rate hike requests not grounded in reality, but rather based on the financial aspirations of their corporate shareholders.” – Dana Nessel, Attorney General
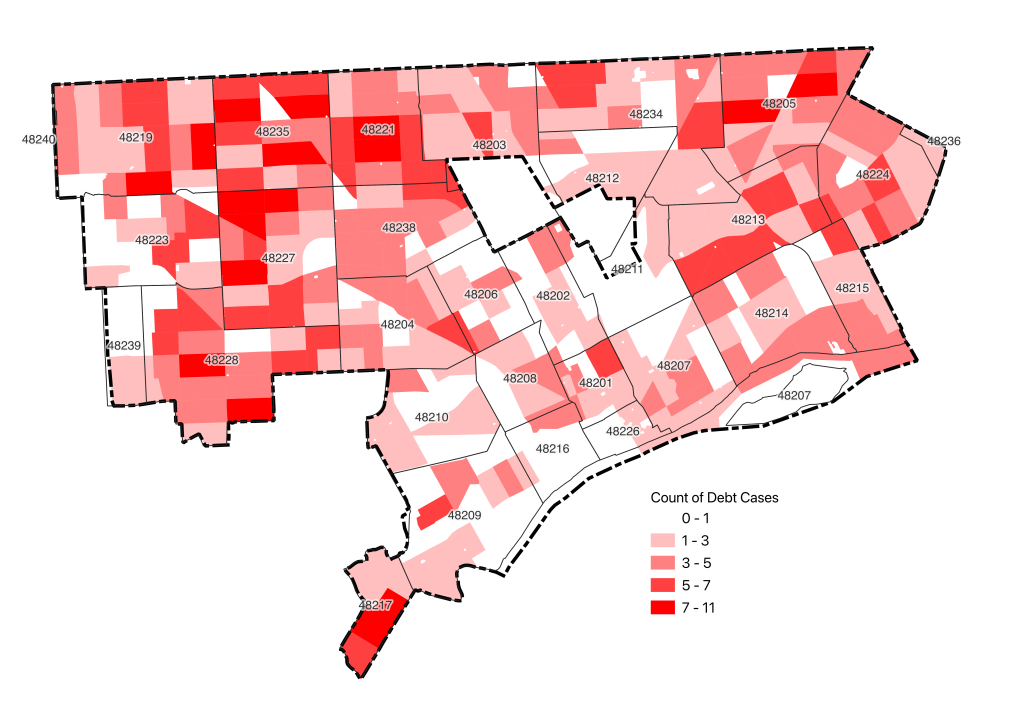
The absurdity of DTE rate increases follows a trend since 2015 of increasing rates by $1.1 billion. Yet, there is an even more absurd action taken by the power-hungry energy monopoly, selling debt. Outlier Media found in 2022 that DTE sold $282 million in debt from almost 300,000 customers for just $4.8 million to Jefferson Capital Systems.
Michigan has some of the most lacks rules around wage garnishment for debt collection so companies like Jefferson Capital bulk submit debt cases to the courts and receive default judgements which automatically starts taking funds from someone’s paycheck. Two out of three Detroiters were found to have some kind of debt in collections in 2016 and UM Poverty Solutions found 56% of Detroiters are financially insecure.
The data on this map was scraped from the 36th District Court listings of debt collection cases.
WHERE: Next Chapter Books, 16555 E. Warren, Detroit, MI 48224
WHAT: Join us to hear Alex B. Hill discuss all things Detroit and Maps!
We are excited to host Alex, who will present from his popular book, Detroit in 50 Maps. Alex is the Director of Data and Community Research for Detroit at Work, an adjunct professor at Wayne State University and the lead cartographer of DETROITography.
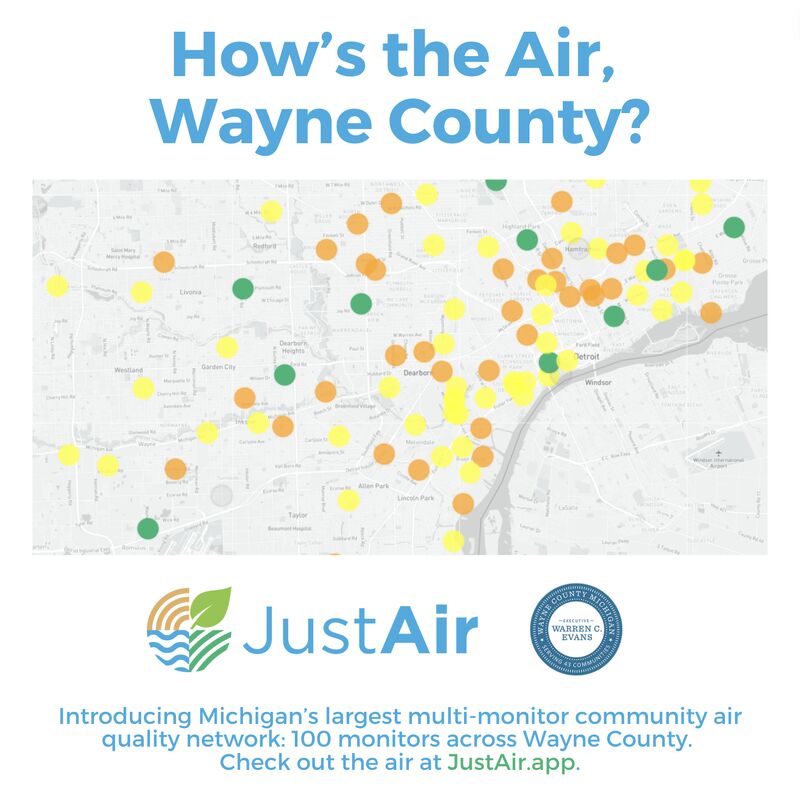
A project idea that has been in the works for just shy of a decade was finally made real by the team at JustAir and the Wayne County government. While I worked at the Detroit Health Department I worked on conceptualizing and then managing an effort to create an air quality sensor network that could provide neighborhood-level updates on air quality. The issue was that EPA and EGLE monitors were too few and far in-between to truly know what your air quality was on the Lower Eastside or Far Westside of the city, especially if you were trying to manage asthma or other respiratory diseases.
In Detroit we called it D-REACT, but only implemented an asthma medication monitoring project where the greatest outcome was pediatrician education about asthma medications necessary and covered by Medicaid. We also were able to implement the Air Quality Sensor Learning Collaborative, now convened by the Ecology Center who has been able to train and support numerous community organizations with low-cost, air quality sensors.
I’m so excited for the JustAir efforts and look forward to seeing this network have big impacts in Detroit and across Wayne County.
The Detroit Electronic Music Festival (DEMF) now known as Movement Detroit brings tens of thousands of people from around the world to the birthplace of techno. Many people think of the music festival as a limited series of performance stages in Hart Plaza downtown, but the festival sparks events, parties, and other interactions across the city.
This map would be impossible without the excellent compiling by @gin.ebony, hat tip to Violet Ikonomova for sharing the linked Google Sheet of all 845 events with 696 performers. Outside of Hart Plaza the top locations are:
Marble Bar (62)
Spot Lite (54)
Tangent Gallery (54)
TV Lounge (50)
City Club (49)
Lincoln Factory (47)
Motor City Wine (46)
This map and data update wouldn’t be complete without pouring one out for Temple Bar, a staple of the Detroit music and nightlife scene. Before Movement Detroit a sinkhole formed in the road out front and the following day, the roof of Temple Bar caved in. As far as I know the first night of performers at Temple Bar had to be canceled, hopefully others were able to relocate their shows.
Detroit is the birthplace of techno. We are the heart of the Motown sound. The city is a bastion of jazz, R&B, soul, rock and roll, and hip hop. You can’t have music without Detroit.
WHERE: Andiamo Detroit Riverfront, 400 Renaissance Center
WHAT: Join a fun and informative walk through the city with Cities Reimagined and Detroit native Kelsey Hubbell. This walk is a great opportunity to explore Detroit through the lens of urbanist hero Jane Jacobs, and learn about how we can make our cities better places to live. Whether you’re an urban enthusiast or just looking for a casual stroll, this walk is for you!