Map: Reuther Library compiles 1967 reports to Mayor Cavanagh

IMG_1684.jpg

Detroit’s museums have all pulled together incredible time capsules and commentaries on the events on the Summer of 1967.

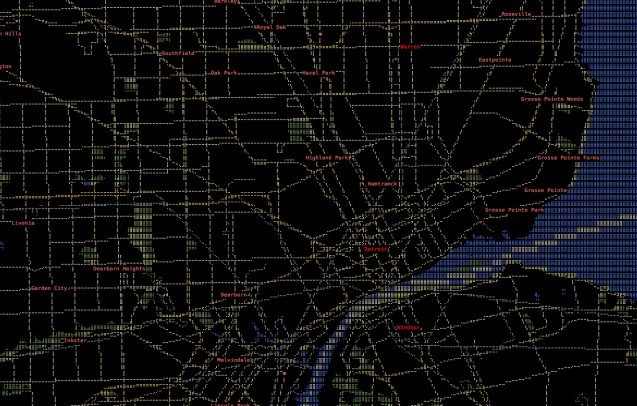
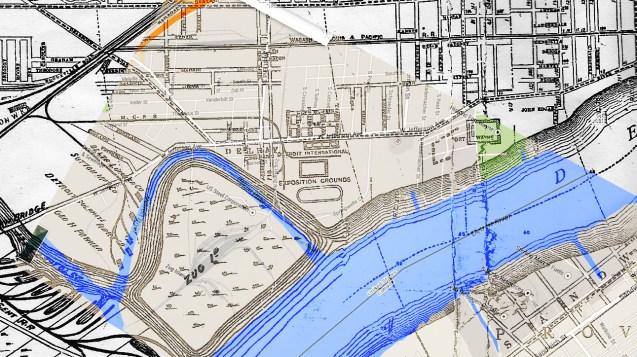
The Reuther Library has an excellent archival exhibit in their lobby that is accompanied by a web exhibit with related archival materials. This map in particular was created based on letters and calls made to Mayor Cavanagh’s office during the period of unrest in 1967. All of these incidents were unconfirmed reports made by members of the Detroit Commission on Community Relations.

Map: Affordable Housing in Detroit 2016

screen_shot_2017-05-16_at_4.37.29_pm_2.png

Affordable housing is at an odd crossroads in the fluctuating, contradictory, and confused real estate market of Detroit. The City of Detroit has touted “affordable housing” agreements with many developers and has also committed to keeping  seniors in their HUD housing.

Researchers from the University of Michigan found that the majority of expiring HUD housing units are located in Greater Downtown where they are most likely to be flip to market rate apartments and drive longtime Detroiters out. Currently, there are more than 2,000 units receiving the federal Low Income Housing Tax Credit (LIHTC) that will expire between 2016 and 2020.

In his “State of the City” address, the Mayor highlighted the city’s effort with the Rockbury group to secure 2 subsidized housing contracts from expiring so that 165 residents could stay in their homes.

Map: Life Expectancy in Detroit 2004 – 2013

LE-Detroit-map.png

The Center for Society and Health at Virginia Commonwealth University (VCU) worked with the Robert Wood Johnson Foundation to create life expectancy maps for city across the United States.  The death data came from MDHHS Vital Records and Health Statistics and was paired with Census data from 2000 and 2010 to generate a 10-year average.

The geography of life expectancy in Detroit varies with Downtown/Corktown/Southwest presenting the longest life expectancy along with much of Northwest Detroit and Hamtramck. If you took a drive East to Harper Woods life expectancy would be 77 on average or to the Grosse Pointes where life expectancy is 82 years. Social determinants of health are influential factors from school systems, health facility availability, and access to various opportunities that are lacking in the city.

Map: Cadillac’s Detroit Illustration 1702

detroit-cadillac-1702

Hat tip to Paul Sewick for this great map find!

You’ve really got to zoom into the original from the Burton Historical Collection to realize that Antoine de la Mothe Cadillac wasn’t just drawing Lake St. Clair, but Fort Pontchartrain and the three nearby Native American village settlement.

Map: Discover Corktown 2013

corktownmap

In 2013, Awesome Mitten put together a quick guide to new and changing places to visit in Corktown and included this nice illustrated map.

It’s interesting to see what was left off the list and also what has changed. St. Cece’s is closed, the Old Tiger’s Stadium site is under construction, the Corktown Inn (Trumbull and Porter Hotel) has had a major facelift, there are multiple new restaurant and retail spots, including: Katoi (before-the-fire), Two James Distillery, Gold Cash Gold, Ottava Via, Rubbed, Batch Brewing, Bucharest Grill, Detroit Institute of Bagels, Metropolis Cycles, Happier Camper, Detroit Artifactry, Detroit Grooming Company, and The Farmer’s Hand). Corktown is still waiting for development at Michigan Central Station and the CPA Building is still in unknown limbo, but the “Elton Park” residential development is moving forward.

Map: The Shrinking of Hamtramck 1825 – 1922

hamtramck-1825-1922.gif

Named for Colonel Jean-François Hamtramck, who fought for the Americans in the Revolutionary War, the City of Hamtramck is an oddity being surrounded by the City of Detroit. The story of Hamtramck’s evolution is more so the story of Detroit’s desire to annex more land area.

Col. Hamtramck founded the area in 1798 after helping to take Detroit from the British. The Village of Hamtramck was formally established in 1901 and became an incorporated city in 1922 in order to stave off further annexation of the Hamtramck Township territory which used to extend into the Grosse Pointes to the East and as far North as 8 Mile, then known as Baseline Road.

If you live anywhere on the Eastside or in the Grosse Pointes you’re more of a Hamtramckan than you might think.

Map: Village of Woodwardville Detroit?

woodwardville-map

After the flop that was Judge Augustus Woodward’s “Plan of Detroit,” he purchased 8 adjacent plots in the “10,000 acre tract” and planned yet another never to be realized city, Woodwardville. Clarence Burton describes it as a “paper city” in an effort to “boom the lands adjacent to the cities.”

Read more from Paul Sewick on Detroit Urbanism:

Centered around Woodward Avenue north of what is now the Davison Freeway, the village was laid out in somewhat conventional rectangular blocks.

Fantasy Map of Detroit

middle-earth-detroit

This Middle Earth inspired map design comes from Stentor Danielson (Mapsburgh), professor of geography and artistic cartographer.

Inspired by the maps in antique atlases and fantasy novels, this map shows Detroit (along with Ann Arbor and Windsor Ontario) as a fantasy land of castles and dragons.

Map: Coney Detroit 2017

Coney-Detroit-2017-map

The coney dog was born in Detroit. The 2012 book titled Coney Detroit attributes the “coney dog” to Greek emigrants who likely passed through Ellis Island in New York (near the birthplace of the hot dog, Coney Island).

Coney dogs were cheap and quick allowing them to propagate outside of Detroit’s major factories. Workers had short lunches and limited budgets – the coney dog was the answer.

Today, there are multiple opportunities to eat at a Coney Island restaurant or diner. There are a few coney chains in the Southeast Michigan region and in the City of Detroit there are some coney clusters. Detroit’s Downtown is home to the Lafayette versus American rivalry, Northwest has Coney Islands right next to each other and includes Nicky D’s, while East of the State Fairgrounds sports a string of coneys mostly along Conant Street.


Map: Detroit’s Decline in Communities of Color 2000 to 2010

Screen Shot 2017-06-19 at 9.33.28 PM

People often know about Detroit’s historic “white flight,” but the most critical loss of population in the past decade has been within communities of color. The suburbs are rapidly diversifying, yet the City of Detroit continues to lose people, specifically people of color.

This map was part of PolicyLink’s “An Equity Profile of the Detroit Region.”

Map: Mosquito Breeding Risk Areas 2017

Arbovirus-Risk-Areas.jpg

Michigan and Detroit in particular had a spike in West Nile Virus (WNV) in 2012. The spike was related to a handful of urban environments in cities. Issues of impervious surfaces, poor drainage, and high degrees of dumping can create habitats for mosquitoes to breed easily.

Using the data available from the Improve Detroit (SeeClickFix) app, I estimated possible areas of risk due to high levels of dumping and blocked catch basins. The data is obviously limited by self-reported issues by residents, but it is well distributed and fairly robust for almost the entire city.

Map: Detroit Public Schools 2005

IMG_1470

There are many more dots on this map than there are today. Around 2005 was a time of financial mismanagement, scandal, and an uptick in students leaving public schools. Four years later Governor Jennifer Granholm appointed Robert Bobb as Emergency Financial Manager for Detroit Public Schools.

The superintendent listed on the map, William Coleman III, was removed in 2007 after being indicted on charges of money laundering and bribery with millions of dollars in tech contracts at Dallas Public Schools. Most recently, he was involved in a 2016 Michigan Department of Education investigation of the charter, Detroit Community Schools for staffing unlicensed administrators.

Map: Detroit Bike Network Analysis Score

Screen Shot 2017-06-16 at 7.50.09 AM

The national advocacy group, People for Bikes, has created a walkscore style of scoring for bicycle infrastructure and access to amenities. Detroit does not rank well at 26 out of 100 points.

Major caveat here is that the analysis is based on OpenStreetMap data, which is sadly not robust for Detroit (Create a free account and help add data!). Things like bike lanes, speed limits, and other key data points are missing for much of the city.

Detroit is making great progress in bicycle infrastructure, but we need to do a better job of getting our data out there to show it!

Map: Health Professional Shortages in Detroit

HPSA-PopPerSqMi-2

Detroit’s decades of decline and loss (population, industry, retail, etc.) also needs to include the loss of health professionals. Many left the city to follow population, others left out of fear, and many could no longer run a financial sustainable practice amid the decline.

The Health Resources and Services Administration (HRSA) defines shortage areas geographically, population-based, and facility-based:

Health Professional Shortage Areas (HPSAs) are designations that indicate health care provider shortages in:

  • Primary care;
  • Dental health; or
  • Mental health

The areas excluded generally fall within the service areas of Detroit’s major hospitals: DMC Harper-Hutzel & Children’s Hospital, DMC Sinai-Grace, and St. John Providence.

Map: Michigan Avenue Community Organizations 1982

MACO-groups

Last year I was contacted by Maryanne Dunmire who had formerly been involved with the Michigan Avenue Community Organizations (MACO):

Back in the mid to late 1970s, I lived in southwest Detroit, in an area that identified itself as the Michigan Avenue Community Organization (MACO). During that period of time the organization developed a plan for the neighborhood and published a Revitalization Plan in 1982.

She shared a copy of  the 153 page report that includes numerous current community leaders and extensive surveying and analysis. Part of their effort was also to petition the city government to follow their new standard format for data sharing.

Map: Detroit International Exposition 1890

Delray-Maps-1890-2

This map overlay is from Digging Detroit‘s historical dive into Detroit’s own world fair of sorts. The city was at the forefront of many industries and products from Detroit were already being mass produced and widely distributed. In 1890, Detroit used 156 acres in Delray, south of Fort Wayne, as the Exposition Grounds.

From Digging Detroit:

Detroit was not only the largest producer of heating and cooking stoves, it was also on the forefront of ship building, rail car manufacturing, cigar production and development of cutting edge pharmaceuticals. Detroit was also on the verge of launching a bustling automotive industry but at this point factories were being constructed to design and build gasoline engines.


Map: New Center Master Plan 1978

Screen Shot 2017-05-24 at 7.28.55 AM

This map caught my eye in the “Preservation News, Volume 18, No. 11, 1 November 1978.” The effort seemed very similar to the recently announced project in Cody-Rouge with DTE, GM, and Quicken.

“General Motors Corporation announced in September a four-year, $20 million joint private and public effort to revitalize the six-block New Center neighborhood adjacent to its world headquarters building in Detroit. […] The balance of the $2.6 million needed to purchase 125 houses and 175 apartments will come from 15 other Detroit firms.

The houses will be renovated for approximately $23,500 each and sold for $40,000–about half the price of a similar sized house in the suburbs. The original owners will have the first option to repurchase their homes. […]”


Braille Map of Detroit

Screen Shot 2017-05-19 at 7.21.03 AM

If you’re familiar with ASCII, Michael Straßburger created the geographic implementation this year. The result is a fully navigable text-based map of the world that could be printed as raised characters.

MapSCII is a Braille & ASCII map renderer for your console – enter => telnet mapscii.me <= on Mac and Linux, connect with PuTTY if you’re using Windows.

Map: Medically Underserved Areas of Detroit

MUAP-map

The Medically Underserved Areas/Populations (MUA/P) designations are based on the Index of Medical Underservice (IMU) from the Health Resources and Services Administration (HRSA). IMU is calculated based on four criteria:

  • Population to provider ratio;
  • Percent of the population below the federal poverty level;
  • Percent of the population over age 65; and
  • Infant mortality rate.

Most licensed physicians in Detroit are located at one of the three major health system hospitals which leaves an absence of primary care and family doctors in nearly all of Detroit’s neighborhoods. Areas well covered by hospitals also highlight due to high infant mortality rates such as 48201 (Detroit Medical Center) and 48202 (Henry Ford Hospital).

Map: Cityscape Model of Paradise Valley 1950

I happened to visit Dilla’s Delights for a quick coffee refuel while Downtown and was pleasantly surprised to have a historical streetscape popping out of the wall. The model is credited to an architectural design course at Lawrence Technological University in 1994.

The model marks important venues in 1950s Paradise Valley although it should be noted that historically, Paradise Valley reached further north up to Kirby Street.