Detroit Metrorail Map

detroitmt

This Detroit transit fantasy map has absolutely no geographic accuracy, but is quite comprehensive in its scope and connectivity of the metro Detroit region. The rail lines reach all the way to Auburn Hills and  include Selfridge, Kensington, White Lake, and Ann Arbor.

“Detroit’s roads are lacking, urban sprawl is out of control, the inner city is fledgling, the state budget and Detroit budget are in crisis, pollution is still a concern, people spend hours in backups, and yet, politicians do nothing. Why? I’m not one to ask to speculate, but I am one to try to come up with a solution. Polls in recent years have said the same thing time and time again, the people of the Detroit region want better mass transit. Not only would it ease a clogged road system tied down to millions of spending for repair and upgrade, but it would also introduce more commerce to areas that only currently serve a majority of neighborhood residents. Just think about it, being able to go to the big game or show without leaving hours in advance due to traffic backups, having a more reliable way to work and be able to access new areas that weren’t open before to serious job inquiries. It’s time to stop dreaming and start doing.” – BT

Detroit Urbanization Expansion Map

Screen Shot 2014-02-22 at 6.44.03 PMFrom the 1970 “Master Plan for Ford Properties” the expansion of sprawl was predicted and mapped before it reached its full extent. Others have already talked about how the “center” of jobs has shifted from Wayne County to Oakland County, this map provides an interesting perspective on the process of “urbanization.”

Map: Radical railbanking for Detroit

Big-map1

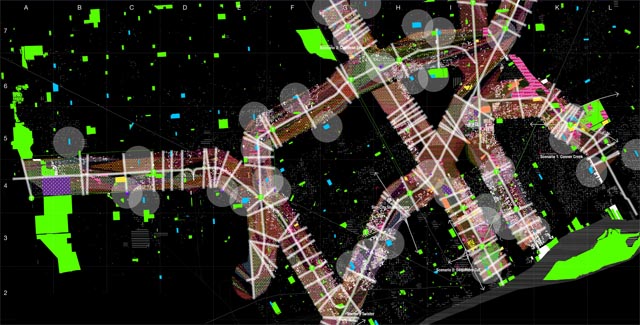
I came across this alternative use of mapping/ GIS data and was surprised by what I found. Beyond the psychedelic visuals, I found the idea of “railbanking” to be quite interesting and not beyond what many others have attempted to do with projects like Rails-to-Trails and the Detroit Greenways. This representation of railbanking takes it to a whole new level.

“This project hijacks and radicalizes the tactics of railbanking by manipulating geodemography through the productive misuse of conventional GIS software. In doing so, the project attempts to locate a constructive position relative to the hegemony of market segmentation geodemography from which the architect can operate.”

Read more from author McClain Clutter (now at the University of Michigan). . .

legend4

Map: Tour De Hood cycles across Detroit

tdh

A disparagingly named series of bike rides originating in Grosse Pointe covered nearly the entire city. Rides were based on major roadways: following Grand River, Outer Drive, etc. You can see the common entry roadway was along E. Jefferson Ave and routes are more dense Downtown where the rides would stop for food and drinks. The organizer, Arthur Miller, spent a good amount of time taking picture to document the various areas of Detroit. His photos have captured some excellent Detroit painted typography as well as massive pot holes.

Now there are a plethora of organized bike rides around the city: Critical Mass, Criterium, Tour de Troit, Slow Roll, Bike Detroit, Wheelhouse Detroit, etc.

Map: Six Growth Corridors in Detroit 1970

Screen Shot 2014-02-22 at 6.35.44 PMThis map also comes from the “Master Plan for Ford Properties” created in 1970. Ford recognized the importance of Detroit as a hub for goods and the need to adequate transportation. Here is an explanatory excerpt:

Historically, Detroit owes its existence and its importance to water transport and a plentiful supply of natural resources. Its modern growth has been largely dependent upon manufacturing, especially manufacturing associated with many different means of transportation.

The Pullman car works were first established there and continued in operation until 1893. The first freight car works were established in 1853. In 1902 these two industries employed employed 7,200 men.

Detroit’s geographical situation led to the construction of small and large vessels for lake traffic, which commenced in 1852 and has continued to the present day. […]

Detroit’s Logical Grid Map: One Square Miles

logical-grid-detroit


Mayoral candidate Benny Napolean, former Police Chief of Detroit, developed a “one square mile” plan for improving Detroit. His campaign tagline was “Together, transforming every neighborhood, one square mile at a time.” Although Napolean did not win, the idea wasn’t bad: bringing a community focused effort that defined the Detroit mayoral race. This map was created to demonstrate how his plan could work for better community policing.

Looks a little similar to the Microhoods used in the recent parcel survey, Motor City Mapping project.

How logical do you think these grids are?

Map: Detroit Block Vacancy Rate 2009

BlockVacancyRate_linnRob Linn had some “Ruminations on Right-sizing Part I” and utilized data from a massive survey similar to the recent Motor City Mapping Project. Here is a snippet from his blog:

According to the Detroit Residential Parcel Survey data, 10,683 of the city’s 32,913 blocks are comprised of at least 25% vacant lots.
Why isn’t this data in an open and downloadable format? The online viewer is helpful, but this data should be released.

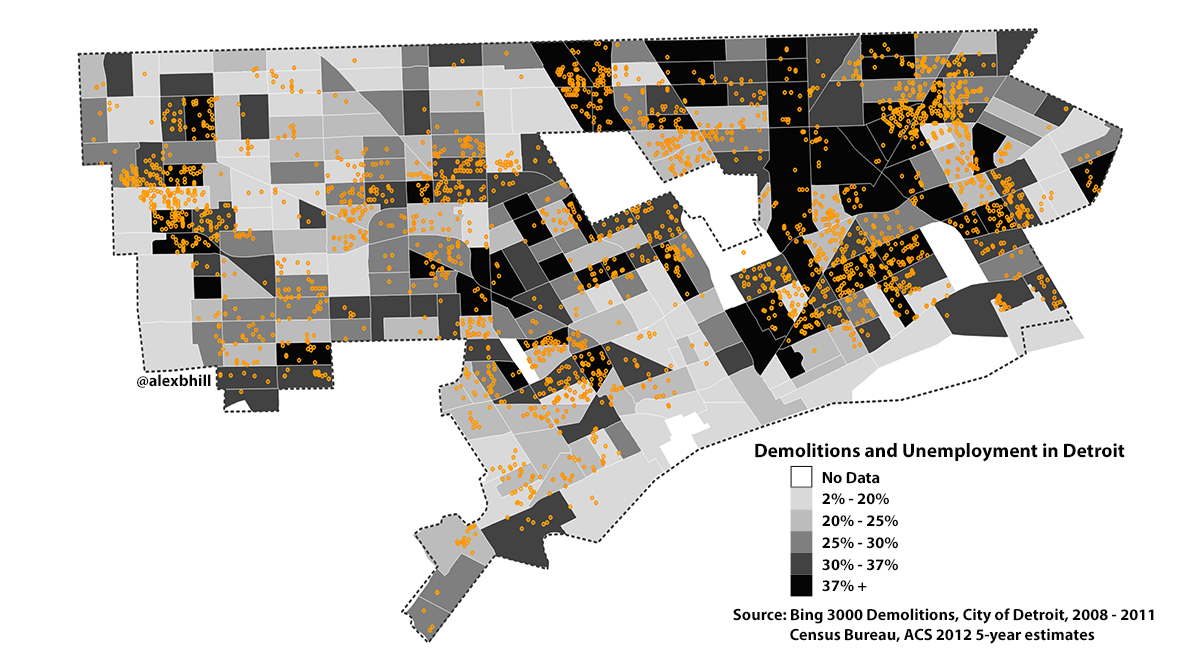
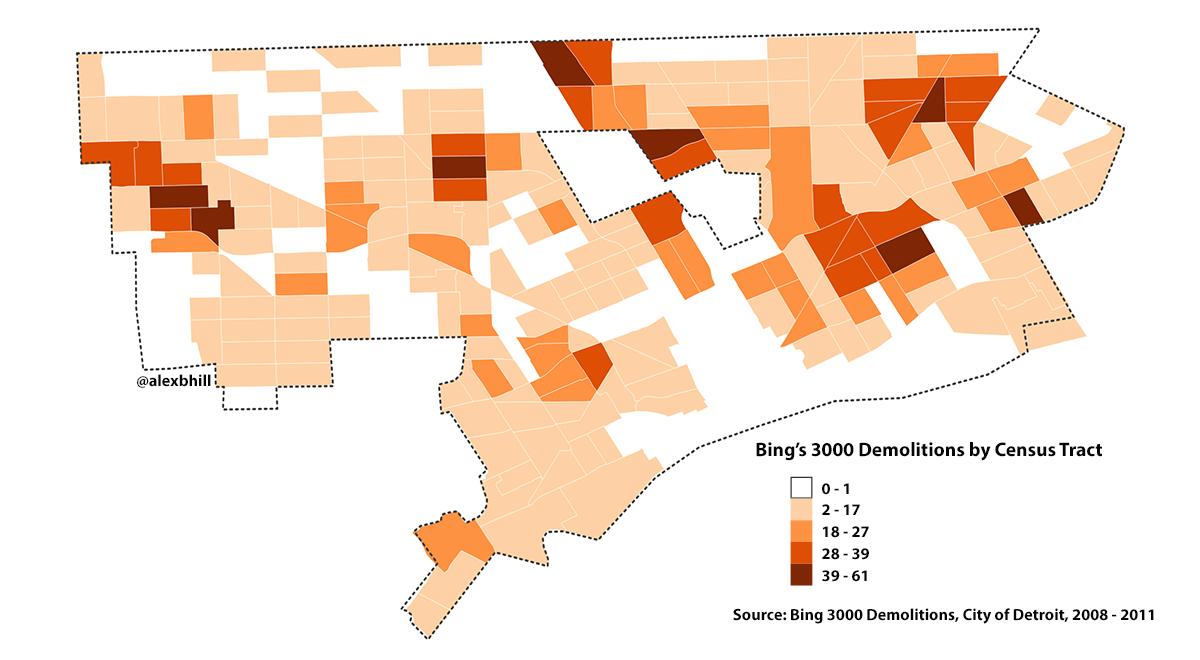
Map: Blight, Demolitions, and Unemployment

Mayor Duggan’s ten-point plan for Detroit lays out an urban planner’s approach to remaking a city. It lacks, however, any real economic plans that are necessary for breathing new life into neighborhoods where unemployment reaches over 30% in some areas of the city.

Mayor Bing had pledged in his term of office to demolish 10,000 blighted structures. The numbers aren’t out yet, but Bing’s team says it was a success. The Detroit Residential Parcel Survey on 2009 noted that 86% of homes in Detroit were in livable condition and only 9% or 3,480 needed to be demolished. Bing’s administration reported that 8,966 structures had completed the demolition process as of the close of 2013.

What other 5,486 structures did Bing demolish and what new properties are Duggan/Gilbert (private and foundation supported “Blight Authority”) planning to demolish based on the $1.5 million Motor City Mapping blight survey? Is it all part of Duggan’s efforts to incentivize people to move to more populated areas (right-sizing Detroit)?

Employment in Detroit has followed a downward trend since automobile companies left the city starting in the 1950s. Recent jobs added to the city have largely come in the form of relocated offices rather than new employment opportunities for Detroit residents.

Why can’t Detroiters be offered job training in demolition and construction to both improve their neighborhoods and help Detroit rebuild? Where are the incentives for residents to maintain and improve their homes instead of continuing to turn a blind eye to vicious landlords and blight hoarders? If Detroit’s neighborhoods are going to improve than Duggan needs to consider long-term employment opportunities for residents.

At Duggan’s swearing in ceremony he mentioned that he is bringing together individuals and groups who are tackling blight in order to improve the Detroit Land Bank so that delinquent property owners can be sued and dangerous properties can be demolished. Duggan praised Gilbert’s efforts as part of the Blight Authority, but hasn’t yet made any specific plans or goals for his administration besides stating that reducing blight is a priority.

Anyone have access to the full list of demolitions under Bing?

 —-

Thanks to Nick Micinski for help with brainstorming this piece.

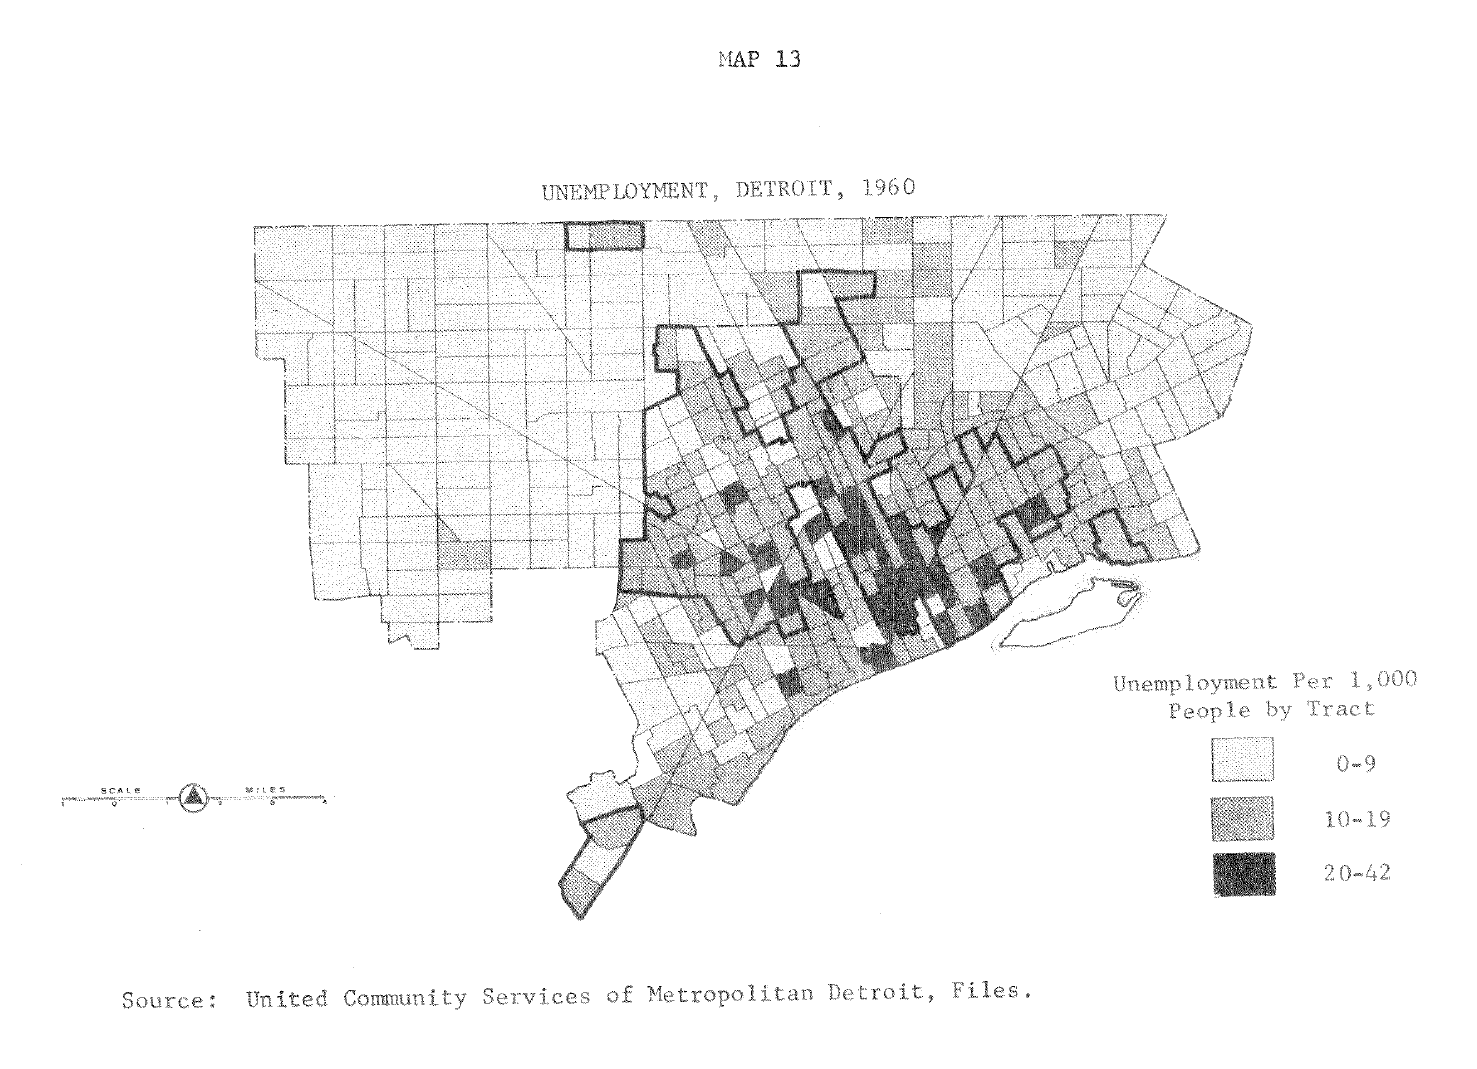
Map: Unemployment in Detroit 1960

unemployment1960

Unemployment in Detroit in 1960 was focused within Detroit’s black population. The continued auto company layoffs and discrimination in hiring practices disproportionately affected the black population.

From the Detroit Geographic Expedition and Institute Field Notes I.

Detroit Regional Mass Transit Map 2011

DetroitMobiliDMap

Yes, another fantasy map of regional transit in Detroit comes from John Good, who grew up near Detroit.

This time, as opposed to truly dreaming about what Detroit transit could be as we saw in the Jackson Woods’ Detroit Metro Transit map, John builds on the work that is currently being done to upgrade and improve regional transit such as: the M-1 LRT along Woodward Ave., tri-county BRT route between Macmob County, and other pieces from the 2008 “Detroit Regional Mass Transit” (PDF) plan from SEMCOG.

Two immediate thoughts:

  1. Why stop the route yellow line at the Airport? The commuter rail plan is to extend to Ann Arbor and reach the Detroit Amtrak station (not Campus Martius).
  2. Where is the connector between The Villages and Grosse Pointe?

Map: Homelessness in Detroit 2011

DET_homeless

Homelessness is a common idea of Detroit that many people hold, but what does the data really show? The Homeless Action Network of Detroit (also serving Highland Park and Hamtramck) publishes an annual report based on the people that they have worked with throughout the year. The best metric that they have is of individuals who report being homeless and the zipcode of their last residence. The vast majority of individuals that HAN Detroit sees have been homeless more than once and most for more than 2 years. Counting a population of homeless individuals will never be accurate or easy. This is just one example of an organization that works with 74 member organizations across the city and likely has a pretty good dataset.

What is most surprising about this data is that “eviction” and “no affordable housing” were the top 2 reasons for homelessness. The concentration of the most people reporting homelessness followed the Woodward corridor. I’m not sure if there is any real correlation there, but it isn’t surprising that a main area for renewed economic development would potentially be causing an increase in homelessness.

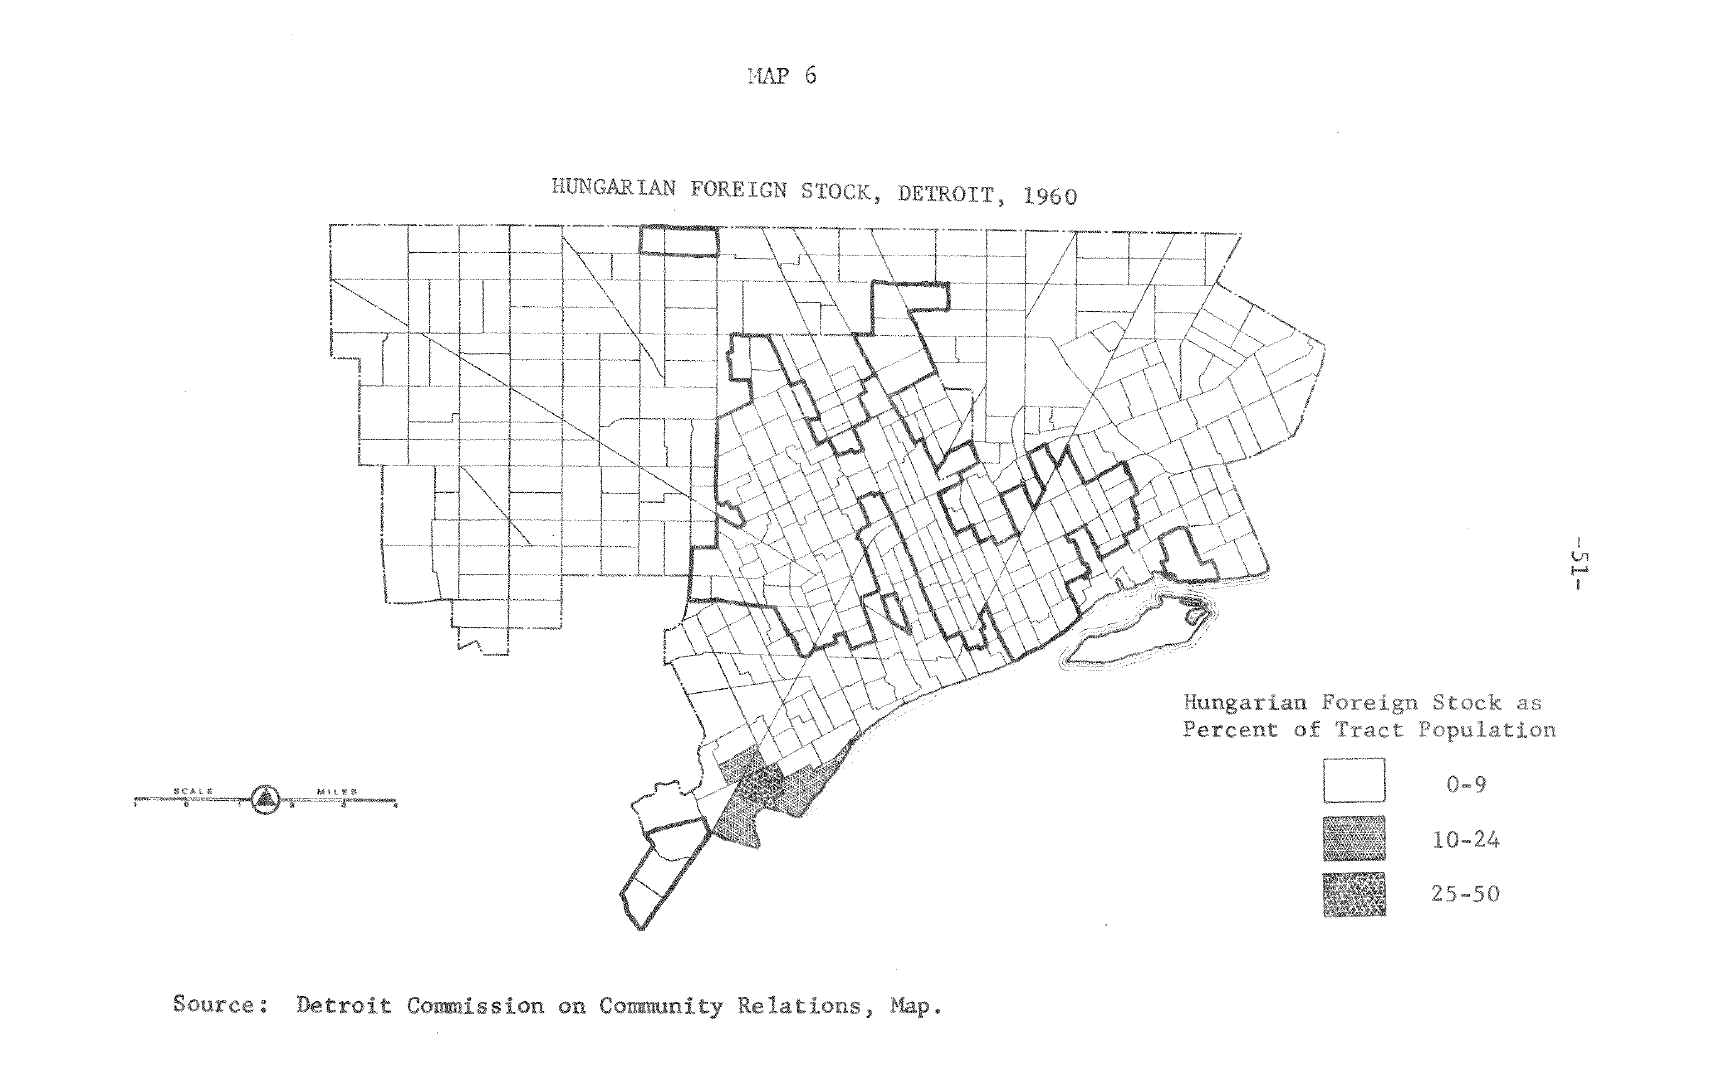
Map: Hungarian Foreign Population 1960

hungarian_1960

This map comes from Field Notes I of the Detroit Geographic and Expedition Institute.

I only recently learned more about the significance of the Hungarian population’s concentration in Southwest Detroit from the Old Delray Project. Delray was at times was called “Hunkytown” or “Little Hungry” due to the strength of this cultural population.

“A lot of residents call their neighborhood “Death Valley.” They complain about the huge trucks that rumble down the streets from Zug Island and other nearby industrial sites.
They recall fondly the great Hungarian Fancy Pastry bakery shop where you could get rum and walnut tortes. But the bakery moved to Allen Park. And the trucks keep running. And the factories that remain keep belching soot and grime across the aging, dilapidated buildings that once made Delray a place where people yearned to live.”

Delray was at one time its own incorporated village before being annexed by Detroit in 1906. The area used to be known as Belgrade, but Augustus D. Burdeno returned from the Mexican-American War in 1851 and convinced the residents to rename it after a village he had passed through in Mexico called “Del Ray.” The historic Fort Wayne is located in the northeastern corner of the area Zug Island is not far off.

This is the neighborhood where the new Detroit River International Crossing is planned to demolish most of the historic and blighted buildings.

Anyone ever visit Szabo’s Hungarian Meat Market or Kovacs Bar (closed 2011)?

Detroit Traffic Survey Map 1936-1937

det-traffic-

Detroit Traffic Survey 1936-1937: Mass Transportation Passenger Flow During General Traffic Peak Hours, 5pm to 6pm

Thanks to redditor DetroitStalker for posting this great map!

This map uses a very innovative visualization method with the increasingly wide or narrow pathways of traffic. The method has become popular again with transit planners (see GraphServer). This map is pre-expressways, so you can see the importance of Detroit spoke streets and public transit system. Great use of data visualization in the 1930s to understand traffic flows on the street railways.

Detroit Macrohoods Map

blight6-edit

Data Driven Detroit and Loveland Technologies developed microhoods and macrohoods as part of the Motor City Mapping project funded by the Detroit Blight Taskforce. This map has been on the wall at “Mission Control” where surveyors and staff have been buzzing around for the last few months capturing every land parcel in the city with a picture and status update.

Detroit Building Age Map

det-building-age

View the full interactive version HERE

Loveland Technologies has been making waves and their most recent Detroit data visualization of “Detroit building age” only adds to the awesomeness. The map reminds me of other great building visualizations from Brklynr of Brooklyn buildings block-by-block and the Waag Society similar project of Amsterdam. Now Detroit is as much or possibly even cooler than Brooklyn and Amsterdam, right?

Not all the data is quite right, but that is why feedback is important in map making.

Map: 21 Homes of Gwendolyn Warren, Detroit

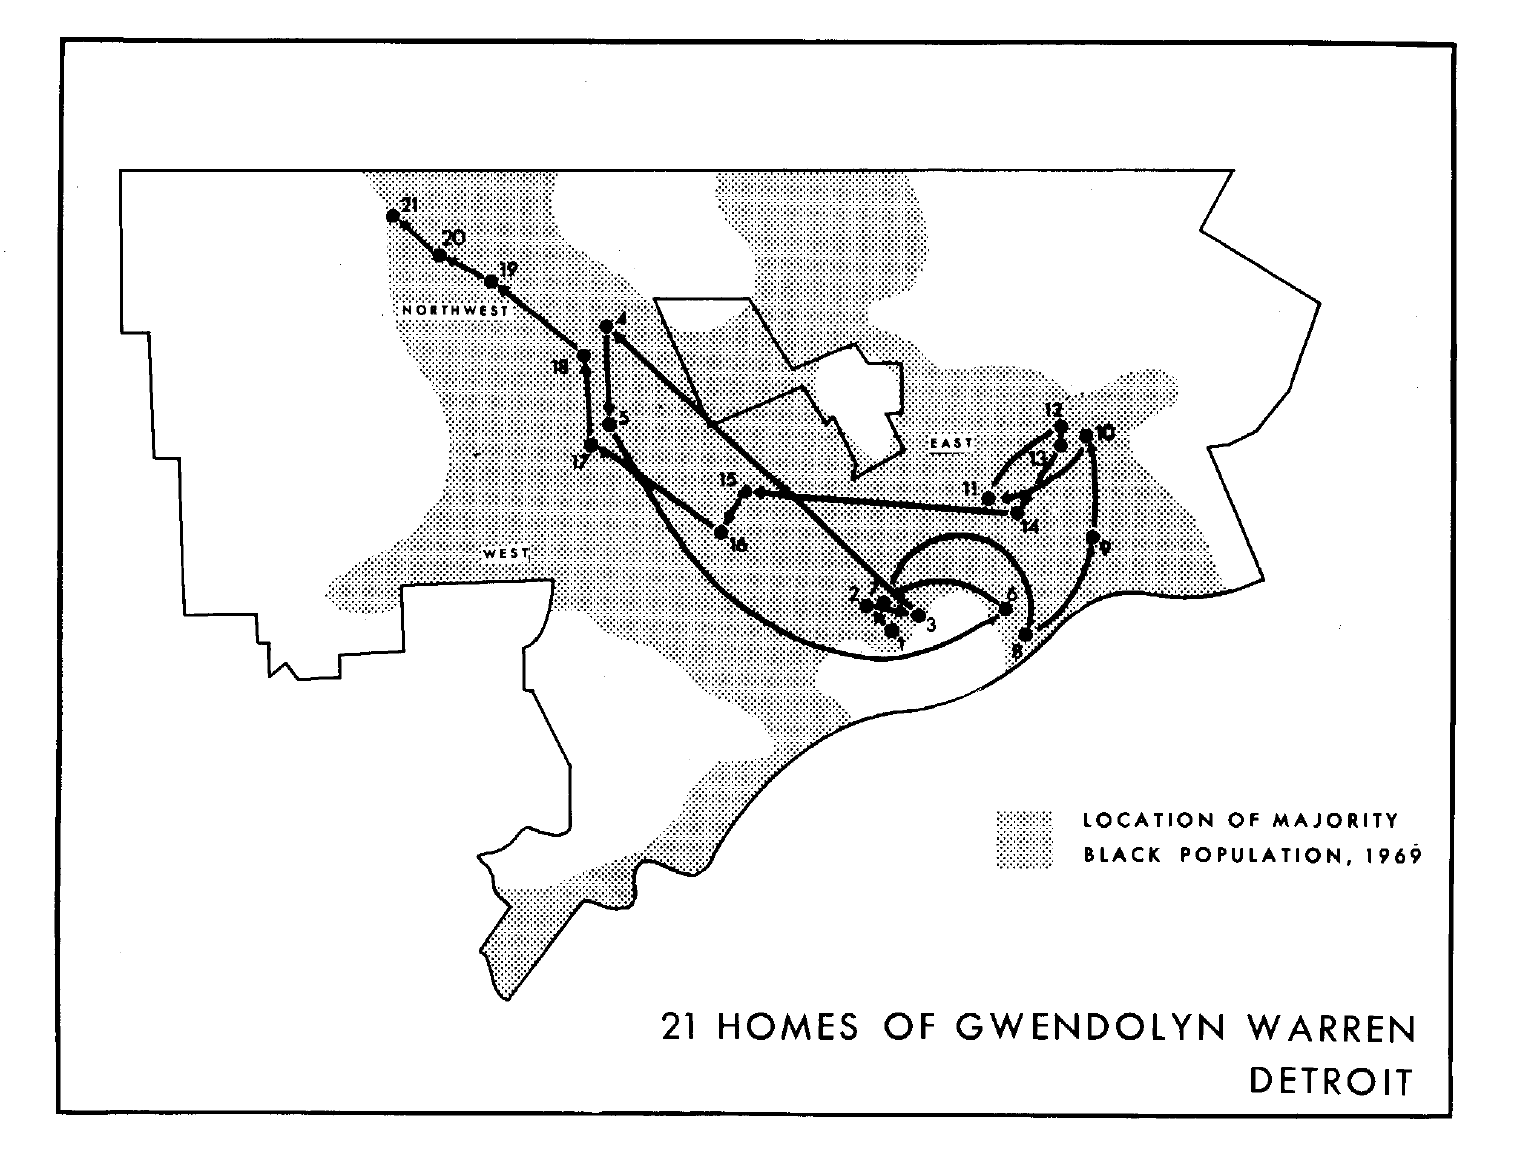
gwendolyn_warren_homesGwendolyn Warren was co-Director of the Detroit Geographic and Expedition Institute (DGEI) and added a wealth of information to the Field Notes III discussion paper. She had formerly led a youth group in the Fitzgerald neighborhood and met the DGEI with strong opposition before starting to work with them and eventually author a significant portion of the third discussion paper based on her experiences.

Map of Bicycle Crashes in Detroit 2005-2009

detbikecrash05-09

There have been a few recent calls for better data or even real time data on bicycle crashes. Detroit has been adding many bike lanes, shared lanes, and greenways over the last few years. This map may help identify where some unmet needs could benefit from bike lanes or buffered bike lanes. Key hotspots in Detroit are Midtown around Warren Ave. and Wayne State University’s campus as well as Northeast along Gratiot, specifically at the corner of Gratiot and McNichols. Hamtramck represents an interest cluster. I’m not sure if that represents better bike crash reporting in the smaller municipality, or if just more people are biking there? There is also a cluster Downtown, which could be interesting to see in the future as development increases Downtown and Woodward corridor walkability is targeted along with the M1 Rail.

Additional exciting news is the plan for buffered bike lanes on East Jefferson!

detroitdata_get

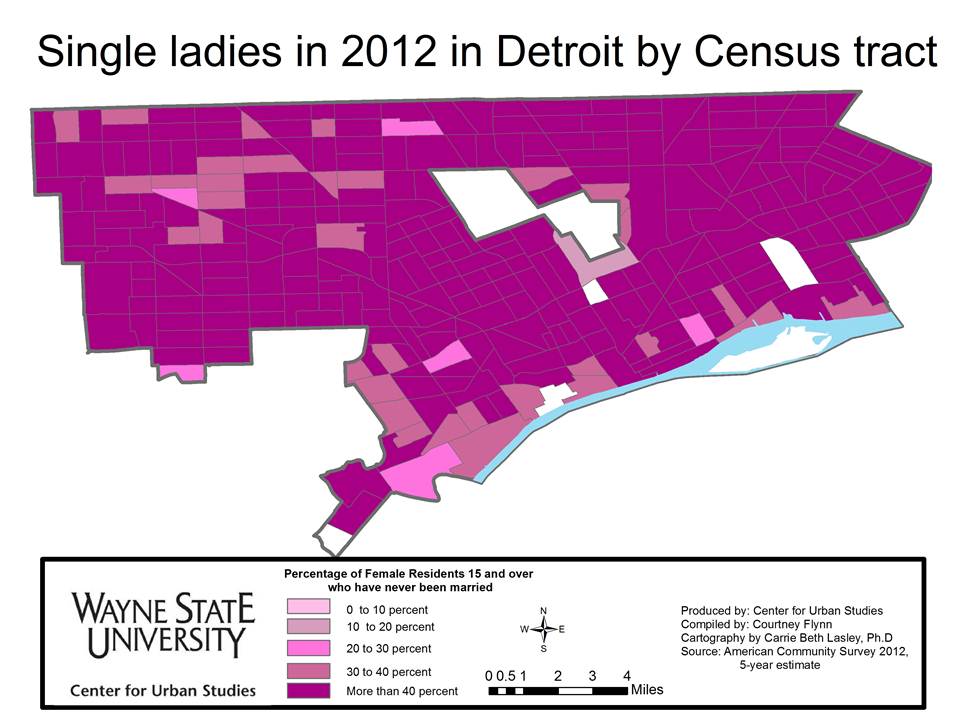
Map of all the Single Ladies in Detroit

single-ladies-detroit

The Center for Urban Studies has put together an interesting piece over at their Drawing Detroit blog. In the name of Valentine’s Day they have utilized the Census Bureau’s data on single people.

“Singlehood in Ann Arbor and Detroit is quite popular, according to data provided by the 2012 American Community Survey. When comparing the City of Detroit to the other municipalities that make up the seven-county region, Detroit was one of only four municipalities where over 40 percent of females 15 and older have never been married.”

Read more at Drawing Detroit. . .

Map: Mexican Foreign Population 1960

mexican_foreign

I was surprised to find that Southwest Detroit has a longer history of Mexican migration than I had ever thought. This map was part of the Field Notes I from the Detroit Geographic and Expedition Institute. The bold line surrounds areas of black population majority in the city.

Map: One Detroit

7_Title_One_Detroit

Francis Grunow ponders on Model D about regional cooperation and efficiency. Important identity questions that match up with the definition of Detroit through our “100 Maps of Detroit” piece. There is a larger question here, but one that is critical to the future of Detroit and Michigan as a whole: “can we recognize and move past our troubled history to make Detroit better for everyone?”

“Of all the things I might change about Detroit, if I could choose just one, I would settle the question of what it means to be “from Detroit.” Of course this question is a powder keg. Identity, class, race and politics all get tied up in a pretty sticky wicket. On the one hand, it’s easy. Historically, Detroit is a pretty well defined place, growing in stages since its founding in 1701, and today, “Belle Isle to 8 Mile,” as a recent guidebook so simply suggests, is straightforward enough. You’re either from here, or not.

But, by turns, Detroit is also, equally, a state of mind, a badge of honor, and a curse for some — far too many, unfortunately. The thing is, Detroit could have had a wholly different history. It may have grown and expanded in much the same way it did, but in another version, the city would have also annexed the communities around it as it grew, and as it had done for most of its history.

[…] To see what One Detroit might look like, I did a little experiment of my own. Using the household size map as a base, and the free (but frustrating) open source GNU Image Manipulation Program, or GIMP, for short, I was able to create a new map of One Detroit, in a few easy steps.”

Ford Rapid Transit Plan Map 1970

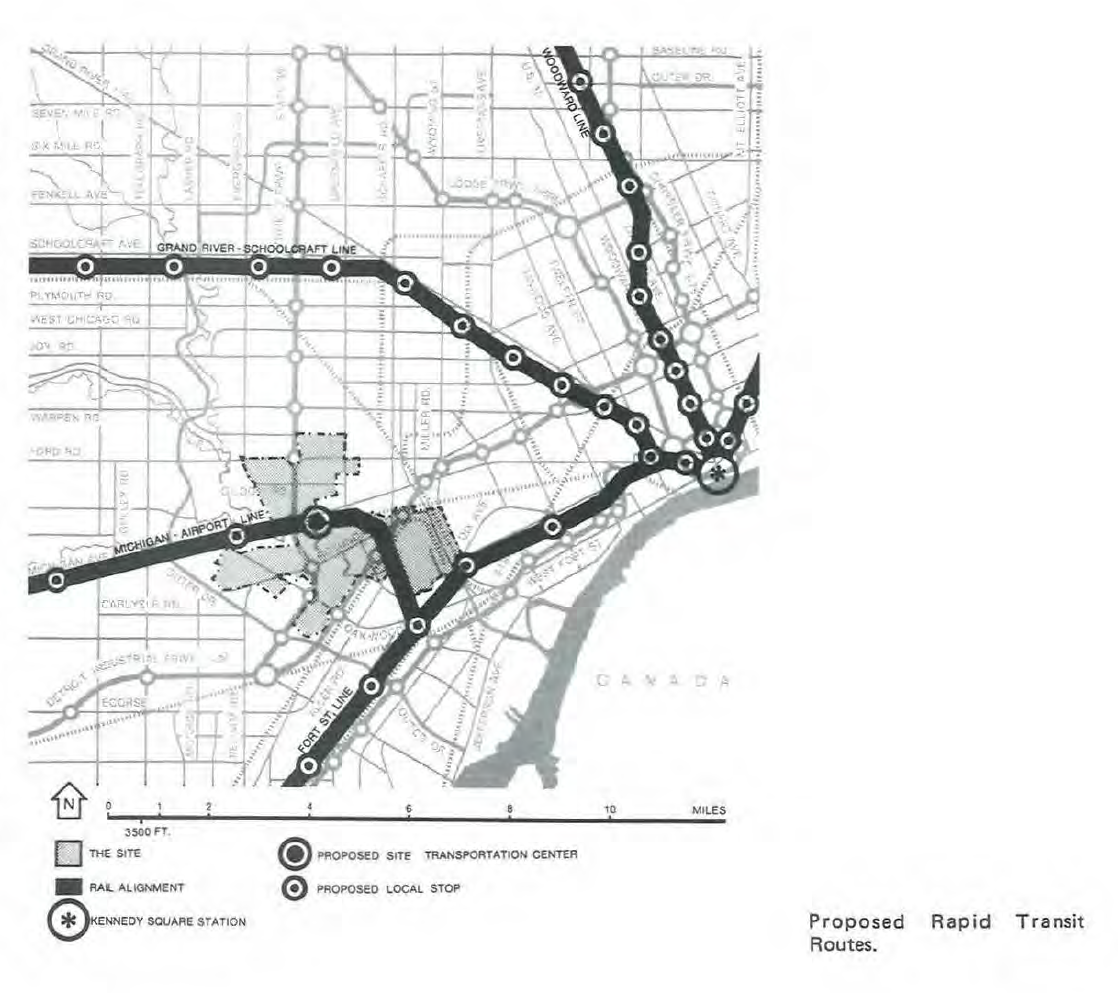
Ford_transit_planEven Ford Motor Company wasn’t beyond fantasizing about regional rapid transit and recognized the crucial role for rail rapid transit in the growing metro Detroit region. In the 1970 report, “Master Plan for Ford Properties” by William L. Pereira & Associates, an 81-mile rapid transit plan is laid out according to the TALUS study. At this time, supposedly a commuter line (2 trains per day) was already running between Pontiac and Detroit. The main lines important for Ford were:

Grand River-Schoolcraft Line

“[…] conveniently located for the low-income low-auto-ownership residents of the area. Six more stations serve an estensive residential corridor of about eight miles lying directly north of the site. In a second phase, the line would continue to Merriman Road […]”

Michigan-Airport Line

“[…] this line on the system originates in the Central Business District running in subway under Michigan Avenue to the Lodge Freeway and sharing some stations with the Grand River-Schoolcraft line in the CBD. […] In a second phase, the Michigan-Airport line continues along the Penn Central right-of-way, wit stations in West Dearborn and Inkster.”

The planners recognized that the feasibility and funding weren’t there for the comprehensive rapid transit system and so proposed an interim system that connected Downtown to the Metro Airport due to the expected population increase in that general area of Wayne County. This sounds much like the commuter rail development that SEMCOG is trying to establish between Ann Arbor and Detroit, over 40 years in the making.

The report closes, noting that “[…] all large scale development in the future must take into account the possibility of rapid transit.”