Map of Detroit’s Black Population 1940 – 1970

BlackPop1940-1970

Detroit’s African American population has followed interesting migration patterns throughout the years. These are a series of maps that help demonstrate how people moved around the city as a result of changing racial attitudes, a growing black middle class, as well as shifting demographics from economic downturn. Paradise Valley can be easily seen in 1940 while it isn’t until later that we see other prominent black neighborhoods emerge to the West of Cass Corridor.

Still trying to track down a source, please leave a comment if you know.

Update 11/15/13

Thanks Matt Baker! These maps appear between pages 183 and 188.

Sugrue, T. J. (2005). The origins of the urban crisis: Race and inequality in postwar Detroit. Princeton University Press.

Map: Detroit Election Wards and Black Population 1915

bunge_black_electionwards_1915

This map comes from a 1926 report “The Negro in Detroit” by the Detroit Bureau of Governmental Research, Inc. The map provides an historical representation of the limited geographic footprint of Black residents as well as the Black Bottom/ Paradise Valley neighborhood. This map helps to show the base for the racial/political evolution of Detroit.

Map: Public Lighting in Detroit

publiclightingmap

Charlie LeDuff recently reported on the public lighting system and how it hasn’t seen investments in the last 40 years. He discovered that the last time that street lights were mapped was on this 1960s era map with pushpins. Incredible that in 2013 the mapping system is so archaic.

publiclightingmap2

In September, it was also reported that Detroit was conducting a comprehensive GPS light pole audit in a handful of focused zones. The goal is to map 6,600 of the 88,000 street lights in Detroit and then devise a plan to improve the system. Hopefully this street light data collected will be open to the public.

Map: Borders of Detroit

detroit_border

Detroit is bordered by 20 municipalities and 1 river. The Detroit River has the longest border with the city followed by the City of Dearborn. I thought this would be an interesting way to visualize the different borders inside and outside the city without being technical and geospatial.

Edited 11/11/13: Eastpointe and Grosse Pointe added bringing total to 20 municipalities, “Twp.” added to Royal Oak

Map: Race, Voting, and High School Districts in Detroit

bunge_highschool_districts

This map comes out of Field Notes II from the Detroit Geographical Expedition Institute and William Bunge. It is a representation of the number of black and white students compared to the number of black and white voters. The DGEI spent the entirety of Field Notes II running statistics and creating maps to show the racial and power imbalance in Detroit’s education system. The premise was that the majority of black students were not being taught by a majority of black teachers or administrators, which led to lower educational achievement. The idea was that a “sympathetic authority” would enable black children; “the most abused children in America,” to be protected from getting gerrymandered into the lowest performing schools.

This is a very interesting tie in to the last decade of difficulties within Detroit’s public schools system. I have a feeling that the DGEI report was not taken into consideration.

DDOT System Map Redesign

DDoT System 09-2013(2)

The French graphic designer, Aurélien Boyer-Moraes first learned of Detroit as a teenager in the 1990s through a TV documentary about the Detroit electronic music scene (before the internet existed). He went on to study graphic design and with the advent of the internet was able to learn more about the City of Detroit. Aurélien has always been interested in mapping and currently works as a map maker in information design specifically on standards for transit systems. He has designed the subway, light rail, and BRT map for Lyon, France.

Detroit came naturally to my mind for a first attempt, as an exercise initially, during my graduate, because I was very disappointed by the actual map which is very poor designed, useless to speak plainly, very much a counterexample… Then after my master and with my professional skills growing along with my experience in that field I updated it  when I have some spare time to follow the system’s changes and my “own” graphics changes. That’s the story : a genuine interest in that city, a genuine interest in transit mapping!
Aurélien first designed this DDOT map as part of his Graduate studies, but has recently updated the map. Maybe someday the transit systems in Detroit will be worthy of his excellent design work.


Map: Color Coded Detroit Growth by Annexation


Manual Wayne County

This map makes the rounds of good looking Detroit maps. I’m not sure what year it is from, but looks like it is potential a picture taken of a book page?

EDIT 6/4/14: This map is included in the “Manual, County of Wayne, Michigan 1926” (available online) along with a series of nice color maps of Detroit and Wayne County.

See also, the animated Map of Detroit Land Annexation 1806 – 1926

Illuminated Satellite Map of Detroit

1074390_10151924578781575_1931591488_o

We are seeking out maps around town. This first one is pretty exciting. Shoot us a message or submit the cool map of Detroit in your office.

The Why Don’t We Own This (WDWOT) office has a new, incredible map of the city! It is a 6 foot by 4 foot back-lit high-res satellite map of Detroit. It is possible to see every rooftop and car perfectly. Jerry Paffendorf noted that he, “can’t stop staring at it.”

Map: Gaps Downtown in Detroit’s Urban Decline

detroit1

This diagram and map from Charles Waldheim (Stalking Detroit, Waldheim et al, 2001) of Downtown shows the growing gaps in downtown development over the years. They help to illustrate the reality of Detroit’s decline and the dispersion (sprawl).  Detroit’s “urban core” was critical to its early development from “frontier town” to city. Downtown became rife with poverty, drugs, and murder in the 1970s and 1980s – pictured aboce (1994) and from historical data the decade of the 1990s wasn’t much better. In a few years (2016)  it will be almost stunning to look back at the last 100 years of downtown Detroit and see how it rose and declined.

Boulevard, Avenue, Road, and Street in Detroit

detroit_roads

Over the last three years working as a community health worker in Detroit, I have logged over 80,000 miles on my tiny car with the majority of those miles being from getting around Detroit to meet with clients, families, and community events. After a while I became really interested in street naming.

I first saw this street name mapping idea from Bill Rankin’s work in Vancouver to the Derek Watkins applying a similar effort to the Portland – Seattle area. I was finally given my last push and decided to create this map after following Bostonography. The piece that took the longest was finding a good file of Detroit streets (finally acquired one from my GIS professor this summer).

In order to understand the layout of Detroit “streets” you really have to know Detroit’s history. The different groupings of “street” names shows the development of Detroit and its expansion over the years. Arthur Mullen of Cityscape has a great explanatory article, here are some highlights:

“In the immediate downtown area, the earlier French physical imprint was removed by the devastating fire of 1805. Nearly the entire small village was destroyed by that fire and the new territorial governor, Judge Augustus B. Woodward, decreed that the town would be reconstructed utilizing a grand urban grid based on a spoked wheel system […].”

“The French rectilinear grid was built off of their “ribbon farms” which was their method of dividing property near Detroit. These farms, usually ranging between 200 to 400 feet wide, stretched linearly inland for approximately three miles, thus the name. […] After the fire of 1805, the new Woodward grid was laid on top of the French property grid in only the central portion of downtown.”

“Eight Mile road became the Base Line for all of this surveying in the NW territories. (For your information – Eight Mile Road stretched across Lake Michigan becomes the border between Wisconsin and Illinois.) […] The outlaying parts of Detroit and the suburbs follow this true north south grid pattern as evidenced by our regions north-south and east-west mile roads. This explains why there are three basic grid systems in the City of Detroit. Their existence physically illuminates the early history of the city of Detroit.”

“Our Native American heritage is also evident in the physical layout of the city. Michigan Ave.– aka U.S. 12, Chicago Road, Sauk Trail — follows an old Native American trail used for trading to circumnavigate around the south shore of Lake Michigan. This earlier history is visible in the subtle twists the road makes as it nears Dearborn, and it becomes even more profound as you head west on the road.”

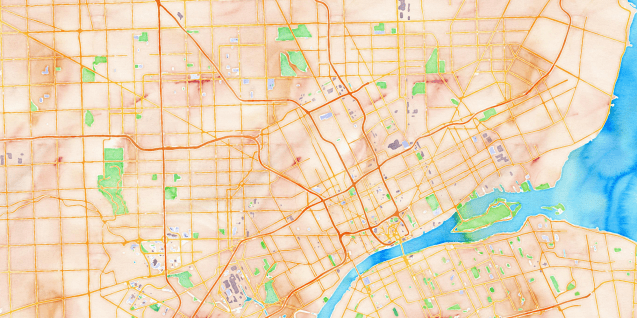
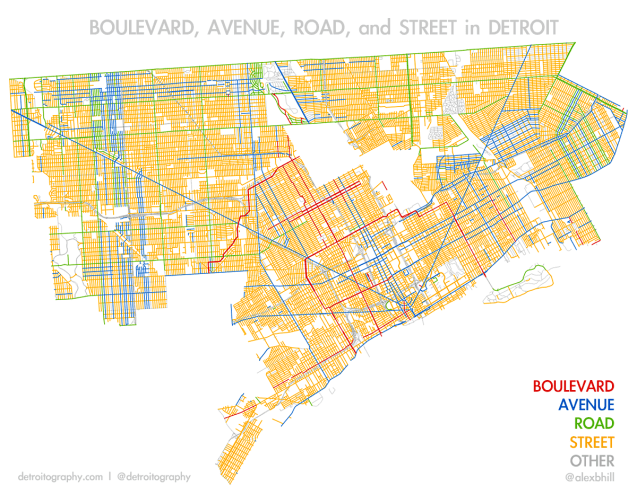
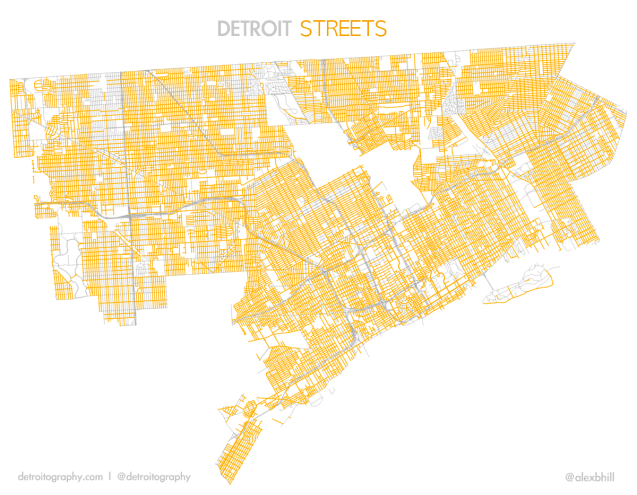
Maybe that was more than you wanted to know, but the history of Detroit gives incredible insight into its present day make up. As evidenced by all the orange in the map, the term “Street” was used widely in all three of Detroit’s street grid systems. It’s hard not to go anywhere in the city and not drive on a street.

detroit_streets

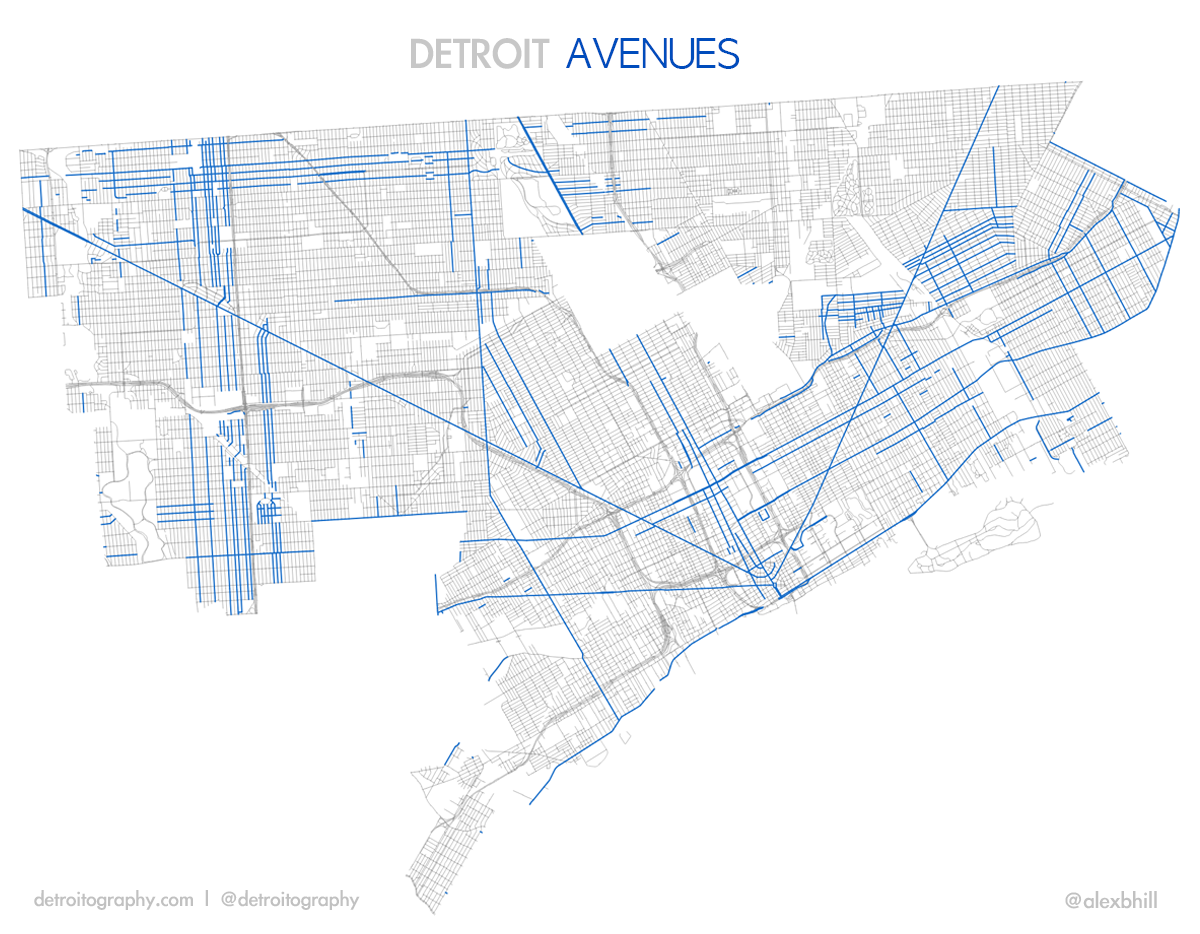
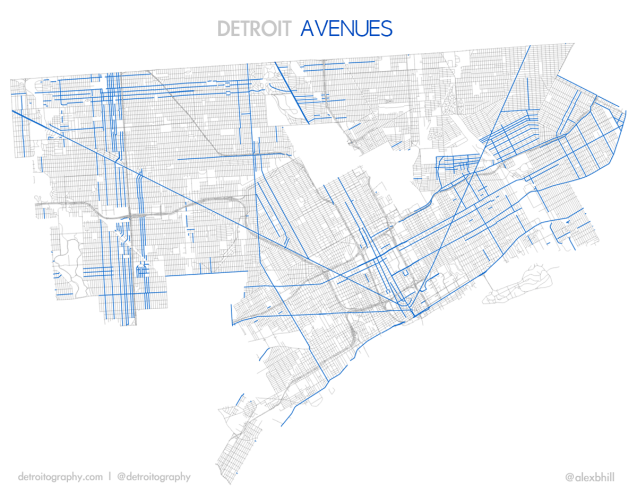
Detroit’s “Avenues” show the lasting impact of Detroit’s initial plan of 1806, Augustus Woodward’s hub-and-spoke grid plan. These Avenues are still important connectors to other Michigan cities and regions. It seems that “Avenues” also became popular again after official US control of Detroit, notably on the Westside and as important cross-city routes.

detroit_aves
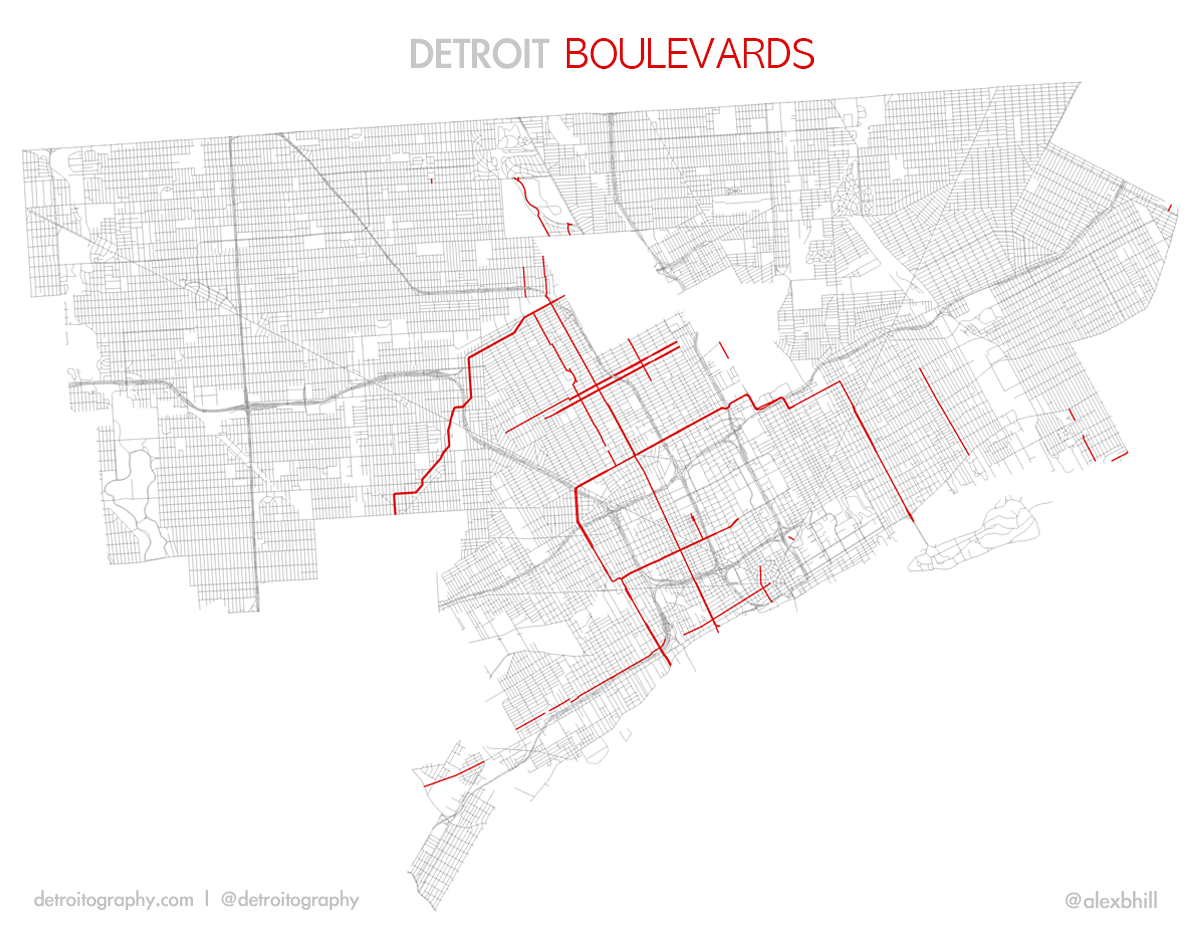
Boulevard’s aren’t the most widespread in Detroit, but they are some of the most prominent streets in Detroit’s history. The most recognizable “Boulevard” is Grand Boulevard, which at one point was one of the most prominent streets to build your house. Modeled after the French design, Grand Boulevard encompassed the outer limits of the city in 1913 and was decorated with beautiful landscaping.

detroit_blvds“Roads” in Detroit follow the convention of the true East-West Mile roads and North-South street naming after official US control of Detroit after 1837. It is easy to see that “Roads” are limited to the outer areas of the city, away from the city center.

detroit_roads1

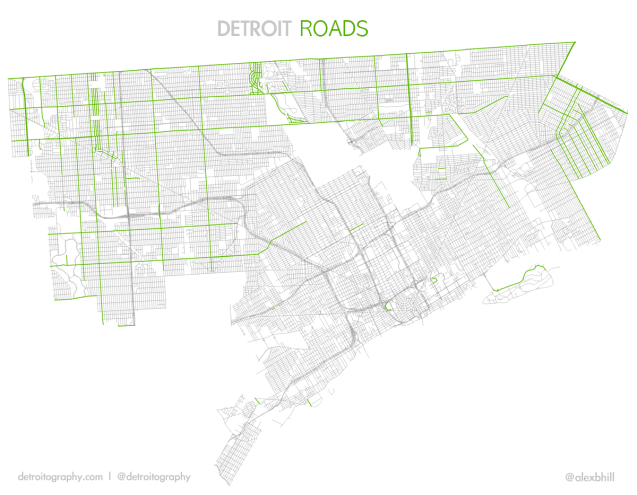
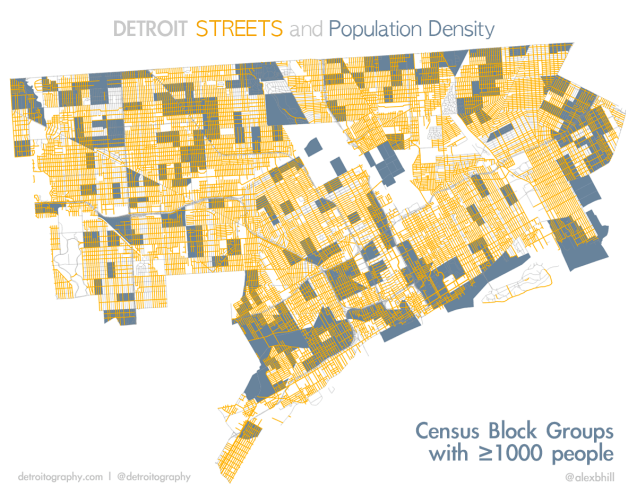
“Streets” and “Avenues” may be timeless as far as street naming in Detroit, but “Boulevards” and “Roads” reveal Detroit’s historical planning past. Depending on where you live in Detroit, there may be some street names that you never encounter – but everyone will live or drive on a “street” (from Census 2010 data, Social Explorer).

detroit_st_popdenSee also: Map of Detroit Land Annexation 1806 – 1926

Detroit Median Family Income Map 1965

bunge_medianfamilyincome_1965

From the Field Notes II of the Detroit Geographical Expedition Initiative with William Bunge, this map shows how downtown and Cass Corridor areas became impoverished and abandoned over the years. Now we see these areas as the primary focus of redevelopment. This is a good reminder of historical information allowing us to better understand present day developments.

Detroit Smallpox Map 1920

SmallpoxInDetroit1920

Published in the City Health Bulletin, May 1920 (Page 3) by George T. Palmer, Epidemiologist – this map shows how the first cases of smallpox were concentrated in the Black Bottom where the small black population resided. Since smallpox spreads easily by close contact and housing conditions in the Black Bottom were less than ideal, it is no wonder that the disease found easy vectors.

Epidemiologist Palmer notes that the “unprecedented influx of people to Detroit, combined with a woeful lack of suitable housing” causing overcrowding aided in the spread of disease by close contact.

The disease among the colored is confined largely to the unmarried adult male, from 20 to 50. This is mainly a roving population, living in rooming houses. Two-thirds of the colored cases have been in Detroit in less than a year. Never having been successfully vaccinated, this group furnishes a fertile field for smallpox once introduced.

Detroit Techno Pac-Man Map

p_4456

Canadian artist group, Price Budgets Boys have made a series of interpretations described as a mix of Piet Mondrian, Pac-Man and Boggie Woggie music. The videogame board consists of Piet Mondrian’s painting “Broadway Boogie Woogie” (1942-43), which in its turn is inspired by Manhattan’s street grid and boogie woogie music.

They created three versions after the initial NYC version: “Detroit Techno” (2005), “Tokyo Techno” (2006) and “Toronto Techno” (2006). The labyrinths in the new versions are created by stylized street grid from each city, executed in the style of Piet Mondrian.

See also: De Troit a la Mondrian – population change map in Piet Mondrian style

Detroit Future City Mini Maps & Open Data

Screen Shot 2013-10-13 at 11.47.12 PM

For the massive Detroit Future City report, piles and piles of data were compiled and aggregated from many different sources, yet only a small portion of this data is open to the public.

  • Hamilton Anderson – Land Use and Neighborhoods
  • Stoss Landscape Urbanism – Landscape, Ecology, Environment
  • Initiative for a Competitive Inner City – Economic Growth
  • Mass Economics – Economic Growth
  • Interface Studios – Economic Growth
  • Happold Consulting – City Systems
  • Center for Community Progress – Public Assets
  • Carlisle Wortman – Zoning
  • AECOM – Landscape, Ecology, Environment
  • Skidmore Owings & Merrill, LLP – Urban Design
  • HRA Advisors – Public Land

As Detroit changes and grows, I challenge these businesses and groups to open up their data and share it for the benefit of all of those living in Detroit, working in Detroit, and making steps to revitalize Detroit. Open data can only be a benefit to the city, its economic, and most importantly its people.

Map: Nonlocal Land Use in Detroit 1969

bunge_nonlocal_land_1969

This would be a really interesting map to replicate today if the data existed. There are plenty of interesting maps on privately owned land and largest land owners, but a more comprehensive picture would be cool to see. With the rise of the Wayne County auction and renting in key areas of the city I wonder how much of the city is owned by people living within the city limits.

This map from William Bunge’s Detroit Geographical Expedition Field Notes II on School Decentralization.

Map: Renovating Homes & Ponzi Schemes in Detroit

metro_property_renovate

Back in February, the Free Press covered Metro Property Groups great success at revitalizing Detroit homes.

Beydoun’s Metro Property Group, founded in 2009, is getting a lot of notice for its up-tempo approach to renovating distressed houses. Buying in bulk from a variety of sources, Metro Property Group renovates dozens of houses each month, renting them to qualified renters who may one day turn into home buyers.

Many individuals, nonprofits and companies renovate homes in the city, but Beydoun may be among the few doing it on an industrial scale, refurbishing around 60 houses each month. Each house gets a new hot-water tank and furnace; floors are buffed; kitchens and baths redone.

If you know much about their target areas highlighted in the map – these are areas of high crime, high poverty, and haven’t seen as much investment from foundations and non-profits. The story was too good to be true.

Late last month another story hit the presses, “Metro Property Group turns investors into “unwitting and unintentional slumlords.” The Metro Property Group is called the top buyer of distressed homes, which matches the Free Press’ “60 houses each month” stat. Baydoun (sp Beydoun) who is a Dearborn City Council candidate allegedly intimidated investors and falsified legal records in order to cover up the scam.

Detroit Streetcar Rail Map 1941

DSR-map_railservice-1941The Department of Street Railways (DSR) used to dominate Detroit’s roadways. The 1940s and 1950s were a time when public transportation was real in Detroit. Just check out the guy in the picture below (circa 1955) using a light up map to find his desired streetcar. The rise of the automobile industry is be credited with destroying the streetcar rail network as it pushed the adoption of it’s motor coach buses after World War II. During the war there was a need to conserve gasoline and rubber, so rail car was the preferred public transit option. By 1956, all streetcars had been converted to Ford motor coach buses.

The M1 Light Rail is now less of “light rail”and follows the streetcar model that can best be seen in Portland and Seattle. Hopefully future developments follow the main arteries as seen in the DSR map with streetcars running along Woodward, Gratiot, Grand River, Michigan Ave., Jefferson Ave., and Fort St. The most important consideration for future streetcar rail development should be on commuter flows.

DSR-ServRobotInformationMachine_1955

Map: Where will the new Neighborhood Police Officers program focus?

dpdcraig

Detroit Police Chief James Craig has made a lot of big changes since taking the position on July 1st. There have been a number of senior staffing shake-ups as well as a shift to getting more patrol officers on the street.

This last Saturday, October 5th, at his “Call to Action” attended by almost 400 Detroit residents, Craig announced that the new Neighborhood Police Officers (NPO) program would focus police activities around liquor stores, gas stations, and schools.

New Neighborhood Police Officers (NPO) program will place officers around schools, gas stations and liquor stores.

— Michigan Citizen (@MichiganCitizen) October 5, 2013

Earlier in the week on Wednesday, October 2nd , Craig asked gas station and party store owners to clean up their properties to deter crime.

“We have too few police officers,” he said. “There can be no expectations that we can do it all. Through a partnership, we can do it all.”

At first blush it would appear that Chief Craig plans to just focus on the entire city (see first map). There are 582 liquor stores, 449 gas stations, and 105 schools. That makes 1,136 key locations that Craig wants neighborhood officers to focus on, but how does that break down by neighborhood? Which neighborhood might see an increased presence of neighborhood police?

(Note: neighborhood is a very fluid term in Detroit, so we relied on the City of Detroit Master Plan neighborhoods GIS shapefile)

dpdcraig_dense

By aggregating these 1,136 locations by neighborhood, we can see where police might increase presence or at least be more noticeable. Connor just below the Osborn (Mt. Olivet) area, Finney on the far East side, and Cerveny/ Grandmont (Grandmont-Rosedale) to the West have the highest numbers of these locations. This is not surprising based on the fact that the city’s population is more dense to the far East and West. This map also helps to show greater prevalence of locations on the greater West side than the East side. Ok, great so now we know in general which neighborhoods have a greater number of locations that the new NPO program wants to focus on, but how does that map with crime trends in Detroit?

dpdcraig_homicide

In general, homicide rates follow the same trend as property crimes (burglary, larceny, car theft). The best available data is on homicides, so that was used a general crime marker. In comparing the two maps it would appear that neighborhoods that have higher density of liquor stores, gas stations, and schools also tend to have higher prevalence of homicide. It appears that the Detroit Police Department and Chief Craig have made good on their promise to utilize more data driven approaches to crime prevention. Hopefully the NPO program is able to improve safety in these neighborhoods. What remains to be seen is the implementation of Stop-and-Frisk in these neighborhoods and if these neighborhoods also become hotspots of unjustified frisks.

Map: Children’s automobile ‘accidents’ in Detroit

bunge_child_auto

Not much more explanation is needed for this William Bunge map. The important and critical piece is his question: “If you can predict an event, why call it an accident?” I feel like this can easily be applied to many issues in Detroit. Many crises were predictable, yet there was a lack of interest to act. Bunge reminds us that we need to utilize data to better predict and improve conditions for all residents of Detroit. In many ways the city’s environment can be improved to assist in the health and well-being of residents.

Map: Asthma Prevalence by Zipcode in Detroit 2010

asthma_zipcode

Asthma is another chronic condition that has high prevalence in Detroit, above the national average. This map showing hospitalizations resulting from asthma comes from a current Geography Professor, Dr. Annalie Campos, who is also working for the Center for Urban Studies. Interestingly the data doesn’t match 48217’s title as the “most polluted zipcode.” The Drawing Detroit blog has more:

The above map shows persistent asthma prevalence rates for children (under 18 years of age) enrolled in Medicaid in 2010 for each zip code in the City of Detroit. The asthma prevalence rate for children in Medicaid in the City of Detroit in 2010 ranged from 4.6 percent to 7.9 percent. Five zip codes recorded the highest rates (6.71%-7.9%) among all 27 zip codes.  These five zip codes are: 48201, 48207, 48212, 48213, and 48216. As depicted in Table 1, the persistent asthma prevalence rate for children (under 18 years of age) enrolled in Medicaid in the entire City of Detroit in 2010 was 6 percent.

See also: Detroit Asthma Morbidity Map