Detroit Hand Maps for Social Justice

photo 3

Participants of the “Data, Mapping, & Research Justice” workshop through Co.Open and Allied Media Projects (AMP) spent some time creating analog maps of Detroit using only their hands and their creativity to tell their stories. They agreed to share their maps here for all to see. I was particularly impressed by their use of emotions and social issues related to their spatial/ geographic awareness of Detroit.

At the end of our first class we held an excellent discussion on research justice and how to balance narrative information with hard data; numbers and statistics. We tapped into the long running debate on the merits of qualitative data versus quantitative data. Our conclusion was that both are important to use and often times quantitative numbers data can open the door for policy makers to begin listening to the qualitative stories and experiences of the people behind the numbers.

I can’t wait to see what kinds of digital maps that everyone will come up with by the end of the course!

photo 1

photo 4

photo 2

photo 5

Map: Trumbull Households Displaced by Urban Renewal 1971

Trumbull-Displace

This map comes from the Detroit Geographic Expedition and Institute’s Field Notes 4 publication where you could also find the map image comparing neighborhood assets of the suburbs vs. the city.

During the “urban renewal” push that created the notable districts of Midtown (Medical Center, Art Center, Museum District, etc.) Wayne State University (WSU) was also a focus area called University City 2 (UC2). The Trumbull area was considered to have a transient population that was undesirable for WSU and the City of Detroit. Residents were offered relocation funding and many 31% of renters moved locally in a northwestern direction, however displaced homeowners tended to move further away and often outside of Detroit. Between 1960 and 1970 the Trumbull community population went from 14,500 people down to 8,000.

Field Notes 4 focused on the takeover of the Matthaei Playfield by WSU for its sport facilities, but also examined housing, police, and health services in the Trumbull community (now better known as Woodbridge).

Data: 77 Full-line Grocery Stores in Detroit

detroit-grocery-pic

This number comes from efforts of the last 3 years from my Detroit Food Map project. I started completing nutritional assessments of grocery stores in May 2012 working off of the DEGC list of full-line grocery stores. In the summer of 2013 I put together a team of 15 volunteer surveyors from local universities and community groups to survey all of Detroit’s grocery stores. We found that 77 of them met the criteria for a full-line grocery store and all of the stores surveyed carried at least 15 varieties of fruits and vegetables. The major difference with many of Detroit’s grocery stores and big chain supermarkets is often the size of the produce section, which limits the selection.

Over the last 3 years I’ve seen a handful of grocery stores close, a few new ones open, and some even converted into Family Dollar locations.

Find out more about the project: Detroit Food Map

Photo credit: Wally Nowinski (Detroit’s Grocery Stores)

detroitdata_get

Map: Corktown Animated Over the Years

corktown

Corktown is many things, but one thing that it definitely is not is definitive. Much like Detroit does not end at the city limits, neighborhoods and communities in Detroit are rarely definitively bounded areas unless there is a strong economic interest involved (i.e. Midtown and Skillman “Good” Neighborhoods). This idea of evolving boundaries and neighborhoods can easily be seen in the birth, decline, and redevelopment of Corktown.

This animation charts the changing area known officially as Corktown as well as the expanding idea of Corktown.

Much of the information in this post is based from Paul’s well researched post on “Corktown’s Blurry Boundaries.”

  • 1884 – 1940 – Corktown remains the same main area from it’s epicenter at the Holy Trinity Catholic Parish with a majority Irish residents.
  • 1953 – The Lodge Freeway development cuts off a piece of the eastern edge of Corktown
  • 1960s – Many areas of the city were in decline and Corktown was no different. The Fisher Freeway construction sliced off the northern piece of Corktown, which became known as the Briggs neighborhood named for the former Briggs Stadium. In the same time period the blight of Corktown was targeted for redevelopment in the West Side Industrial project which significantly reduced the area known as Corktown.
  • 1978 – the National Registry of Historic Places (NRHP) designates a small area as historically Corktown.
  • 1985 – The Detroit Free Press covers the efforts to expand the historic Corktown area
  • 1998 – The historic western portion of Corktown is officially added to the NRHP
  • 2002 – The Greater Corktown Development Corporation (now defunct) works to rename Briggs to “North Corktown” in order to benefit from the increasing appeal of the Corktown area.
  • 2012 – Green Dot Stables starts referring to their location as “Corktown Shores,” including printed t-shirts, although the area has a strong community identify as Hubbard-Richard.
  • 2014 – A couple takes it upon themselves to aid in the redevelopment of the area west of Corktown, referring to it as West Corktown. Many businesses in the area utilize the Corktown moniker to promote their businesses such as Ponyride, Corktown Inn, Hostel Detroit, Le Petit Zinc, and Nancy Whiskey although their respective locations are not historically known as Corktown (i.e. Ponyride occupies the empty triangle in the middle). The West Side Industrial area is still regularly referred to as Corktown.

What is missing?

Map: Corktown’s Evolving Boundaries

corktown-history-map

I’ve been trying to chart the changing borders of a few of Detroit’s well known neighborhoods. I had gotten in pretty deep into researching Corktown when I came across the Corktown History blog where the above map was posted.

More from author Paul Sewick:

As Detroit’s Corktown neighborhood becomes increasingly popular, questions frequently arise regarding its exact boundaries.  But Corktown was not a planned community with fixed borders.  It grew, developed, and changed organically.  This map is an attempt to trace its changing definition.  The original parish borders of Most Holy Trinity Church are generally agreed to coincide with the old neighborhood.  But as urban renewal hacked its way through the city, some segments of Corktown were isolated and took on a new character, while others were wiped out completely.  These parts comprise the area denoted as “Former Corktown.” “Old Corktown” is the area that remains relatively intact.  The development projects that divided Corktown also joined its core with other residential areas that would not have been considered “Corktown” in the 19th century–the “Corktown Addition”.  Of course, this is just another attempt to define a neighborhood that doesn’t want to be defined.

For a history of the attempts other have made, read more on Corktown’s Blurry Borders

Paul notes how the development of the M-10 Lodge expressway cut Corktown in half and the Briggs neighborhood came about near the former Briggs Stadium site. Later the West Side Industrial redevelopment project took off a portion of Corktown.

Recently, members of the Briggs neighborhood voted to be renamed as ‘North Corktown” and there is a new group centered in the West Side Industrial area who are starting to call the area “West Corktown.” A mention must also be thrown in about the supposed joke of “Corktown Shores.” Perhaps Corktown will again expand (organically or planned) to it’s former boundaries?

Detroit Area Expressways Map 1959

expressways_1959

This map by Yellow Pages, Michigan Bell Company was a part of the “Complete Illustrated Guide to Dynamic Detroit with Detailed Maps” in 1959 ($0.60). Hastings Street had not yet been bulldozed for I-75 construction. This map also demonstrates how Detroit’s spoke streets used to be numbered as part of the expressways system. For this reason, many of the spoke streets are much wider than they need to be based on low traffic usage.


Map: Detroit Design Festival and the Myth of the Blank Canvas

ddf_locations

The long and short of this post title is that artists are among the first line of gentrifiers. It is true artists often have very lower incomes, transient housing, and suffer from a lack of understanding from a majority of the public – however, most, if not all, artists come into various cities and urban settings with a great amount of privilege. Choosing to attend art school is privilege number one when others often lack the ability to pursue art at mostly expensive, private schools. The map shows that over the years the Detroit Design Festival (DDF) has become more concentrated in specific areas as well as increased the number of hosted “happenings” or events in those concentrated areas.

In Detroit you can see this blessing and curse all bound up in the idea of “doing something good” in the city’s “blank canvas” of opportunity. While artists attempt to be very self aware and well meaning, they face many of the same pitfalls of a nonprofit attempting to do the most good in areas where they have limited experience. The missing ingredient in the case of both artists and nonprofits is the lack of understanding for historical context and root causes. If you hope to do anything in Detroit, it must start with a critical perspective on the city’s history of racism, regional separation, and the need for equity. Detroit is layered with historical and cultural nuance. It is impossible to forget the history and try to start something fresh.

The Detroit Creative Corridor Center (DC3) which puts on the Detroit Design Festival highlights its “network” of mentors which includes only 5 minorities out of 47 members (Less than 10%). Similarly, only 30% of their Creative Ventures incubator program participants are minorities. There is a real problem in the Detroit creative community in that there is a racial disparity in regards to who gets funding. This seems especially egregious when 83% of Detroit’s population is Black or African American. There are countless creative programs across the city being run by Black residents and minorities, but the question remains in who gets the funding and support to carry out their artistic work.

A while back I wrote a piece, Detroit is Not Your Blank Canvas, looking at the impact of art on neighborhoods and what I felt was a need for artists to be critical in understanding their own privilege and engaging people who are already here. This was a final question from my critique on the “blank canvas” myth:

“Art can no longer be ignored as an economic impactor, but if art can build vibrancy and revive communities it begs the question: for whom does art revive communities?”

Data: Hardest Hit Fund Demolitions in Detroit

detroit-demo-houseMayor Duggan has made demolition of blighted homes a top priority with 1,927 home demolitions up until September 10, 2014. Luckily for Duggan, he isn’t the only one with this goal. A number of private and federal interests also want to move forward with tearing down Detroit’s blight.

Contractor Number Percent
Able 102 5.30%
Adamo 744 38.63%
Blue Star 110 5.71%
DMC 59 3.06%
Homrich 690 35.83%
MCM 221 11.47%

The top two contractors tearing down Detroit’s blight are Adamo (38%), based in Detroit, and Homrich (35%), also contracted to shutoff residential water accounts. Both companies have been in the demolition business since 1964 and I can only wonder how many Detroit homes have met the business end of their machinery.

The BuildingDetroit.org site has the demolitions listed in PDF form and we took just a few hours to turn them into a usable dataset. Open data requires no more PDFs!

detroitdata_get

Map: Discriminatory Mortgage Lending in Detroit

detroit_hmda

The Urban Institute has completed an excellent analysis with Home Mortgage Disclosure Act (HMDA) data. I had been wanting to work with the HDMA data after Michigan Legal Services and the ACLU won a lawsuit against Morgan Stanley for employing racial discrimination in subprime home mortgages offered to Black Detroit homeowners during the economic recession. The New Century Financial Group (now bankrupt) was tasked with seeking out Black homeowners to offer subprime mortgages. From Reuters:

“The ACLU asked the court to certify the case as a class action. It said as many as 6,000 black homeowners in the Detroit area may have suffered similar discrimination as a result of being offered loans that many could not afford.”

Recently, JP Morgan Chase (Chase Bank) announced that it would be investing $100 million in Detroit over the next 5 years. This could only be seen as a corporate move to appease their racial discrimination. Detroit has been named as the 5th hardest hit city during the housing crisis. At the Detroit Homecoming Mayor Duggan told the audience that the city had sold 162 homes, but people are saying, “we can’t get mortgages.” It seems that Mayor Duggan should be keeping a very watchful eye on Chase Bank, Morgan Stanley, JP Morgan Chase, etc. if he truly hopes to stem the tide of migration out of Detroit.

Text from the Urban Institute‘s page:

A delayed recovery still hurts minorities most: Detroit

Detroit is the poster child for cities that have lacked a strong recovery like San Francisco’s. The sharp drop in the number of mortgages reflects this ailing Rust Belt city’s sweeping economic decline. According to the US Census Bureau, Detroit’s population fell from 951,270 to 713,777 between 2000 and 2010 as the auto industry stumbled, jobs disappeared, and the city entered the largest municipal bankruptcy on record. Though the recession took a toll on the entire region, the housing bust still disproportionately hurt minority borrowers.

Detroit’s downtown, which held a large share of mortgages made to African American borrowers during the boom, has remained virtually devoid of new mortgages since the bust. From 2006 to 2012, the number of mortgages in the metropolitan area fell 79 percent for African American borrowers as lending within city limits fell off the map. In comparison, the number of mortgages made to white borrowers dropped only 11 percent. Recent investments from the private sector suggest a comeback could be under way, but the mortgage market in the inner city shows no sign of recovery yet.

Map: Hardest Hit Fund Demolitions in Detroit

HHF_Demos_PubicMap_7_29

One of Mayor Duggan’s biggest initiatives came with a large amount of federal and private funding. Duggan essentially kicked out the Pulte Family’s “Detroit Blight Authority” efforts, so they have started spending their money focusing their efforts on tearing down blight in Pontiac. The Motor City Mapping project and the subsequent “Blight Report” from the Blight Removal Task Force chaired by Dan Gilbert further emphasized the removal of blighted structures. There are a number of financial interests in bringing down blight, from the city government image department, to funders of the Detroit Future City Plan (Kresge, Skillman, etc.). Each week the Mayor highlights how many houses were demolished as part of blight elimination.

In the last 2 weeks I’ve heard various reports from friends who are residents of dozens of homes getting torn down in the matter of hours: in the Osborn area someone talked about starting at 7am, eight houses in a row were torn down and in the North End nearly 12 were taken down between 9am and noon.

The data used in the above map is unfortunately only available in PDF format.

UPDATE 09/22/14: I spent a few hours today scrapping the data. Enjoy!

detroitdata_get


Detroit Region Population Density Map 1970 – 2010

detroit-density-years


Detroit Region Census track population density change 1970-2010 by redditor Butter-Tub :

The population data came from the US Census, downloaded from NHGIS, and joined in ArcGIS. The 3D visualizations were created in ArcScene, exported for each year, and then loaded into GIMP as layer files. From there it was a simple export to GIF.

Workshop: Data, Mapping, and Research Justice

coopen_banner_data-300x300

A little horn tooting: I will be presenting a workshop on data and making maps in October with Allied Media Projects Co.Open. We’ll be doing some active data collection and retrospective analysis of the Cass Corridor. Sounds exciting right!? This is all to keep working towards to goal of getting more people making maps!

Everyone wants to use amazing maps and visual graphics for their causes, but there are a number of behind the scenes steps to ensure data is collected in a way that promotes justice. Maps and data can be used to better understand where inequality exists, to look at possible correlations between environmental risk factors, or even to visualize community responses. Working within the frame of research justice, we will be using open source tools to work with GIS data. Our goal will be to successfully understand data collection, data management, and basic map visualization. Do you want to use maps and data to further your social justice cause? Then this is the course for you!

Register here!

Here is a link to apply for reduced rate scholarships

Map: Growth of Detroit in Pictograms

detroit-growth-pictograms


These fun pictograms come from “Detroit: a manual for Citizens” published by the Detroit Public Schools in 1958.

In the text it asks:

“Perhaps it will interest you to locate the year of your birth and notice how Detroit has grown in your lifetime.”

I’m not sure how many Detroiters are alive today that can still do that.

Map: Historic Detroit Neighborhoods 1884

silas_nhoods

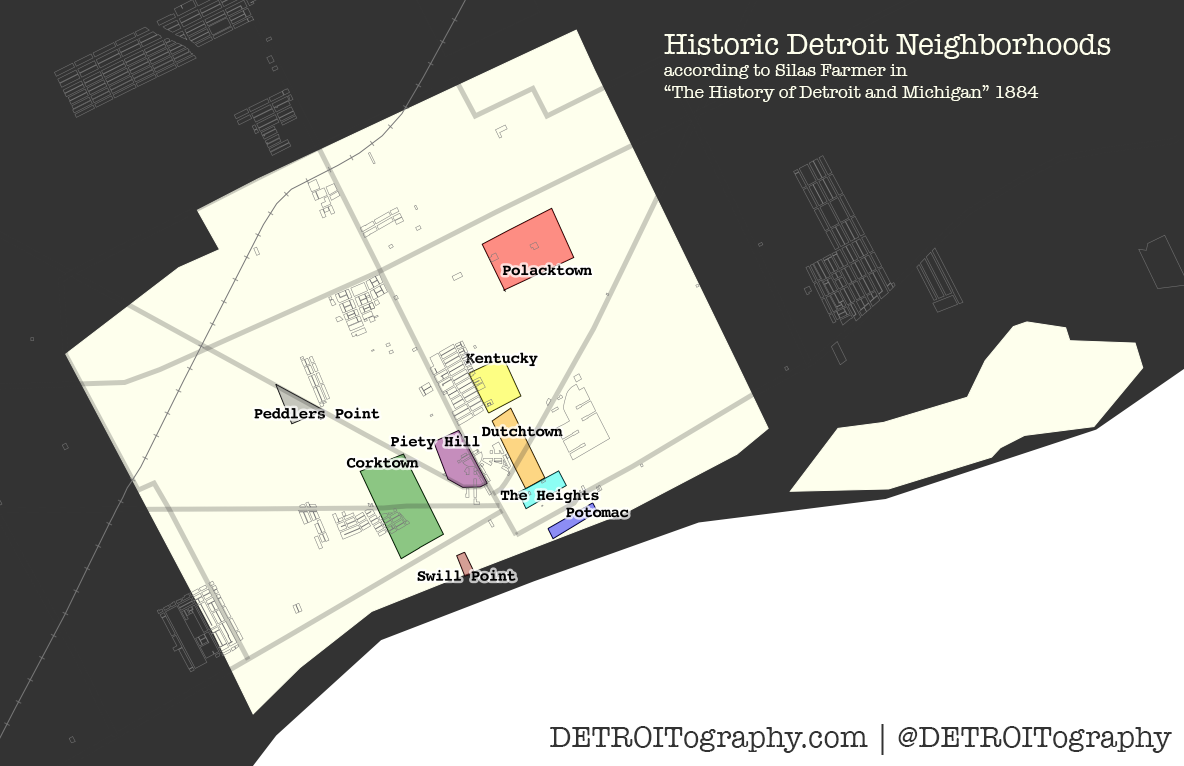
From “The History of Detroit and Michigan” by Detroit’s first cartographer, Silas Farmer.

Excepts on each neighborhood:

“This the larger portion of the territory on Fifth and Sixth Streets, for several blocks each side of Michigan Avenue, is called Corktown, because chiefly occupied by people from the Emerald Isle.

The eastern part of the city, for several blocks on each side of Gratiot Avenue beyond Brush Street, for similar reasons is often spoken of as Dutchtown, or the German quarter.

That part of the city lying a few blocks north of High Street and between Brush and Hastings, is known as Kentucky, from the number of colored people living there.

A walk a few blocks east and north of this locality terminates in the heart of Polacktown, where many Poles reside.

The portion of the city just west of Woodward Avenue and north of Grand River Avenue, forming part of the old Fifth Ward, is sometimes designated as Piety Hill; for the reason that it is largely occupied by well-to-do citizens, who are supposed to largely represent the moral and religious portion of the community.

Peddler’s Point is the name frequently applied to a part of Grand River Avenue near Twelfth Street. The intersection of several streets at that place forms a pointed block, which locality is a favorite place itinerant hucksters to intercept and purchase supplies from farmers coming in on the Grand River Road.

Swill Point is not the very euphonious appellation sometimes given to a portion of Larned Street near Second, because of a distillery formerly located near by.

Atwater and Franklin Streets, for several blocks east of Brush Street, are frequently designated as the Potomac. This locality is near the river, and in memory of a familiar saying of the last war, the phrase “all quiet on the Potomac” indicates that otherwise disturbances might be looked for in the region indicated.

The Heights is a name applied to a region near the westerly end of Fort Street East, occupied in part by former denziens of the Potomac quarter.”

Many of these names remain with Corktown likely being the most recognizable. The development of the expressways changed the neighborhood, but did not wipe it out as it did to neighborhoods like Kentucky along Hastings Street which barely even exists today. Dutchtown isn’t much referred to today, but Germantown Park (Harmonie Park) can still be visited Downtown. Polacktown seems to have morphed into Poletown and the Polish population moving to occupying Hamtramck.

This map also includes the local historic designations. Beyond the 1884 referenced boundary from Silas Farmer, there are only about 4 other major clusters of historic areas. Downtown was a critical zone for various immigrant communities to make their start in Detroit. Greektown is the well known name today, but a series of immigrant groups have cycled through that neighborhood throughout Detroit’s history.


Map: Public Health in Detroit 1955

public-health-detroit-1955

This map is from a booklet published by the Detroit Public Schools in 1958 titled, “Detroit: A Citizens Guide.” Among the many informational sections is a section on “public health” in Detroit.

“The commissioner [Department of Public Health] must also collect information on the cases of diphtheria, scarlet fever, typhoid fever, smallpox, pneumonia, and several other diseases that are reported each day. He keeps a record of where these people live, who is taking care of them, and of any deaths. This information is important for the health of the city because it supplies facts on which the health commissioner may lay plans to prevent the spread of disease and promote health. The map on page 150 gives you some of this information, according to the various sections of the city.”

Map: Detroit Neighborhood Strength Index

Screen Shot 2014-09-06 at 11.13.19 PM

A group of University of Michigan urban planning graduate students completed a 2006 report titled, “Planning for Detroit’s Tax-Reverted Properties: Possibilities for the Wayne County Land Bank.” The project was supported by Community Development Advocates of Detroit (CDAD) and funded by Local Initiatives Support Corporation (LISC). From the report:

“Planners working with the City of Detroit’s Planning & Development Department created an index for the City of Detroit using a ranking system to classify areas, where census tracts with a ranking of 1 are the weakest and 10 are the strongest. The average census tract score is 6. This system uses six indicators that serve as the basis for comparison:”

  • Rate of owner-occupancy
  • Number of occupied units
  • Households above the poverty line
  • Median household income
  • Population below age 65
  • Workers employed in professional or managerial occupations

Map: Detroit Water Affordability

detwater_affordability

The standard for affordable water is set by the Environmental Protection Agency (EPA). The EPA attempts to stress equity and consideration for low-income individuals. In 1995, the EPA set the first water affordability rate at 2% which is considered a “large economic impact.” Unfortunately, the Detroit Water and Sewerage Department (DWSD) among other non-governmental actors disagree with the EPA and have different ideas as to how to pay for and maintain this basic human need and natural resource.

Detroit’s water rate was increased by 8.7% in July 2014 effectively making an average monthly water bill at $70.76 (or $849.12 annually). In order for this $850 annual rate to fit within the EPA’s standard of “affordability” a household would need an annual income of around $40,000. Anyone aware of the situation in Detroit and Census data could tell you that the majority of households in Detroit do not have that level of income and that the median income in Detroit is $26,955. That goes without saying that 40% of Detroit residents live below the poverty line. For the Detroit average household of 3, less than $19,790 is living below the poverty line.

All of these numbers show that 303,389 households in Detroit have an income less than $39,900 making almost 80% of Detroit households vulnerable in regards to water affordability.

Event: Network Detroit 2014 – Detroit Cartographies

Network Detroit is an event focused on digital humanities. I was approached to give a presentation on the efforts of this blog to catalog, share, and create maps of Detroit. I get a lot of information and maps from both digital libraries hosted by universities as well as public libraries and archives.

Bringing together the libraries, universities, and museums of Southeast Michigan, Network Detroit is a conference aimed at sharing and promoting cutting-edge digital work in the humanities. The conference will be held at Lawrence Technological University in Southfield, Michigan on September 26-27, 2014.

Friday, September 26th

11:00-12:30 p.m.

Panel I:  Detroit Cartographies

  • Peter Leonard, Yale University, “Ghost Streets of Detroit: Towards an Online Historical Gazetteer of the Motor City.”
  • Alex B. Hill  Wayne State University, “Archiving Cartography as Method to Understand Detroit’s Present and Future.”
  • Kim Lacey, Saginaw Valley State University, “’Detroit is a Shithole’: Matthew Barney and the City.”

I will be part of the first panel discussion. I’m not sure the direction of the discussion based on the other panelists, but am looking forward to sharing what I have learned over the past year of digging up Detroit’s history to understand its present through maps. The event is free to undergraduate and graduate students, so please consider coming out to support. There will be a number of presenters from Wayne State University’s Anthropology program later that same day.

Map: Detroit Postal Area Codes 1946

PostOfficeMap1946small

Thanks to the DetroitYES forum post by MikeM:

This map from 1946 shows the postal zones (forerunners of the ZIP code system) for Detroit. I think these were introduced around the time of WWII. Each zone had its own office and a lot of the zone numbers eventually became the last two digits of the ZIP code. As the city grew some of the zones were further divided.


Map: Detroit Percent of Land in Farms 1900 – 1959

se_mi_pct_land_in_farms

This beautiful series of maps, among many others, come from a three volume set of books commissioned by DTE in the 1970s titled, Emergence and Growth of an Urban Region: The Developing Urban Detroit Area. Constantinos Doxiadis was hired by DTE because of his focus on the “science of urban settlements” which he called Ekistics.

These maps help to show how the Detroit region shifted from an agricultural focus to industrial as population and industry grew over time.