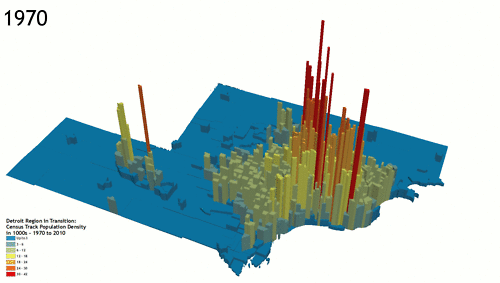
Detroit Region Census track population density change 1970-2010 by redditor Butter-Tub :
The population data came from the US Census, downloaded from NHGIS, and joined in ArcGIS. The 3D visualizations were created in ArcScene, exported for each year, and then loaded into GIMP as layer files. From there it was a simple export to GIF.
