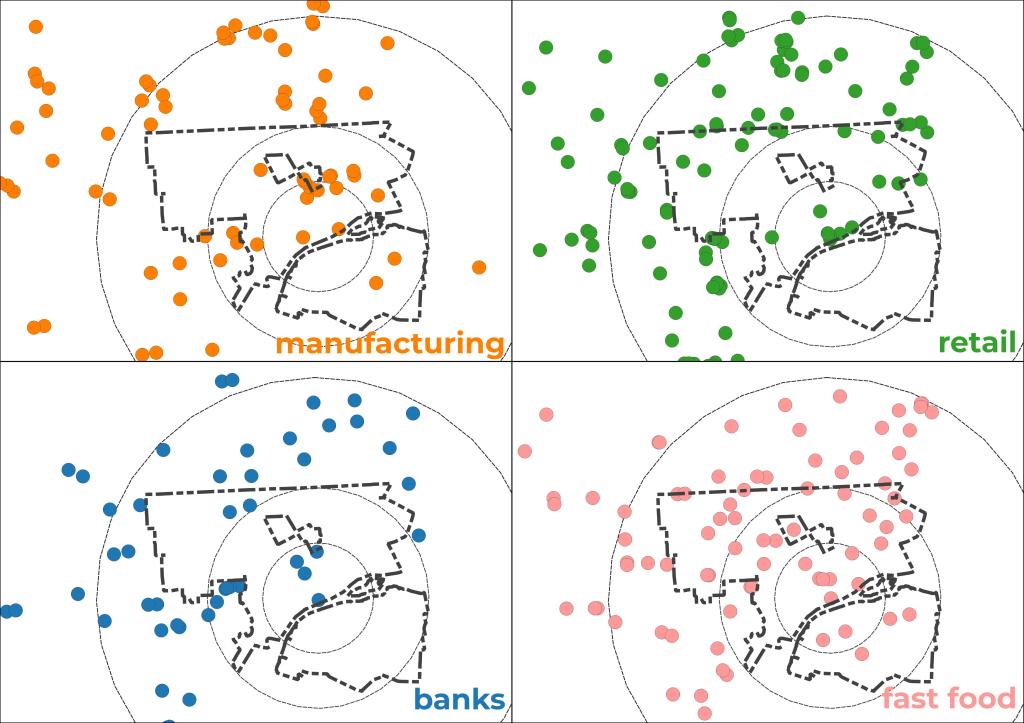
Detroit is a city of change even though we often seem relatively steadfast or even stagnant. I first mapped “business rings” of Detroit in 2014 and largely concluded they were empty except for national fast food chains. Now, 10 years later, I wanted to explore what has changed and what has remained the same related to the presence of national brands’ footprints in Detroit.
Retail
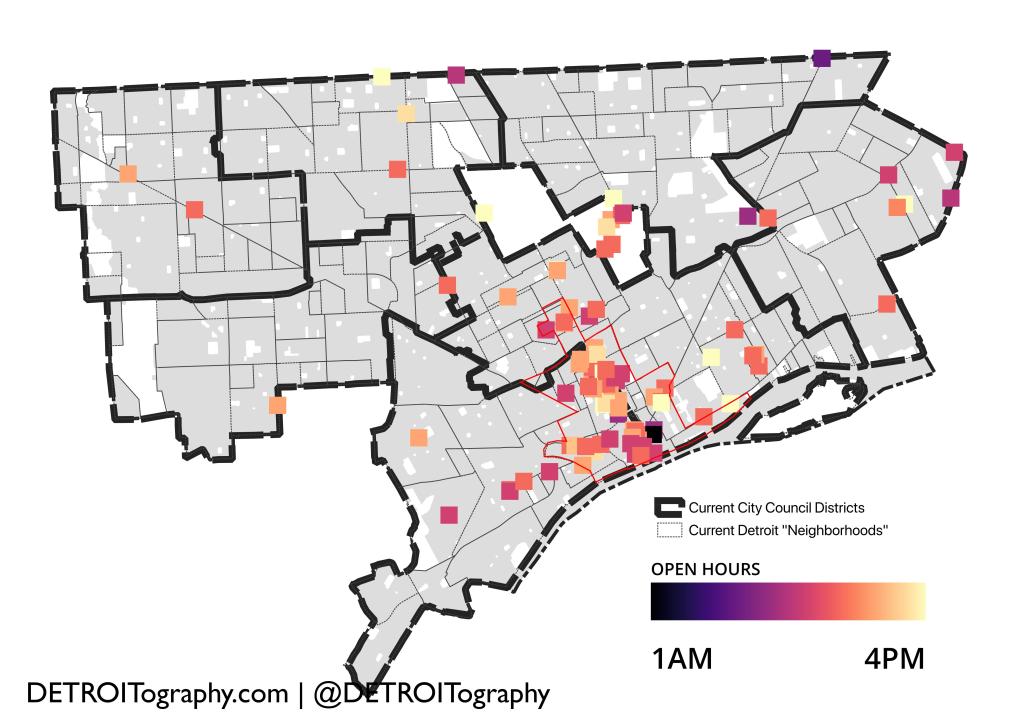
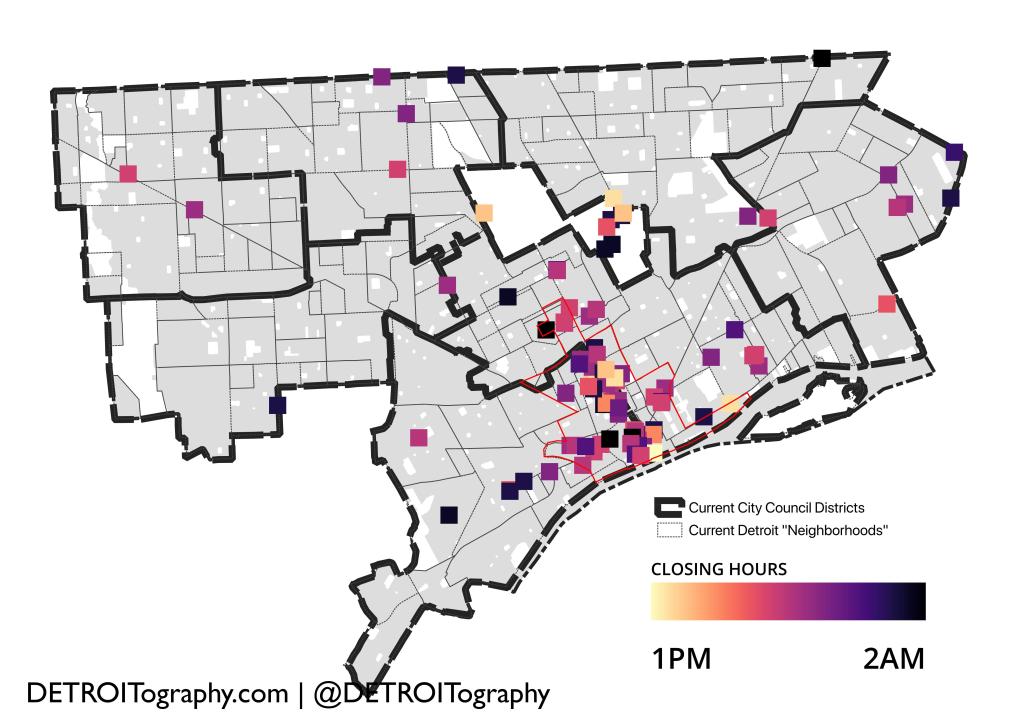
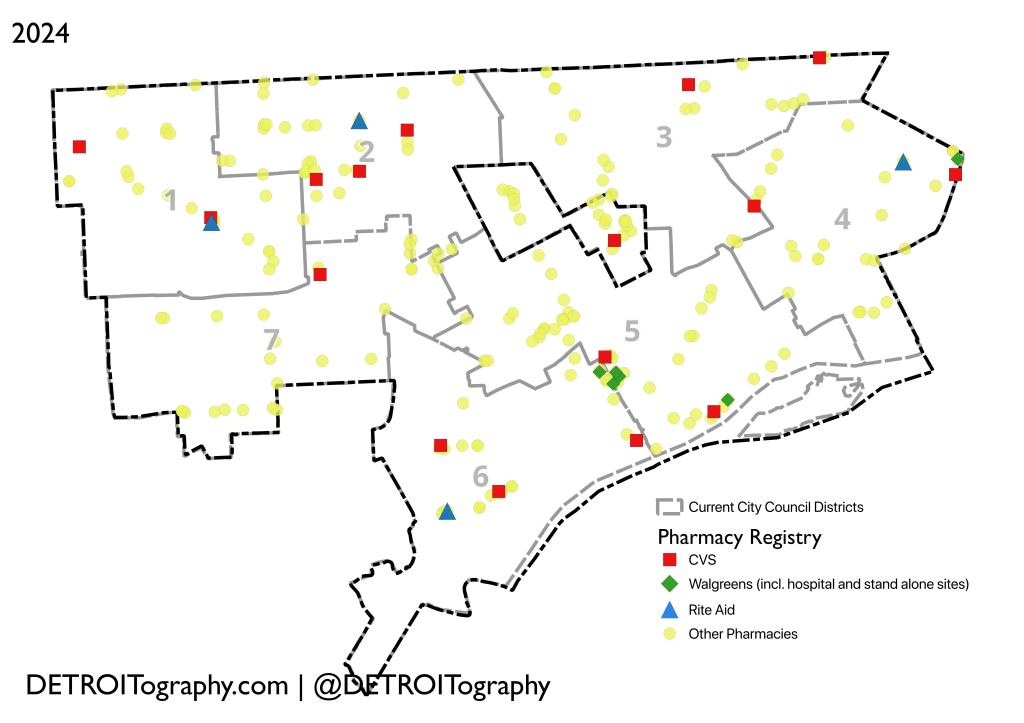
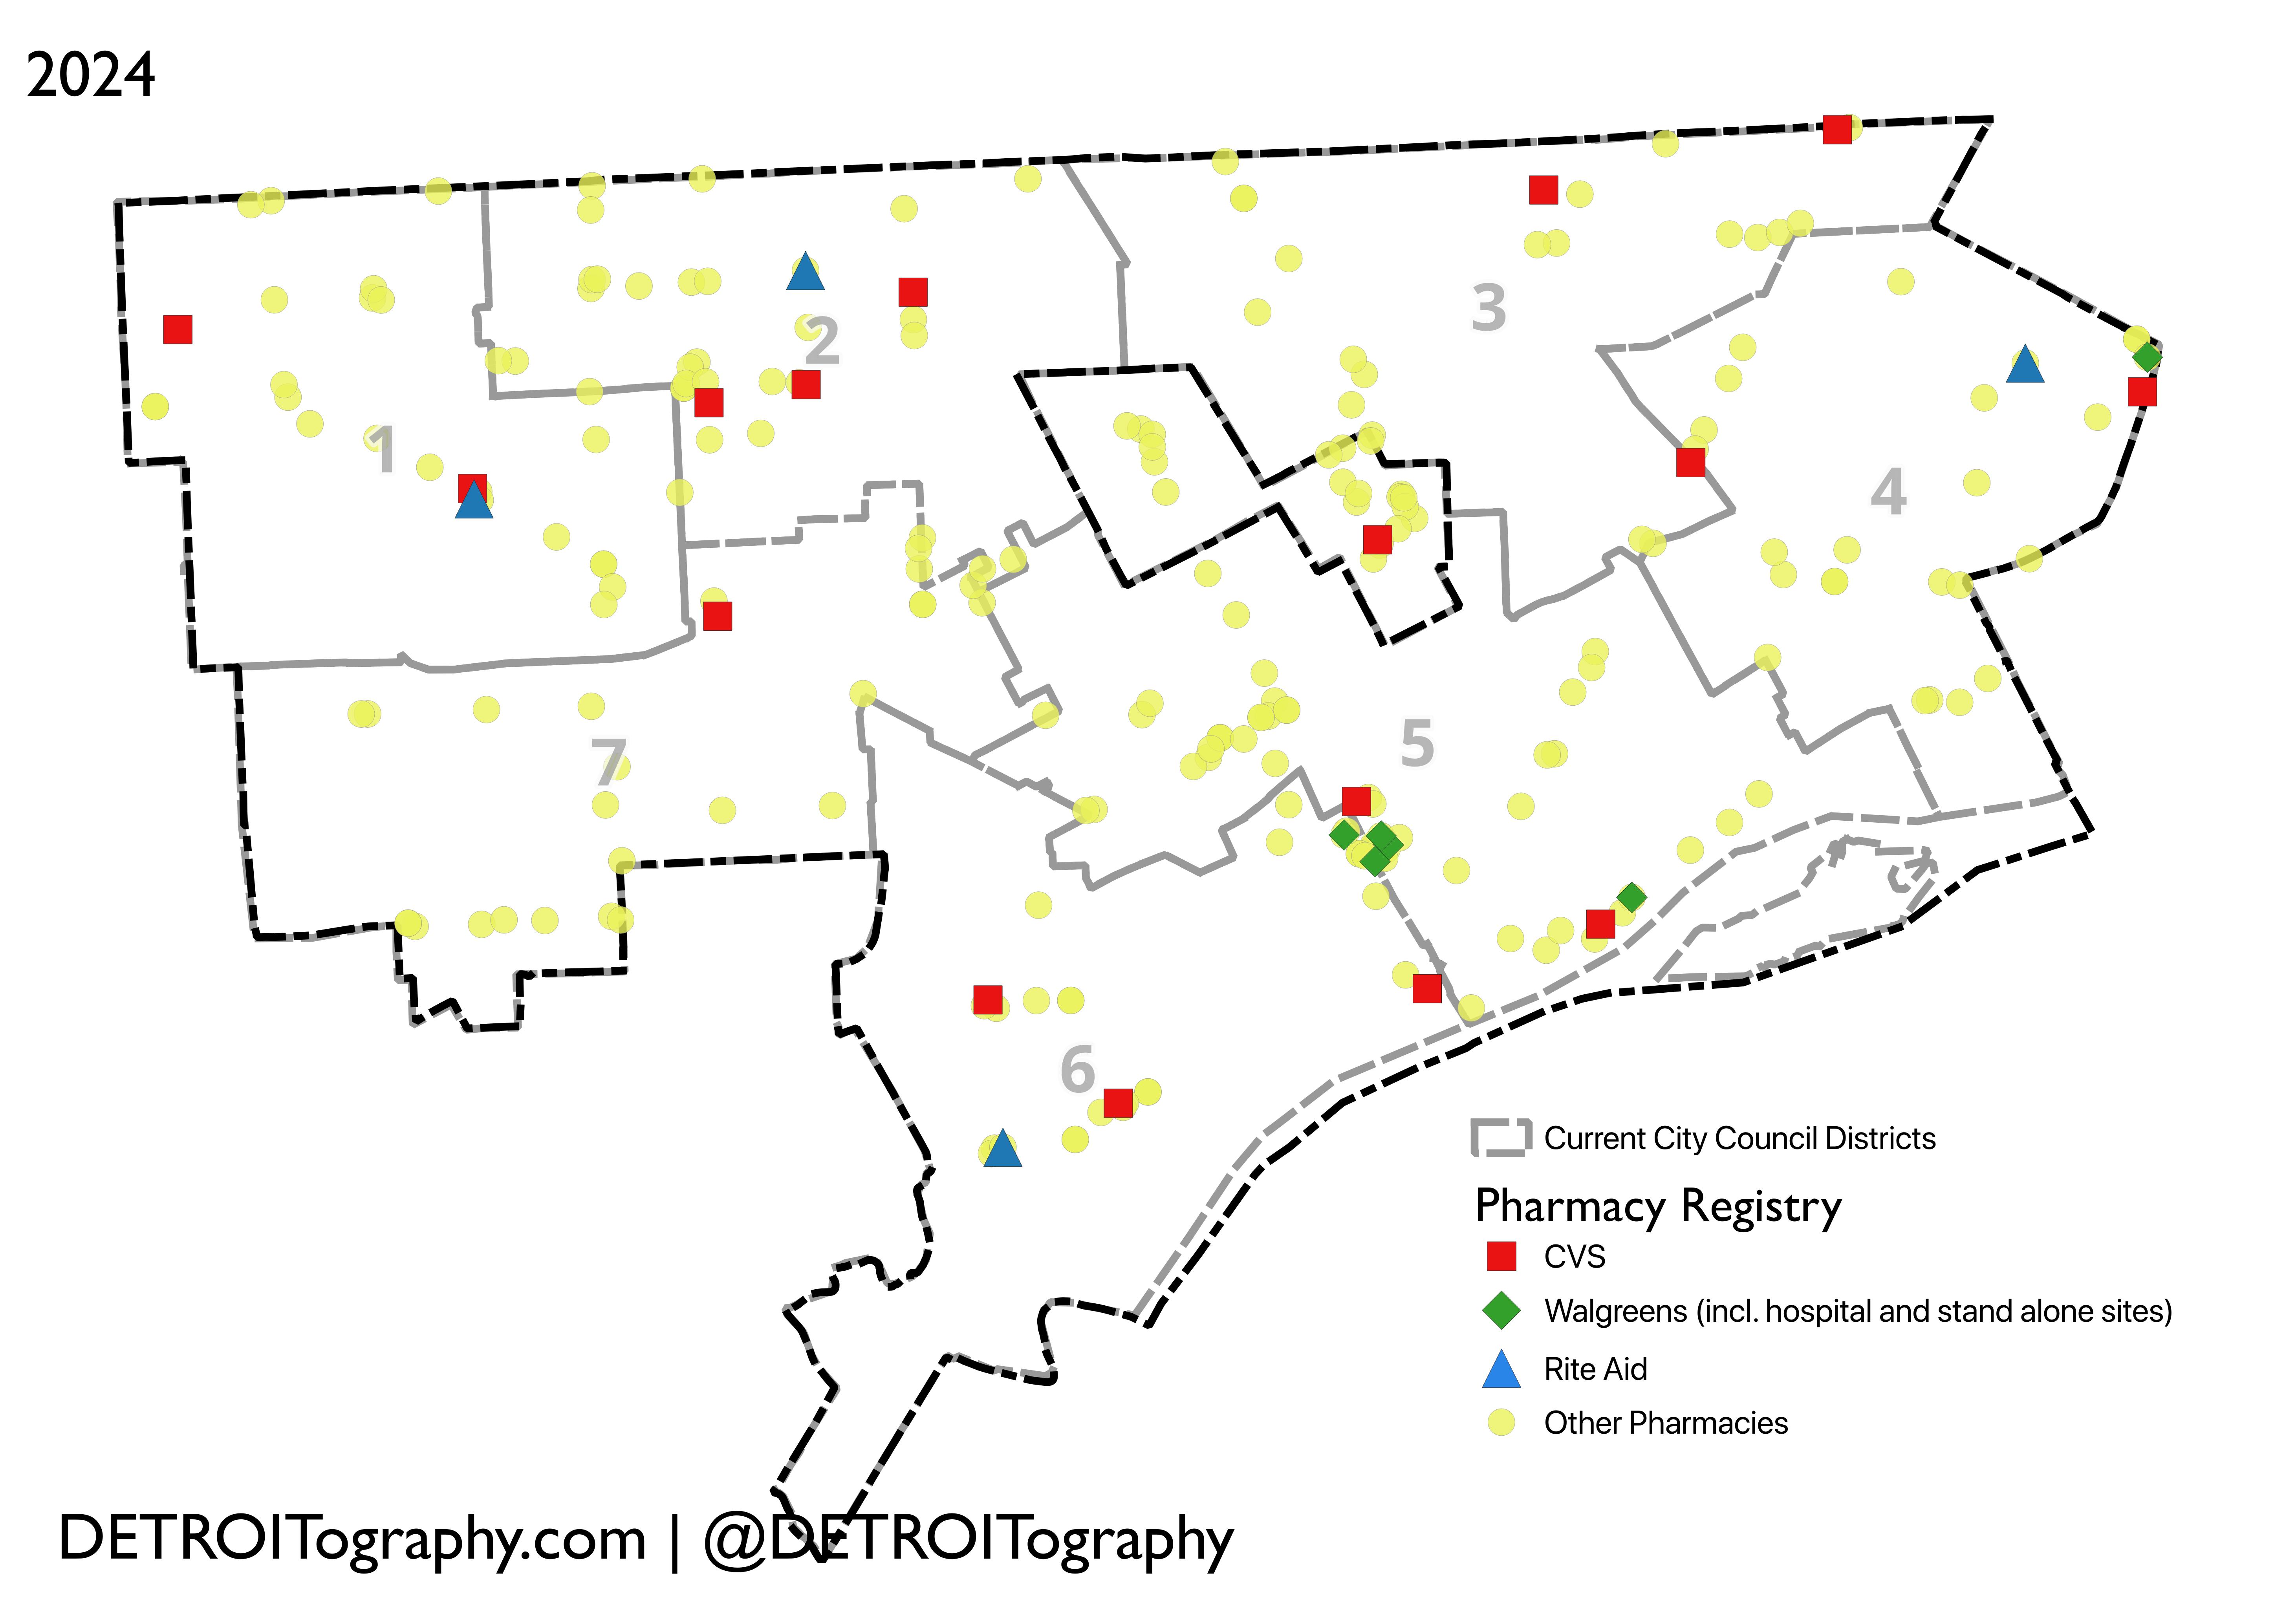
Downtown has benefited the most from significant investment, redevelopment, historic preservation, and large scale new construction. The new development brought in retailers like H&M, Lululemon, and even Gucci. Amazon did not select Detroit for their HQ2 location after a concerted effort by city elites, but the company did build a distribution facility on the old State Fairgrounds as well as a distribution center Downtown. In Detroit’s neighborhoods, key retailers like convenience stores, dollar stores, and pharmacies all had fits and starts and closures. Convenience stores and pharmacies closed many locations leaving even more limited retail options for Detroiters. Meijer opened up two additional locations in the city while independent grocers have been on a steady decline. Other regional retail loses included the closure of Eastland Mall (Macy’s, Target) and the Bed, Bath, and Beyond bankruptcy.
Manufacturing
The Poletown Plant nearly closed before being converted into Factory Zero to produce electric vehicles, but otherwise car building is still quite limited in Detroit. Other kinds of manufacturing have seen an increase in the city at corporations like Dakkota, Flex N’ Gate, and LEAR expanding operations into Detroit. Supposedly a large electric battery plant is coming to the city as well. The locations mapped are based on the 2024 Crains Detroit list of top Michigan manufacturers.
Banks
In the last decade, there has been a significant amount of bank consolidation. TCF Bank bought Chemical Bank and then the combined bank was bought by Huntington Bank. Compared to 2014, there are just 25% of bank branch locations left. Fifth Third Bank has kept an office Downtown and Huntington Bank also built a headquarters in Detroit and retains the naming rights for what most know as Cobo Hall.
Fast Food
Oddly, fast food in Detroit has had an reduction largely related to a Burger King franchisee losing their franchise agreement. There are empty and burned out Burger King locations across the city now compared to 2014. Other fast food hasn’t expanded much in Detroit, but regionally Chick-fil-A has been expanding.