Mystery Federal Map of Detroit

fed-map-detroit The significance of this map is in what has been added. Certain areas have been outlined and points placed across the map. It is unclear what it all means. The added key on the right regarding the points reads:

Screen Shot 2015-01-05 at 7.27.15 AM

All that is known is that it was created (year unknown) by the Federal Lithograph Company of the Marquette Building. Leave a comment if you can solve the mystery! Thanks!

Source: Digital Collections – Burton Historical Collection

Map: The Growth of Parking Lots in Downtown Detroit

dox-parking

The expansion of parking in Downtown Detroit has followed the economic decline and loss of activity Downtown. There has been a fascination with the growth of parking lots for quite some time. We’ve compiled parking lot maps from the 1936, 1974, and 2011. Constantinos Doxiadis and associates created these series of maps that follow the parking pattern with the city development.

Source: “Emergence and Growth of an Urban Region – The Developing Urban Detroit Area, Vol. 3”, Doxiadis Associates, Wayne State University and The Detroit Edison Company, 1970

Map: Extent of Detroit City Services 1870

det-city-services-1870

This map shows how far streets have been paved, where the fire department will serve, and sewer system.

The Detroit Historical Society writes:

“In 1870 it would have been important to show what parts of the city received certain services. This map is shaded pink where fire protection was offered, blue highlights paved roads, and red indicate sewer lines.”

Map: Detroit Area Traffic Destinations 1955

det-traffic-study

This is one of the most beautiful maps from the Detroit Historical Society collection.

“The Detroit Metropolitan Area Traffic Study produced this map in 1955 charting “trip desire”. This means it shows where the most popular destinations are for all vehicle trips within the metropolitan area.”

Map: Income, Race, and Toxic Release in Detroit

det-toxic-release

Elisavet Papatheodorou, MSW created this map for a community group in the Delray area of Southwest Detroit. She writes:

“Low-income communities of color in urban areas often bear a disproportionate burden of environmental pollution. This map measures environmental justice disparities in Wayne County communities based on the presence of toxic chemicals and one social factor: median family income.”

The data sources for the map:

“This map shows EPA Toxic Release Sites in Wayne County, Michigan as they related to median family income in 2009 (American Community Survey, 2005—2009). Green points mark toxic release sites while income brackets are classified by color. White areas on the map signify areas without income data. These are often industrial parks or complexes.  Note the white areas such as Zug Island and Carbon Works.

Note the concentration of sites in Southwest Detroit and adjoining suburbs such as River Rouge. Conversely, note the absence of sites in proximity to the highest income areas such as Grosse Pointe.”


Map: Detroit Streetlights 1897

det-public-lighting-1897

I’m so excited that the Detroit Historical Society has started a regular post of maps from their archives!

“In 1897, the Public Lighting Commission mapped every street light in the city, differentiating tower lights and single pole lights. Published by The Calvert Lith. & Eng. Co.”

We attempted to FOIA the current locations of streetlights from the Public Lighting Authority (PLA) and were told we couldn’t have the data. Anyone have the data and willing to share? DetroitData.org

Map of Detroit Interurban Lines 1915

detroit_interurban_1280

This map comes from the 1915 “Report on Detroit Street Railway Traffic and Proposed Subway.”

On East-West Lines:

“These lines carried 130,553,415 passengers (including transfers) in 1914. Here again it must be noted that all of this traffic was not carried across the center of the city, but the figures give the relative importance of this group of lines.”

On Interurban Lines:

“These lines provide a valuable function in connecting the city with a very widely distributed interurban district, and also run a through service to cities of considerable size.

SourceReport on Detroit Street Railway Traffic and Proposed Subway

Detroit Redlining Map 1939

NOTE: These are not “redlining” maps, but just one piece of the story of home disenfranchisement of Black Americans. Read more on HOLC lending in Detroit. Read more: Before Redlining and Beyond.

DetroitHOLC-MED_2000

Part of Detroit’s history of racial discrimination is comprised on housing discrimination, which in turn contributed to job discrimination, interpersonal racism, and continued racial inequity of opportunity. These areas of Detroit were targeted for “urban renewal” in the 1960s which displaced thousands of black residents to public housing complexes. Today these areas of Detroit have more vacancy (see map) than others either because the redlined properties were managed by slumlords whose properties deteriorated (see map) more quickly or from renewal efforts that didn’t consider the displacement of black residents.

The racial divisions we see in our neighborhoods today are the result of deliberate actions taken in the past. (State of Opportunity)

This segregation of housing, which was legal up until the 1980s, also furthered school segregation and the inadequate education of Detroit’s black children. More from State of Opportunity:

One of the clearest visual representations of how racist policies shaped our neighborhoods comes from a mapping project launched in the 1930s by the federal Home Owners’ Loan Corporation. The HOLC was created in 1933 in response to the Great Depression as a way to help stabilize the housing market in the U.S. It did so by refinancing home mortgages and reshaping the entire residential lending industry. Along the way, HOLC commissioned so-called “Residential Security Maps” for more than 200 U.S. cities. These maps served as a guide for home lenders, including banks and the Federal Housing Administration.

You can find other HOLC maps online at: urbanoasis.org

Check out this great map mashup of redlining 1939 and black neighborhoods in 1940 from Paul Szewczyk:

det_redlining_black_nhoods


UPDATE: 01/14/22

I was able to recreate Paul’s image mashup with data from the 1940 Census from NHGIS and digitized HOLC areas from the University of Richmond “Mapping Inequality” project.

Notably these are not “redlining” maps, but one piece of the story of home disenfranchisement of Black Americans. Read more at Before Redlining and Beyond.

Map: Detroit Greenhouse Gas Emissions

det-gas-emissions

Electricity use in the city contributed 45 percent to 2012 citywide emissions, due in part to DTE Energy’s fuel mix, which consists of 76 percent coal.

“Energy use in buildings accounts for nearly two-thirds of the greenhouse gas emissions generated in Detroit, while exhaust from cars, trucks and buses is responsible for about 30 percent of the total, according to a new citywide inventory compiled by University of Michigan student researchers.

About 41 percent of the emissions from stationary sources—which include residential and commercial buildings, industrial processes, solid waste incineration and wastewater treatment—are produced within four ZIP codes located in the city’s southwest, midtown and downtown areas.

The report also shows that:

  • Electricity use in the city contributed 45 percent to 2012 citywide emissions, due in part to DTE Energy’s fuel mix, which consists of 76 percent coal.
  • In 2012, four city of Detroit departments—Detroit Water and Sewerage Department, Detroit Public Lighting Department, Detroit Department of Public Works and the Greater Detroit Resource Recovery Authority—were responsible for 93 percent of city government emissions.
  • Trees cover about 23.5 percent of the city and are estimated to sequester 70,400 metric tons of carbon dioxide annually, an amount equivalent to taking 15,000 cars off the road for one year.”

Read more on the Greenhouse Gas Emissions Inventory Project at U of M

Map: Will the M1 Rail Streetcar Serve Detroit Residents?

m1rail_pop

The impact of the M1 Rail 3.3 mile-long streetcar has been an ongoing debate and a number of community organizations have voiced concerns that the M1 Rail does little to serve actual residents of Detroit. The M1 Rail project essentially says the same thing. M1 Rail is looking to serve the “choice rider” to facilitate getting around Downtown and Midtown’s attractions. The private funders joined forces after seeing the failure of public transportation during the Super Bowl in 2006. It is safe to say that the M1 Rail was not conceived of as a transportation option for residents, but rather for visitors.

“[…] the project will affect pedestrians, people in wheel chairs and bike riders. Ironically, the project will also impact bus riders, most of whom will have relatively little use for the trolley.“ (source)

The residential density along the M1 Rail is minimal at best compared to the rest of the city. Utilizing data from the Motor City Mapping project and employing a quarter (0.25) mile “walkable” buffer you can easily demonstrate the low number of Detroit residents served by the M1 Rail. The project site mentions serving 36,000 residents (5% of population based on Census 2010), however that seems like a generous estimation based on the locations of occupied residential and mixed properties located in the 0.25 mile radius of the M1 Rail stations. Just imagine if the streetcar line added just one or two more stops in the Northend, look at all those occupied residential properties that would have gained another transit option.

m1rail_buff

There are hopes for future expansion of the M1 Rail that reaches to the full 9 miles to the 8 Mile Rd. border, but that is up to the new Regional Transportation Authority (RTA) to spearhead. There are also hopes for increased development and new density along the streetcar line. The M1 Rail project often mentions Dallas, Minneapolis, Seattle, Portland, and Salt Lake City all operating with modern streetcar systems – yet they fail to realize that these project were successful because of the existing density where the streetcar lines were built.

I have no doubt that more private money will ensure the M1 Rail is “successful,” it is just unfortunate to watch the failure of future planning and the lack of true support for public transportation systems that benefit Detroit residents.

Map: General Condition of Structures in the Detroit Trumbull Community

dgei-trumbull0001This map comes from the Detroit Geographic Expedition and Institute (DGEI) Field Notes 4, which appears to be after William Bunge left Wayne State University and his name is not on any of the materials. This map features data from a few surveys of property conditions and blight ratings.

The DGEI began focusing on specific communities and neighborhoods in Detroit that were experiencing the ill effects of “renewal.” This particular report focused on the Trumbull community which saw a disproportionate lack of police even with its proximity to WSU and the increasing funding being garnered by the WSU Police Department, the loss of a public playfield (Mattheai) to WSU sports facilities, and the general lack of recreational space.


Detroit Street Map Transparency

det-street-map-transparency

An interesting map from the Digital Collections at DPL, the label reads: “This land is being badly used now, with no direction or purpose for people or industry. Red represents commercial business, blue is industry, yellow residential and black all other uses. See how jumbled it is today.”

Unfortunately, the year is unknown for this map.

Source: Digital Collections – Burton Historical Collections

Map: Ethnic Migrations in Detroit 1900 – 1950

ethnic-migrations-detroit

Thanks to the opening up of the Digital Collections at the Detroit Public Library we now have access to some awesome historical maps.

This one is a fascinating example of the migration paths of various immigrant communities in Detroit.

Source: Digital Collections – Burton Historical Collections

Skillman Foundation Loves Detroit Maps and Data

IMG_1116

I was recently at a meeting with the Skillman Foundation and was happy to find a hallway of maps and data. I only just learned that the Skillman “Good Neighborhoods” were selected because of the higher numbers of children that live in those particular areas. It is always nice to see an organization with a love for maps and data for focused decision-making.

Happy GIS Day Detroit!

det-blueprint.png

There is a critical gap in the utilization of GIS software for community mapping, planning, and visioning in Detroit’s communities. Every library should have access to Detroit datasets and their computers should host free and open source software (FOSS), especially QGIS!

Recent data has demonstrated that 40% of Detroiters do not have access to the internet which makes online and digital map driven solutions suspect in the assessment of impact. The Detroit Digital Stewards and Detroit Digital Justice League are working to implement community-based internet access solutions.

#Maptime hopes to be able to build community knowledge and skills around GIS. Is your community group interested in hosting a mini-workshop? Fill out the form below!

Map: One-Way Streets in Downtown Detroit

det-downtown-direction

From the I-375 Alternatives Study, this map gives a good look at how confusing driving Downtown can often be. The direction of traffic was determined decades ago when Detroit was busting at the seems with jobs and population. Now perhaps these directional streets are just more of a nuisance? Additionally, the historic street grid Downtown has been discombobulated as a result of expressway construction and you are often unable to follow particular streets through to different areas of the city without running into a dead-end at an expressway.

Map: The Empty Business Rings of Detroit

det-rings

I began five years ago looking intensely at the grocery store conundrum in Detroit. There were handfuls of academic writings and news articles about how national and chain grocers abandoned the inner city, in Detroit and other notable cities. This abandoning of the urban core is a phenomena is best understood in terms of chain supermarkets, but the practice and theory applies to many other retailers and business types too. It is also important to look at what kinds of businesses have stayed or expanded in the same space.

det-rings-4

Retail

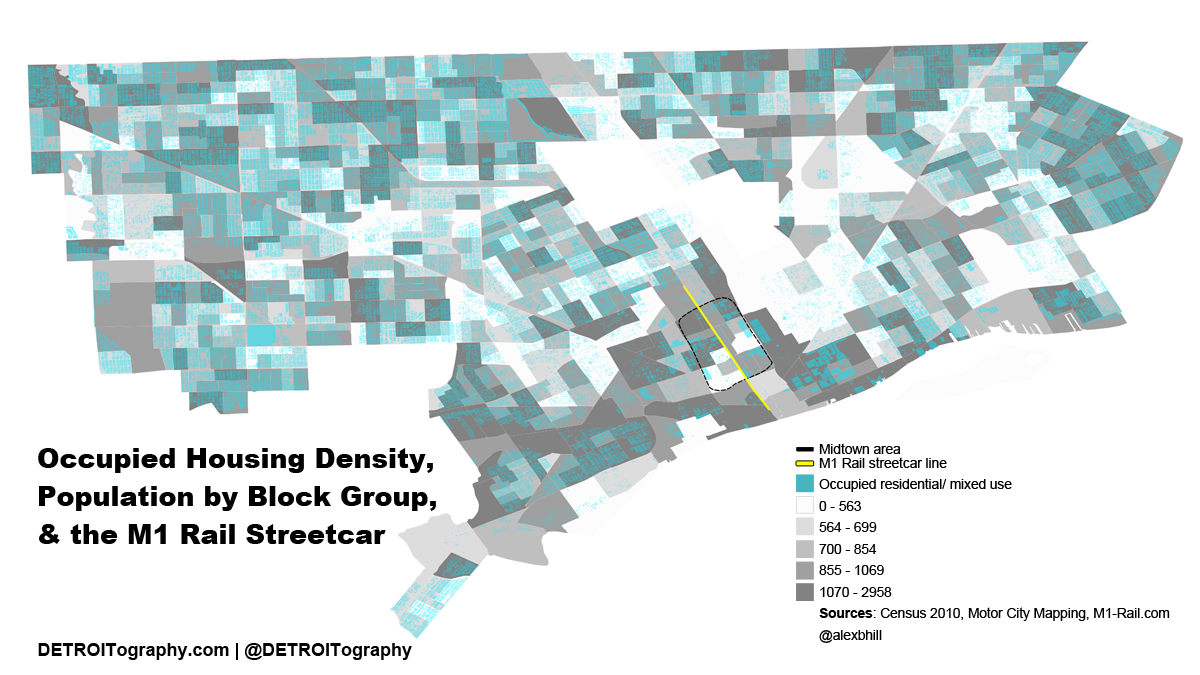
Detroit completely lost its Downtown commercial retail businesses in the half century decline of the city. The commercial core never recovered and even Hudson’s largest department store was torn down. The process of building a series of suburban malls followed the new city planning trend and places like Northland Mall, Southland Mall, and Oakland Mall sprang up. Grocery retail has seen the only real return with Whole Foods building in Midtown and Meijer opening on 8 Mile. The only other national retail chain within the city limits is Home Depot.

The list of the Top 100 Retailers was utilized, including:

  • T.J. Maxx
  • Gap
  • Macy’s
  • Kohl’s
  • Walmart
  • Costco
  • Target
  • Kroger
  • Meijer
  • Whole Foods

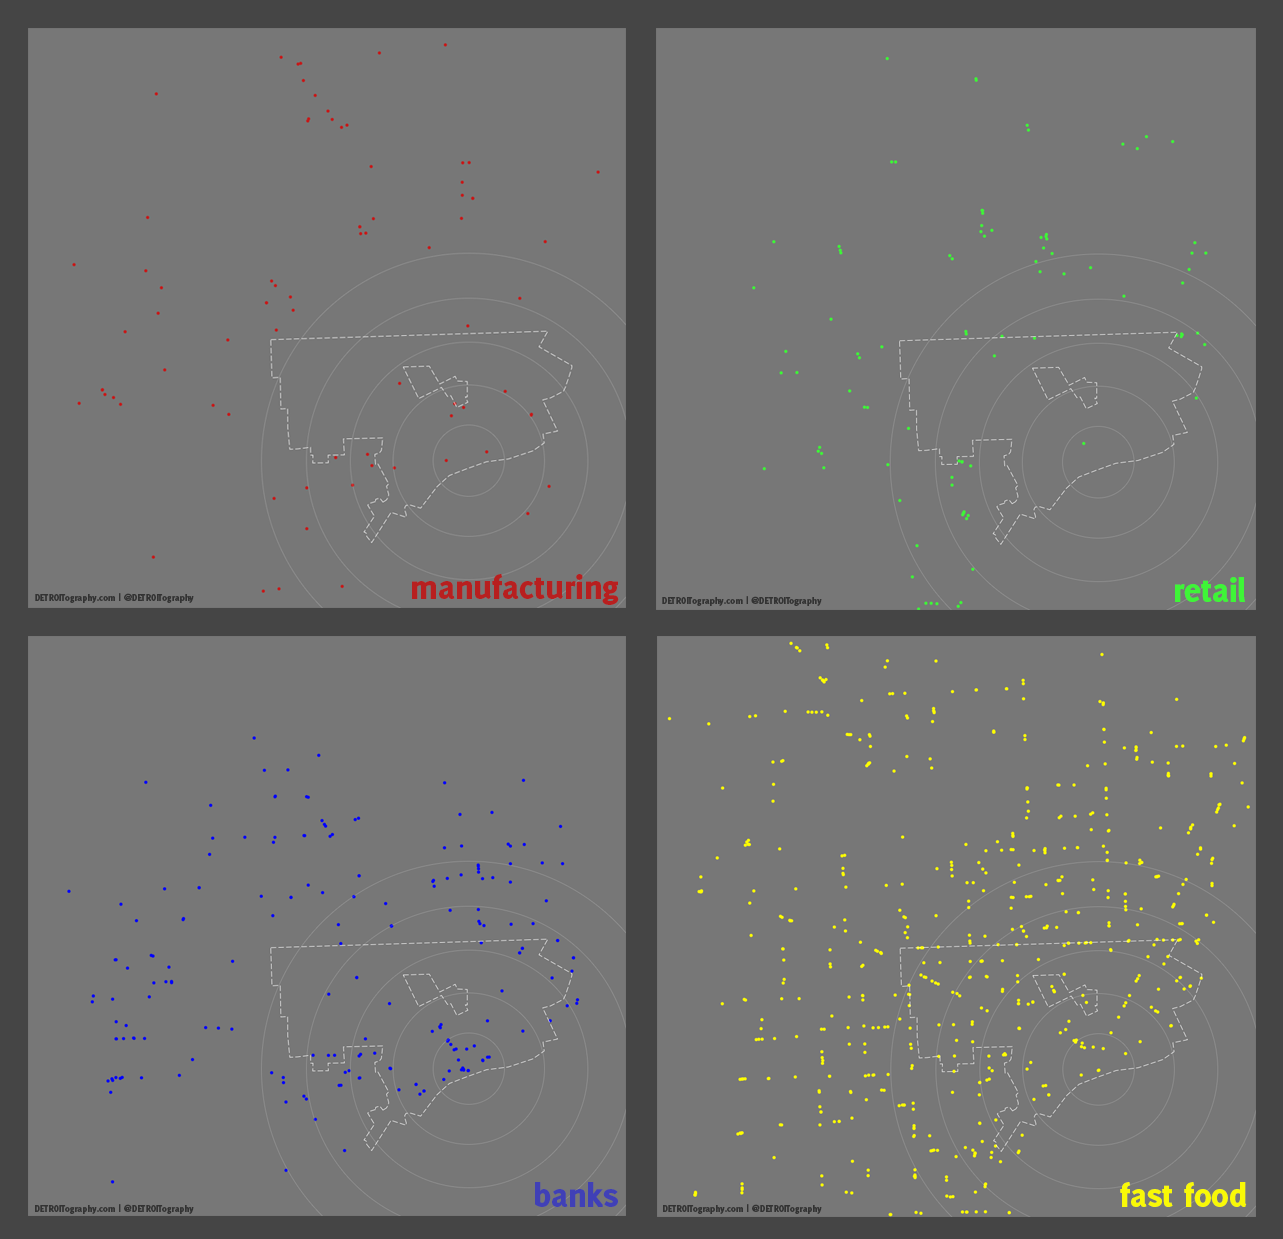
The retailers that have remained in Detroit (and expanded) are small-scale retailers: drug stores and dollar stores which can hardly be compared to big box, national brand retailers. Family Dollar has expanded to almost 50 locations across the city.

Manufacturing

Detroit has also experienced a migration of manufacturing jobs out of the city over the last half century. As global competition increased and labor costs decreased in southern States and then internationally, Detroit’s car building prowess almost completely disappeared. Currently there are a handful of random manufacturing industries scattered across the suburbs with only a few dotting the city landscape. The Crains Detroit list of major Michigan manufacturers was utilized.

Banks

Chase Tower sits just Downtown (not to mention the subprime mortgage lending that decimated black home owners) and Fifth Third Bank recently announced that it will be moving its regional headquarters Downtown. Comerica Bank owns the naming rights to Tigers Stadium and what would a major city be without Bank of America, right?

  • Chase Bank
  • Bank of America
  • Charter One
  • Comerica Bank
  • Fifth Third Bank

Fast Food

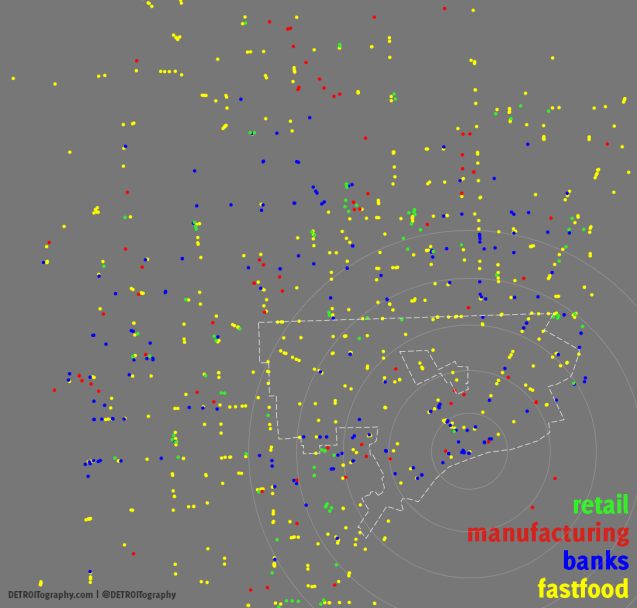
Besides drug stores and dollar stores, a main stay of national brands in Detroit has been the fast food industry. There are a number of local variations of fast food, including coney islands, but these maps just reflect the national brands from Fast Food Maps.

Note

This is looking mainly at national brands and does not account for the many local and independent businesses that have filled the void where national brands have discriminated.
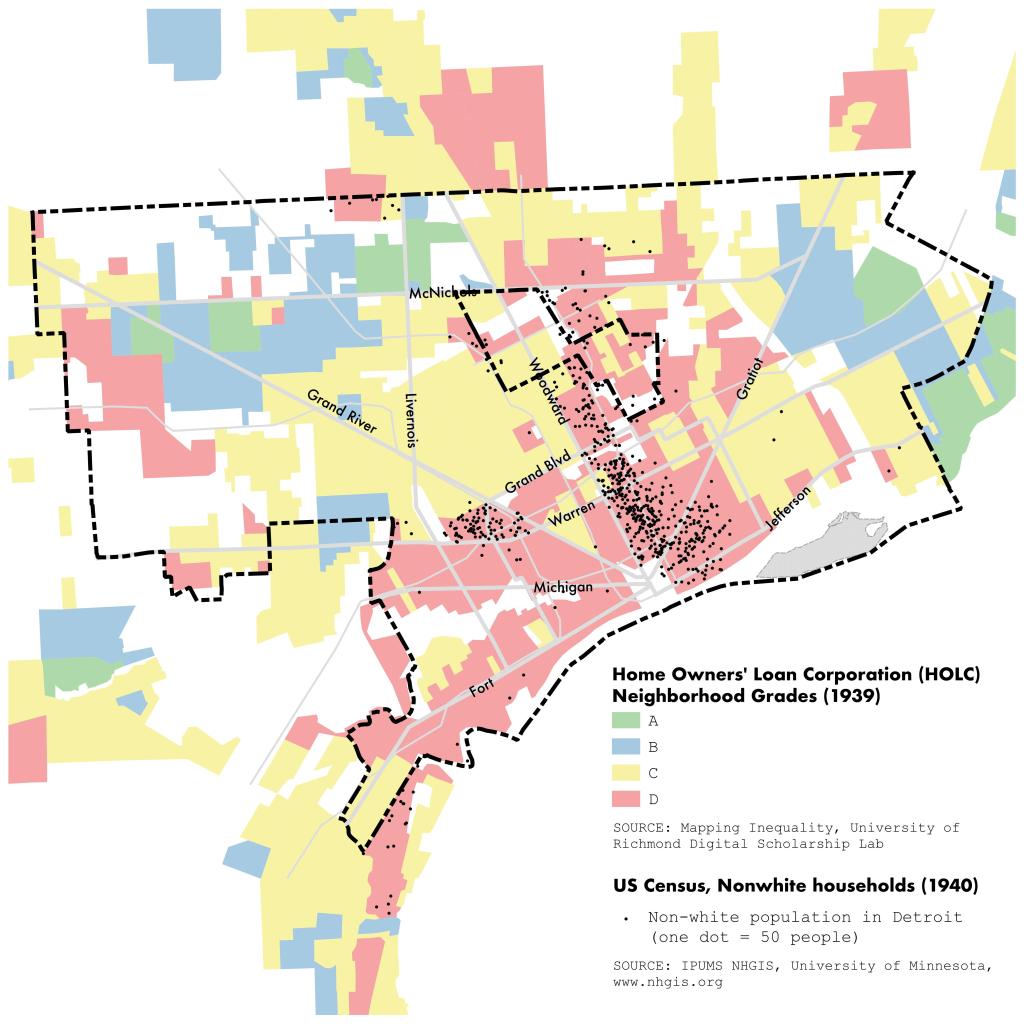
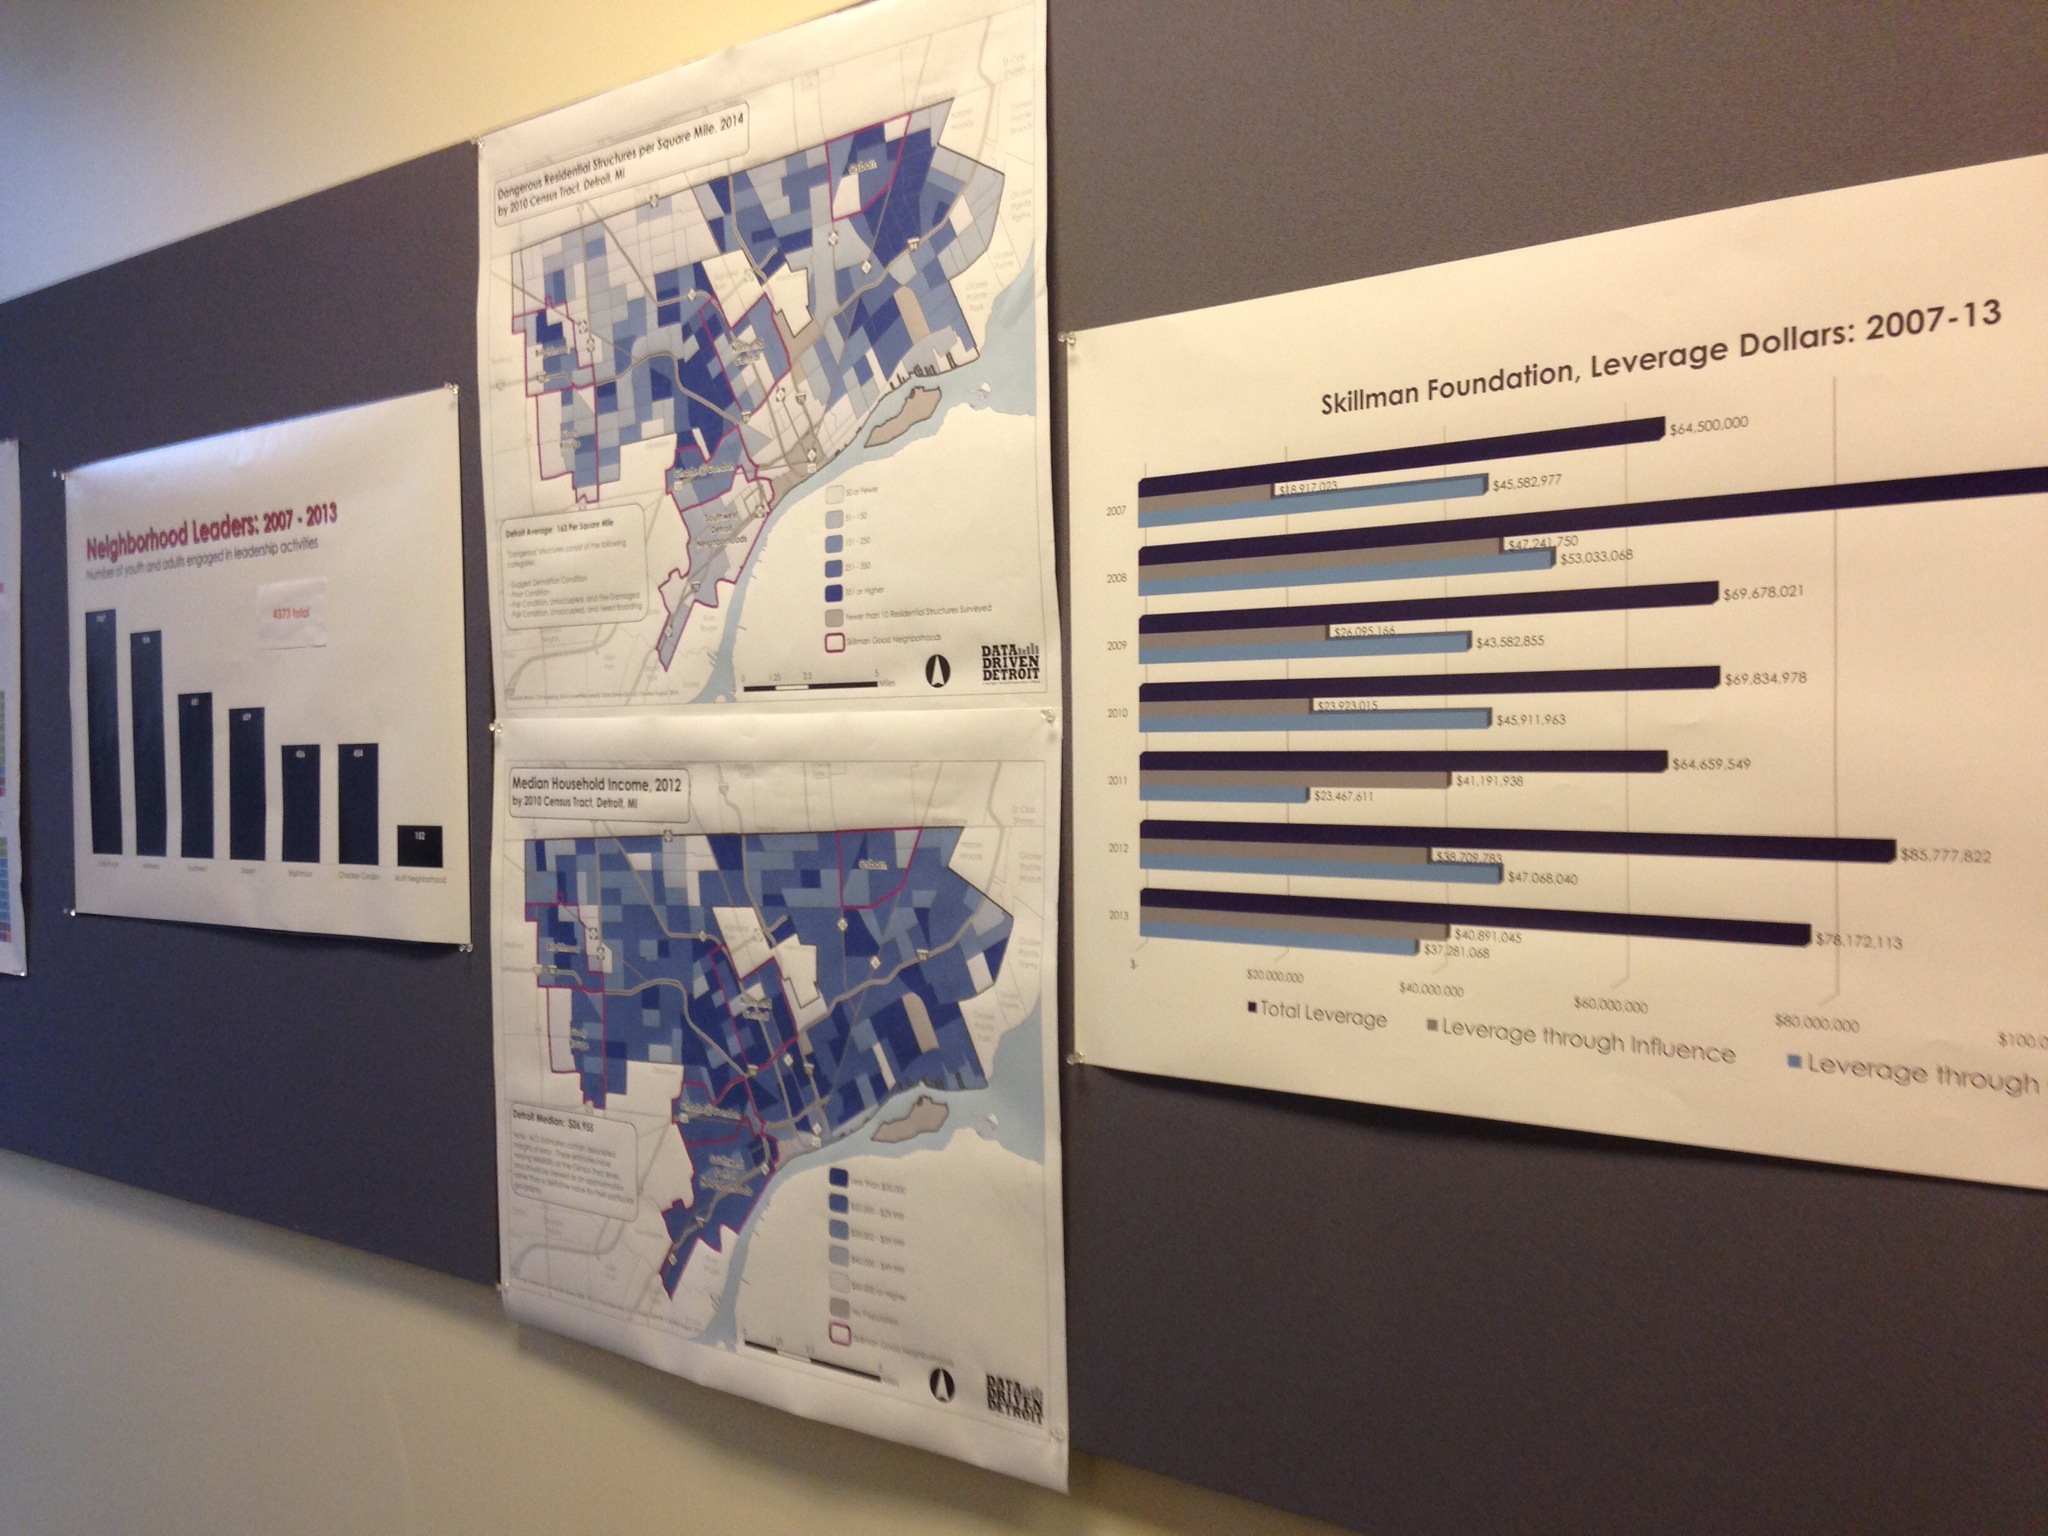
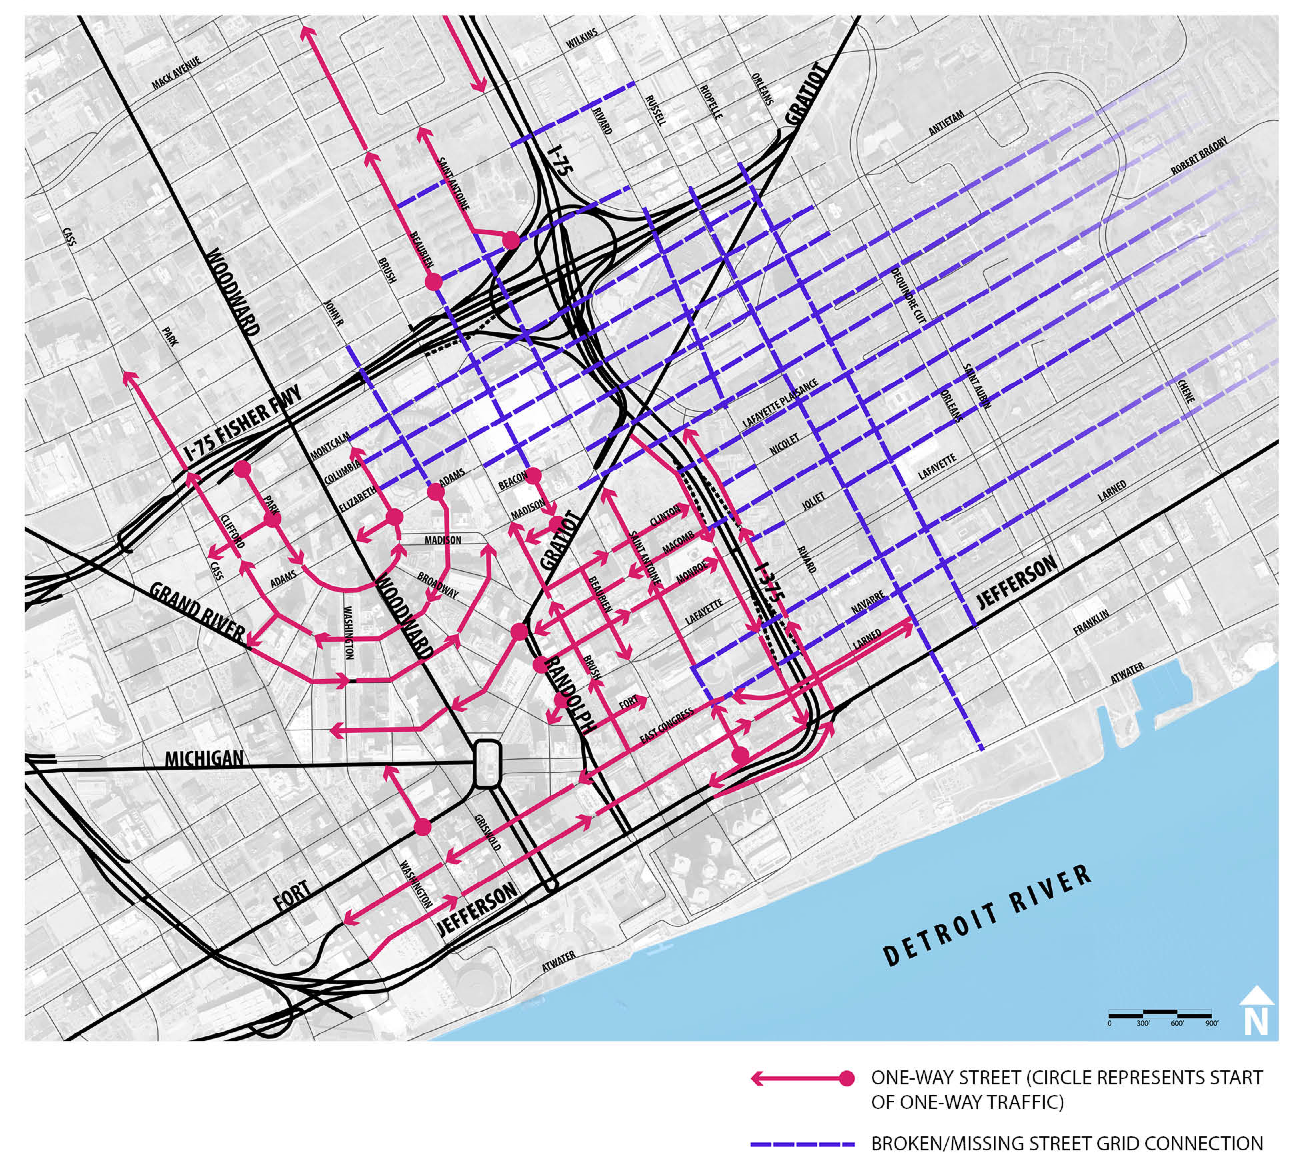
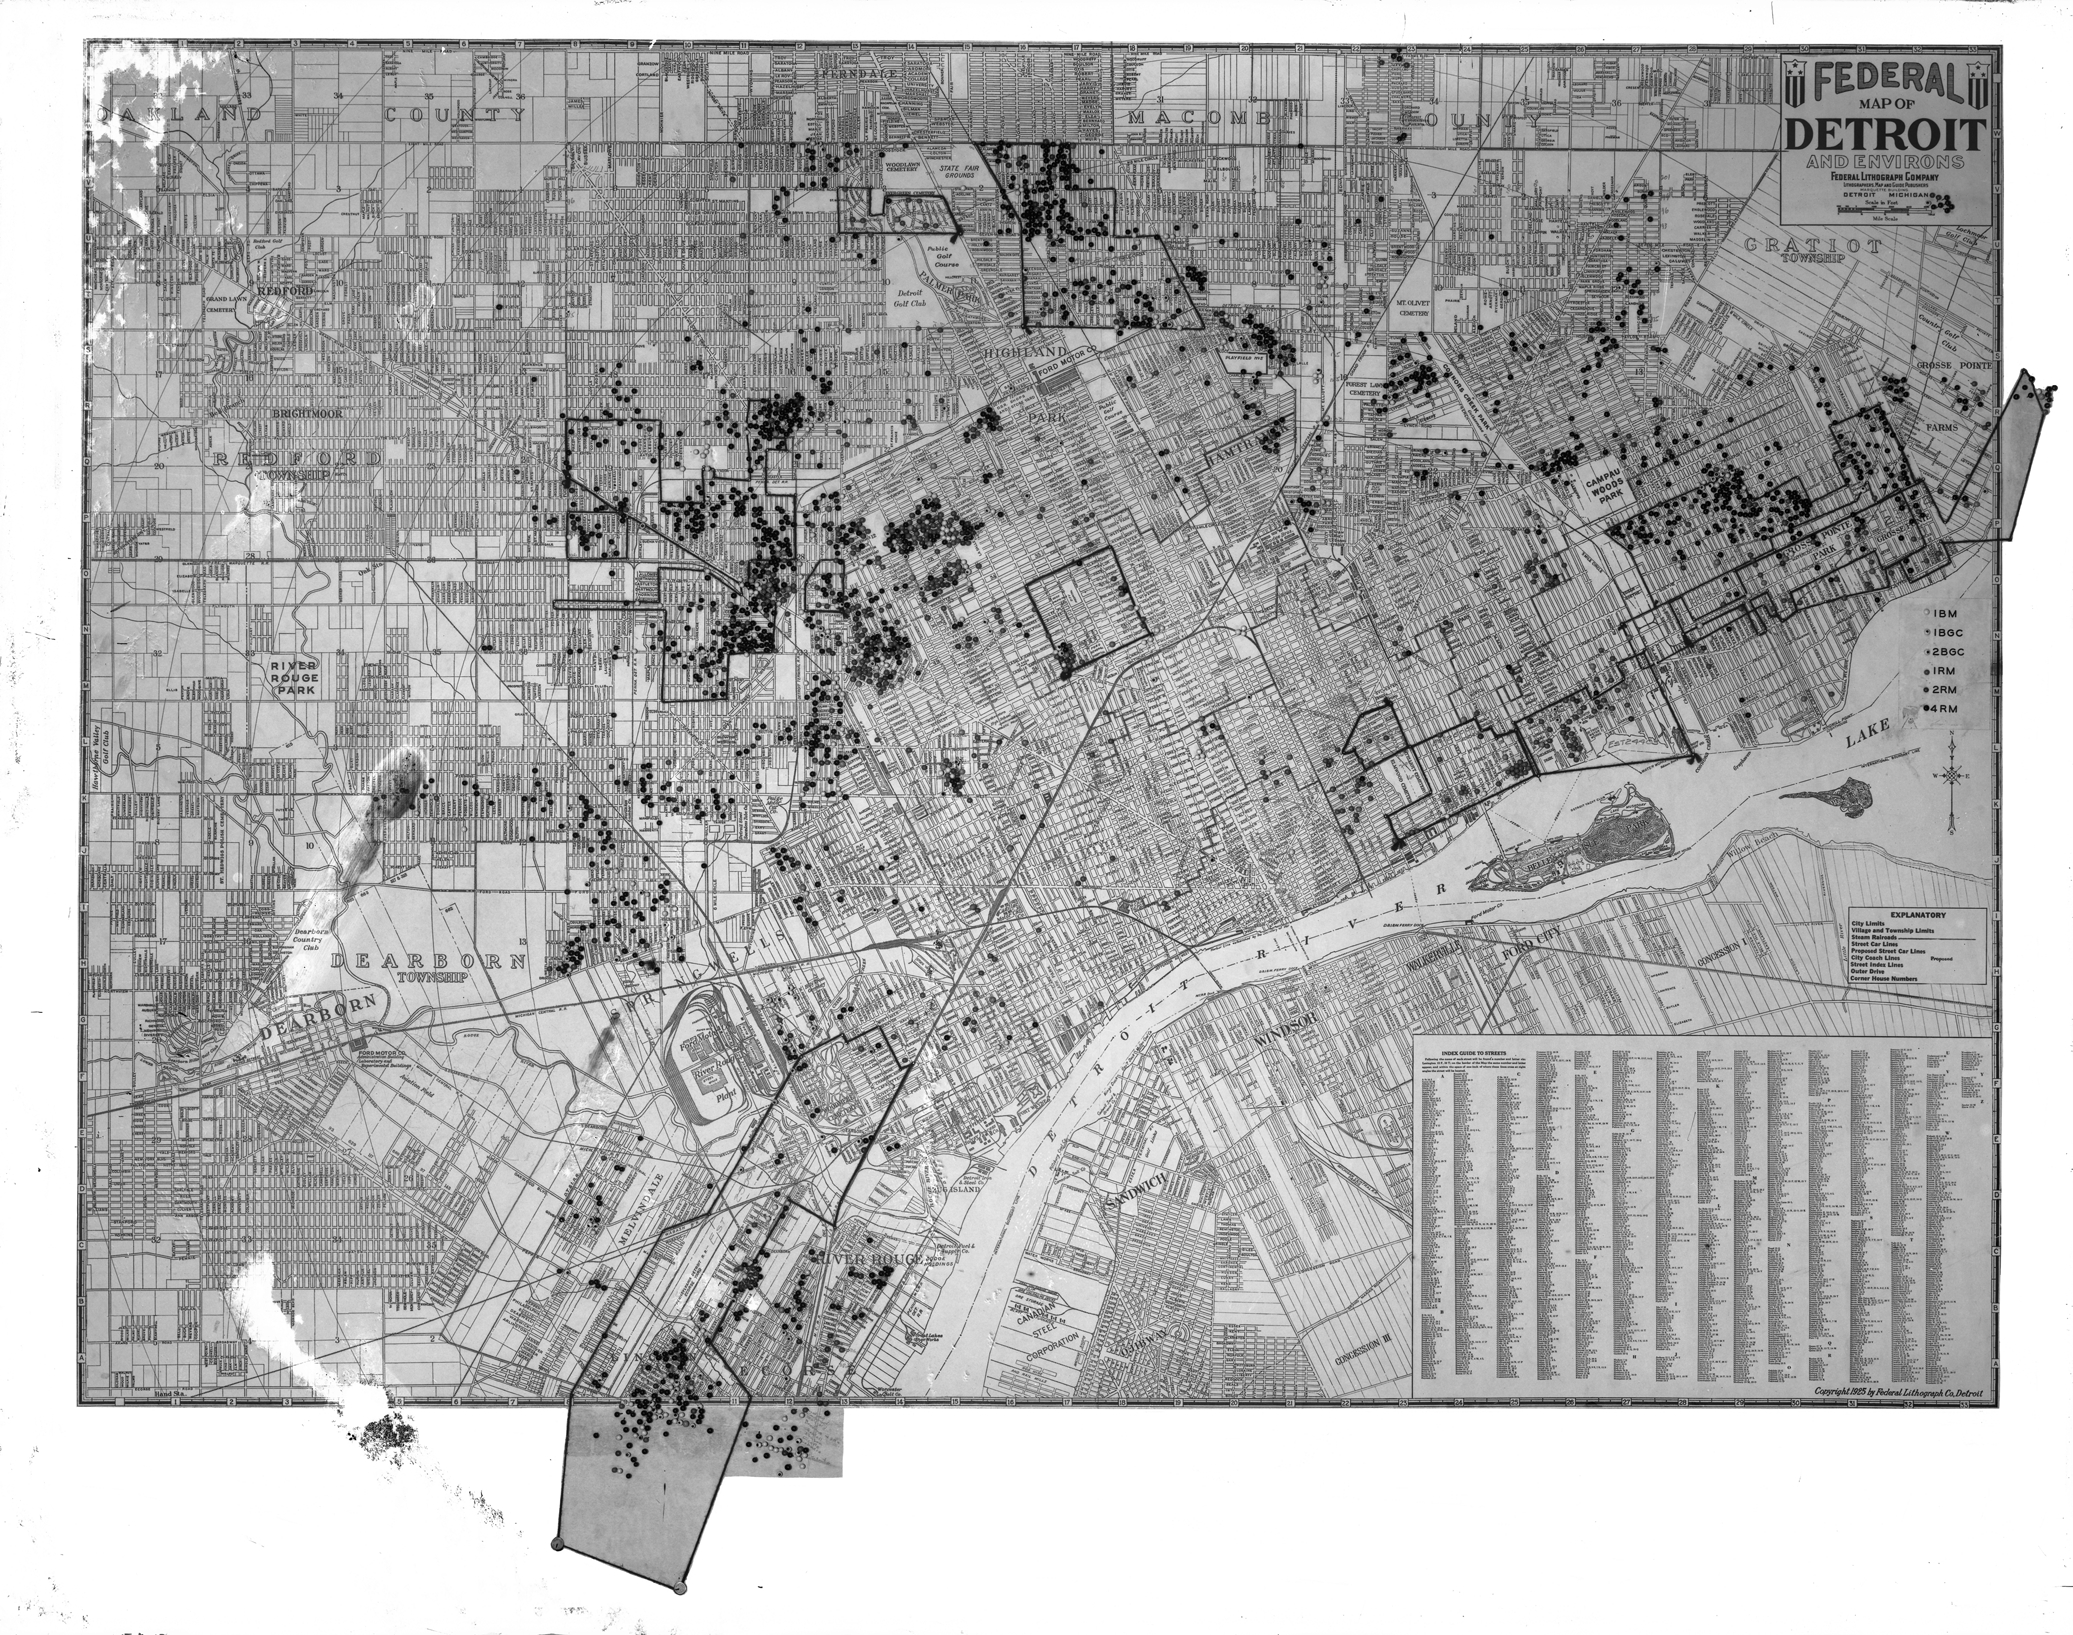
#MaptimeDETROIT Community Mapping Current Practices

IMG_1123-0

The inaugural #MaptimeDETROIT event went very well with lots of great presenters and about 40-50 people in attendance. I kicked off the event with a quick background on what #Maptime is all about as well as the radical cartography of William Bunge and the Detroit Geographic Expedition & Institute (DGEI) focusing their community mapping efforts on the racial imbalance of development in Detroit.

I think it is too presumptuous to say that the different presenters offered “best” practices in community mapping since there were many people who were not in the room and not represented, specifically from many community organizations that have been doing community mapping work for many years.

  • Riverfront Eastside Congregations Iniative (RECI)
  • We the People of Detroit
  • Eastside Community Network/ LEAP
  • Detroit People’s Atlas
  • many more. . .

Here is a compiled highlight reel of current practices in community mapping from each of the presenters:

  • Community Development Advocates of Detroit | Aaron Goodman & Madhavi Reddy

Aaron Goodman talked about how CDAD has recently launched the Detroit Community Organization Mapping initiative to map all of Detroit’s community groups as well as their service areas. Data Driven Detroit is supporting their application to collect information from groups. Madhavi Reddy presented on the CDAD’s “Strategic Community Planning” process where they are invited by community groups to do create a plan for their own community. A critical piece of this process is allowing communities to self define their own “engagement zones.” CDAD hopes that they can work with the City of Detroit in putting together a neighborhood focused master plan since the city is currently operating without one.

  • Detroit Water Brigade | Justin Wedes

Justin talked about the current water shutoff issue in Detroit and their efforts to map community water stations. The DWB spends a lot of time going door-to-door talking with residents about the water shutoffs and other basic needs.

  • Loveland Technologies | Jerry Paffendorf

Jerry gave a nice overview of the Motor City Mapping project as well as the recent additions of Highland Park and Hamtramck (two small cities that are surrounded by Detroit). Jerry talked about meeting with Herb Harris who was the sole bidder on the “blight bundle.” He discussed the water shutoffs in terms of renters vs. owners and believes that many people facing shutoffs are renting and at the mercy of their delinquent landlords. In the same vein, he talked about the depressing nature of the Wayne County Property Auction where Loveland has found a vast majority of foreclosed homes are actually occupied dwellings.

1796028_10204529876422037_3310849275449056618_o

  • Data Driven Detroit | Diana Flora

Diana’s presentation was also focused on the Motor City Mapping project that was completed with Loveland Technologies. However, she was more focused on the implementation process of surveying every land parcel in the city. D3 and Loveland worked with roughly 400 community residents to map the entire city. They are currently working on improving community trainings as well as thinking about best ways to implement mapping tools with community support.

  •  THE WORK DEPT | Nina Bianchi & Libby Cole

Nina and Libby presented specifically about the process of participatory design. They utilizing an ever changing process that builds on itself in their design and mapping work. The Work Dept. is very focused on building tools and processes that others can implement in their communities. They’ve recently worked with Allied Media Projects (AMP) on their internet mesh network toolkit, which has been implemented in Detroit, Kenya, and India.

  • SEMCOG | Jimmy McBroom

Jimmy came with some awesome examples of the available data from SEMCOG. He presented a series of photos that demonstrated the destruction from the 1967 civil unrest as well as the following demolition and widening of Rosa Parks where businesses never recovered. Jimmy highlighted some cool project ideas such as TransitMix, the need to map desired walking paths, and

  • Eastern Market Corporation | Fiona Ruddy

When Fiona started working on food access issues with EMC, there was no one else working to map out locations of farmers markets and other access points. EMC runs the Eastern Market Farm Stand program and works with others such as Fresh Food Share through Gleaners. Now EMC offers a community map every year with different food access locations.

  • Detroit Future City | Erin Kelly

Erin presented on a very specific project focused on the ecology of Detroit land. She is working with the LEAP group on surveying vegetation and making community decisions on what should be done with vacant land. She also spoke to how these plans all fit within the DFC strategic framework plan.

Map: Six-Radial Pattern of Urbanization from Detroit

det-six-radial

From Doxiadis’ “Emergence and Growth of an Urban Region” Volume 1, this map from 1966 helps to demonstrate how and why the idea of “Detroit” extends beyond the city limits. In each of these directions businesses and people took the economy and the idea of “Detroit” with them. The impact of Detroit reaches well beyond the city limits and also the state and national boundary.