Map: Detroit Region Areas of Population Growth 1950 – 1961

Screen Shot 2017-03-26 at 11.33.14 PM.png

This map helps demonstrate the early loss of population from the City of Detroit into adjacent suburbs. From the “Report on Metropolitan Environmental Study: Sewerage and Drainage Problems” this map accompanied a report looking ahead to plan for 1970 needs. In large part the report found that the areas that had the greatest population growth also had the most inadequate systems for sewerage and drainage.

Map: Detroit Rental Value 1940

Screen Shot 2017-04-21 at 8.56.50 AM

This map is included in the Detroit City Plan Commission’s 1946 report titled: “The People of Detroit.”

In regards to rent, the report reads:

“The average monthly rent is a good index of the present economic level of given geographic areas in relation to others. In spite of distortions which may be introduced by a scarcity or abundance of homes, or transportation facilities of distance from work, it is a fair indication of family income. While the average contract or estimated monthly rent for the city was $35.88 at the time of the census in 1940, average rents by census tracts ranged from $18.00 per month in the tracts near the central business district to $120.00 per month in Palmer Woods.”


Map: Where is the Heart of Detroit?

The “heart of Detroit” is a common marketing shtick attempting to show the importance and purported hip-ness of a given location. Sometimes that location is a new development and other times it is a historic place marker.

heart-of-detroit-headlines

Thanks to Aaron Foley’s 2012 Mlive article on this very topic and some more recent google searches, there is nice list of locations assumed to be the “heart of Detroit” and with wide geographic variation.

“My inner cartographer wants the “heart” of the city to be the Dexter/Davison/Linwood near Central High School, which is, uh, central to almost everywhere in the city.” – Aaron Foley

heart-detroit-locations

Heart of Detroit:

  • Midtown
  • Downtown
  • Capital Park
  • Barry Subdivision
  • Belle Isle
  • Central High School
  • W. Grand Blvd.
  • Linwood and Gladstone
  • Diack Park/Playground
  • New Center
  • Corktown
  • Brush Park
  • Woodbridge

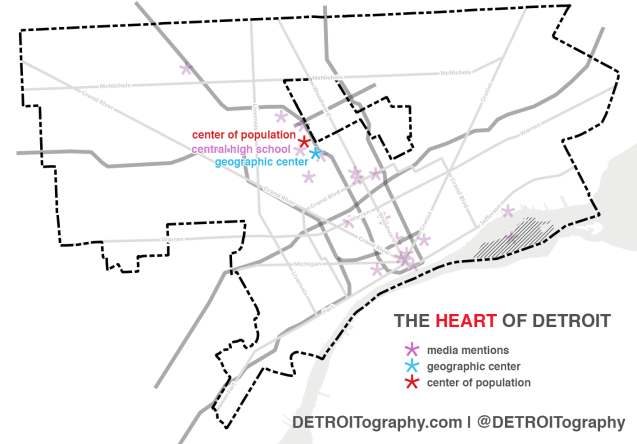
Anyone can claim the “heart of Detroit,” but how can we determine the true “heart” or center? Mathematically we can calculate the geographic center of Detroit.

heart-detroit-geocenter.png

Media mentions are nice and the geographic center is helpful, but it is no mystery that Detroit is a very large area with random clusters of population. Using more math we can calculate the mean “center of population” for Detroit. It seems that Aaron Foley’s “inner cartographer” is spot on!

heart-detroit-popcenter.png

Map: Proposed Play Space in Gratiot-Mack Neighborhood Improvement Plan 1955

Screen Shot 2017-04-06 at 8.20.47 AM


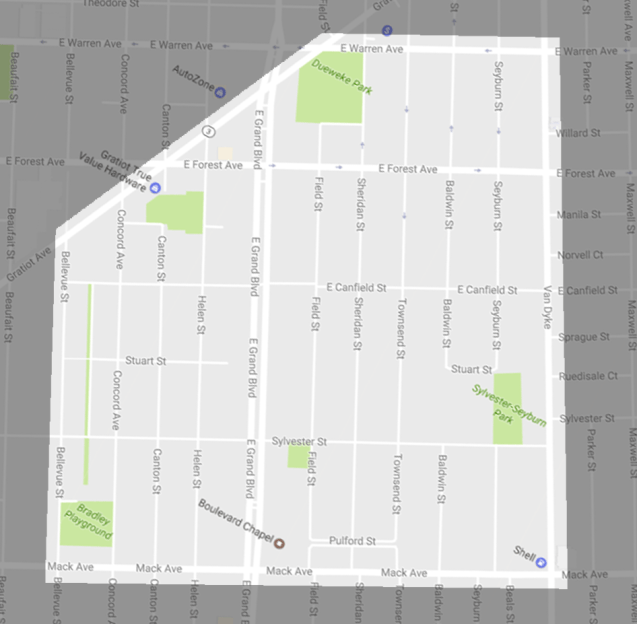
This map is included in the “Summary progress report. Detroit Committee for Neighborhood Conservation and Improved Housing.” The broad goal of the Neighborhood Conservation Committee was a “blight-free” Detroit. The Gratiot-Mack area was the original pilot “neighborhood” where adding new greenspace was seen as a positive for neighborhood stability.

In the Google Maps snapshot below, you can see much of the proposed playgrounds and greenspaces actually did come to fruition, however blight prevention did not have a lasting, long-term effect in the 50 years following 1955.

gmap-mack-gratiot.png

Map: Rouge River Basin in Detroit

IMG_1526

This beautifully designed map comes from none other than a meta-study of flooodplains and flood hazards in the 4 county Detroit region. It’s a very telling analysis when thinking about our current flooding and water drainage challenges.

The map needed a small edit in the legend, so an old school cut and paste method was utilized.

Map: East Riverfront 50-Year Plan 2017

cdnassets.hw.net

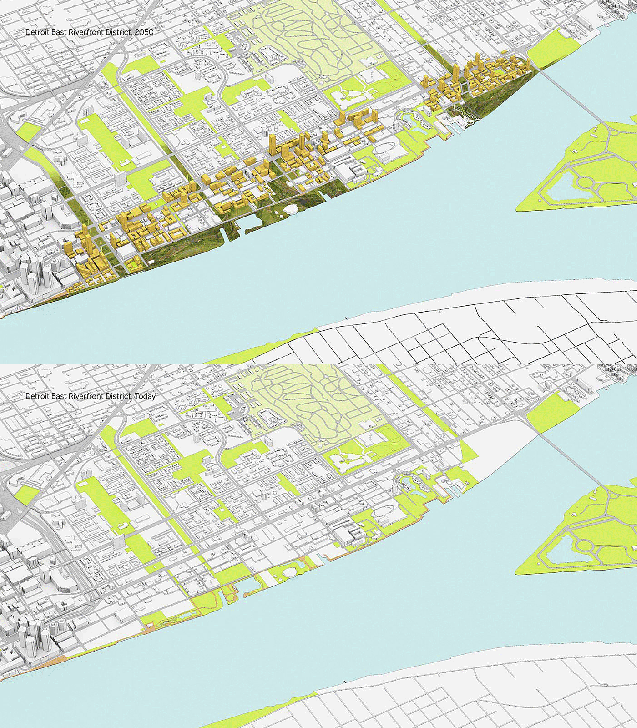
These renderings from Spackman Mossop and Michaels demonstrate the decades-long vision for Detroit’s Riverfront that has arguably been planned since the 1970s. Detroit’s new Planning Director, Maurice Cox, is hoping to see a more vibrant, equitable, and accessible riverfront. Rock Ventures plans to work with GM subsidiary, Riverfront Holdings LLC to redevelop 10 acres of the East Riverfront from surface parking to mixed use.

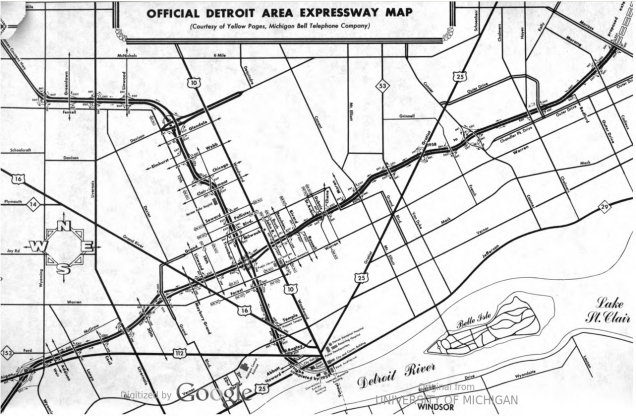
Official Detroit Area Expressway Map 1959

Screen Shot 2017-03-26 at 11.47.26 PM.png

From “An illustrated guide to Dynamic Detroit” by Beatrice Putnam, this map of expressways doesn’t yet show I-75/I-375 or I-96. Only M-10 and I-94 were in existence, but you’ll notice that the Lodge had not yet been labeled M-10 and Woodward Avenue had not been given the M-1 distinction.

Map: Road and Aviation Noise Exposure in Detroit

Screen Shot 2017-03-26 at 9.14.10 PM.png

The Bureau of Transportation Statistics (BTS), I didn’t know it existed either, has released a new map tool showing areas where people are more likely to be exposed to road and aviation noise over a 24 hour period.

Not sure the modeling is quite right for Detroit City Airport? Do planes actually leave from there? If you live in Dearborn or West Detroit you’ll be exposed to a lot of airplane noise from Detroit Metropolitan Airport.

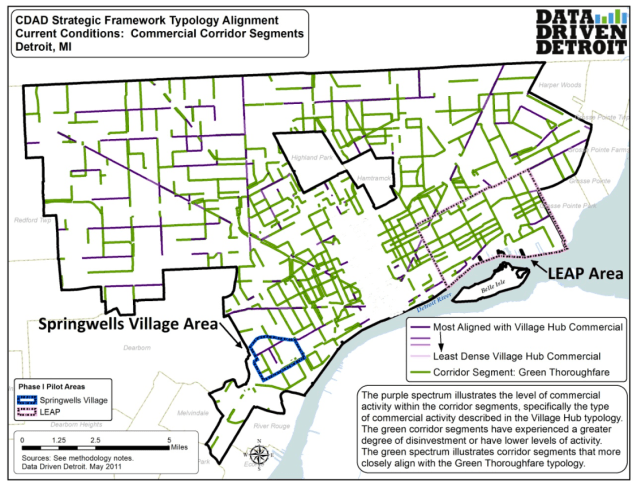
Map: Detroit Green Thoroughfares

Screen Shot 2017-03-16 at 10.12.23 AM.png
As part of CDAD’s Neighborhood Revitalization Strategic Framework, Data Driven Detroit identified a series of green thoroughfares based on vacant lots and vacant businesses.
The green corridor segments have experienced a greater degree of disinvestment or have lower levels of activity. The green spectrum illustrates corridor segments that more closely align with the Green Thoroughfare typology. This analysis is limited to two criteria: the concentration of vacant lots and/or the business vacancy rate.

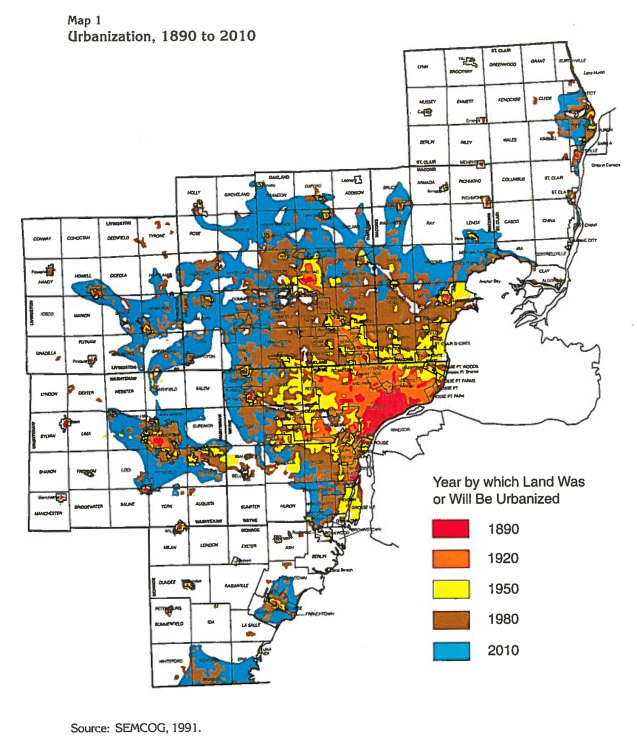
Map: Detroit Region Urbanization 1890 to 2010

semcog-urbanization-map-1991

I was fascinated by this map of urbanization in the Detroit region and attempted to track down the datasets behind the visualization. Little did I know that I would be in for a big surprise. I first reached out to Mark Jones at SEMCOG, who informed me via his colleague Jeff Nutting that there were no datasets and the map had been hand drawn and colored.

Later, Jeff Nutting (a 22 year veteran at SEMCOG) and I discussed the process for creating this beautiful visual. The urbanization data is derived from aerial photos of the region, which are taken every 5 years. Jeff said that they would print out a large map on thin paper, line up the aerial photos under the map, then hand draw polygons for various land uses.

The urbanization map was derived from a combination of several years of land use maps that were then hand colored. Urbanization maps of the 1980s and 1990s could be commonly found in agency reports. Jeff noted that it was unusual to create color maps at the time and most maps that were produced were simply boundaries in black and white. It wasn’t until the early 1990s that SEMCOG started using a large digitizing table and ESRI ArcInfo running on Unix workstations for mapping.

Map: Detroit Garden Soil Sample Tests 2004-2016

2016_KGD_Soil-Test-Map

Keep Growing Detroit offers soil tests to its network of gardeners (Garden Resource Program) and has since collected quite a large dataset of soil samples specifically looking for lead in the soil. The soil samples are obviously taken in sites where people are active and so high lead tests match fairly well with areas that have high childhood lead exposures. The areas with the darkest red test results also appear to match historic industrial sites in Detroit where soils may be forever contaminated.

Beautiful Detroit Map at Shake Shack

image1

This is not a restaurant endorsement, but if you’ve got maps on the walls I’m much more likely to eat there. Michigan’s first Shake Shack opened at the end of February in the First National Bank building Downtown.

Photo credit: Nora Birch

Update 03/13/17: Map by Jesse Kassel. She won’t have this exact map available for sale, but notes she is working on another similar design that will be available!

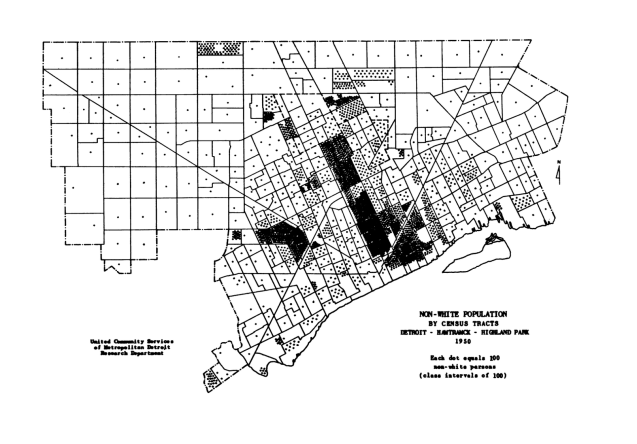
Map: Detroit Non-White Population 1950

screen-shot-2017-03-06-at-7-08-15-am

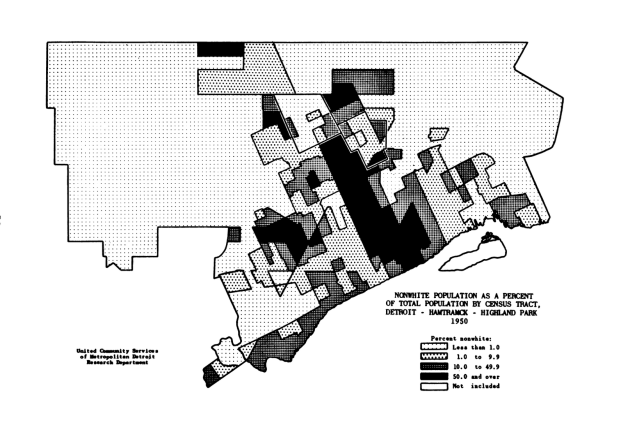
In a report titled: “The Non-White Population of Metropolitan Detroit: The Number and Distribution of the Non-White Population in the Metropolitan Detroit Area: 1950 and Earlier Censal Years,” the United Community Services of Metropolitan Detroit Research Department published pages and pages of data tables and maps.

screen-shot-2017-03-06-at-7-09-40-am

Map: Detroit Neighborhood Opportunity Change 2000 – 2010

screen-shot-2017-03-06-at-7-02-40-am

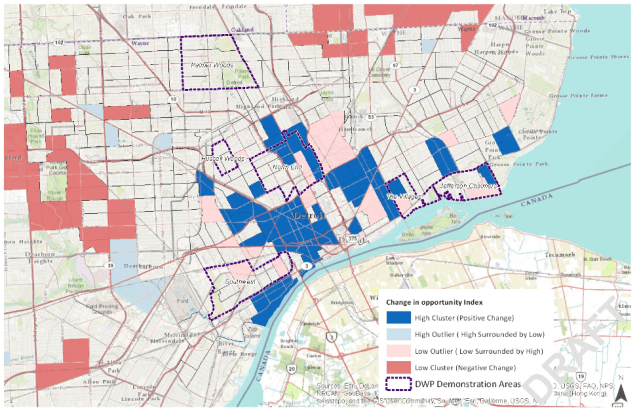
The Kirwan Institute at Ohio State University (OSU) has been developing an “opportunity index” for a number of years. In a 2014 presentation to the Kresge Foundation they conducted an analysis of the change in opportunity between 2000 and 2010 for “neighborhoods” (census tracts) in Detroit. There are a number of areas with positive change, but they are very concentrated in Greater Downtown with more absolute negative change focused in outer neighborhoods.

Map: Respiratory Risk in Detroit

respiratory-hazard-midb-ems_v2

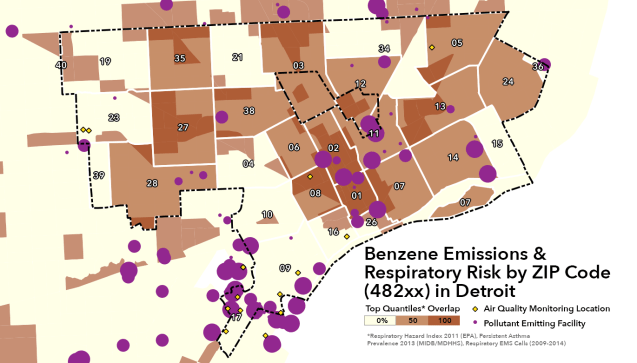
Air quality is extremely difficult to capture due to changing wind direction (generally moving from SW to NE), temperature change, size of the Detroit-Windsor airshed, and various other factors. Measuring air quality at a neighborhood level is next to impossible without an extensive network of instruments to collect data in a small area.

A handful of data sources can be helpful in examining the issue, but still lack the necessary specificity. This is highlighted in Southwest Detroit where persistent asthma, emergency calls, and respiratory risk are all categorized as low even while there is such a high density of pollution emitting facilities.

Many anecdotal accounts of teachers keeping a drawer full of inhalers and inhalers being sold for cash on the street all indicate that respiratory risk is higher in Southwest Detroit than the data show, but people are likely not utilizing emergency and other health services.

Map: Campus Martius Square in Detroit

screen-shot-2017-03-01-at-7-50-45-am

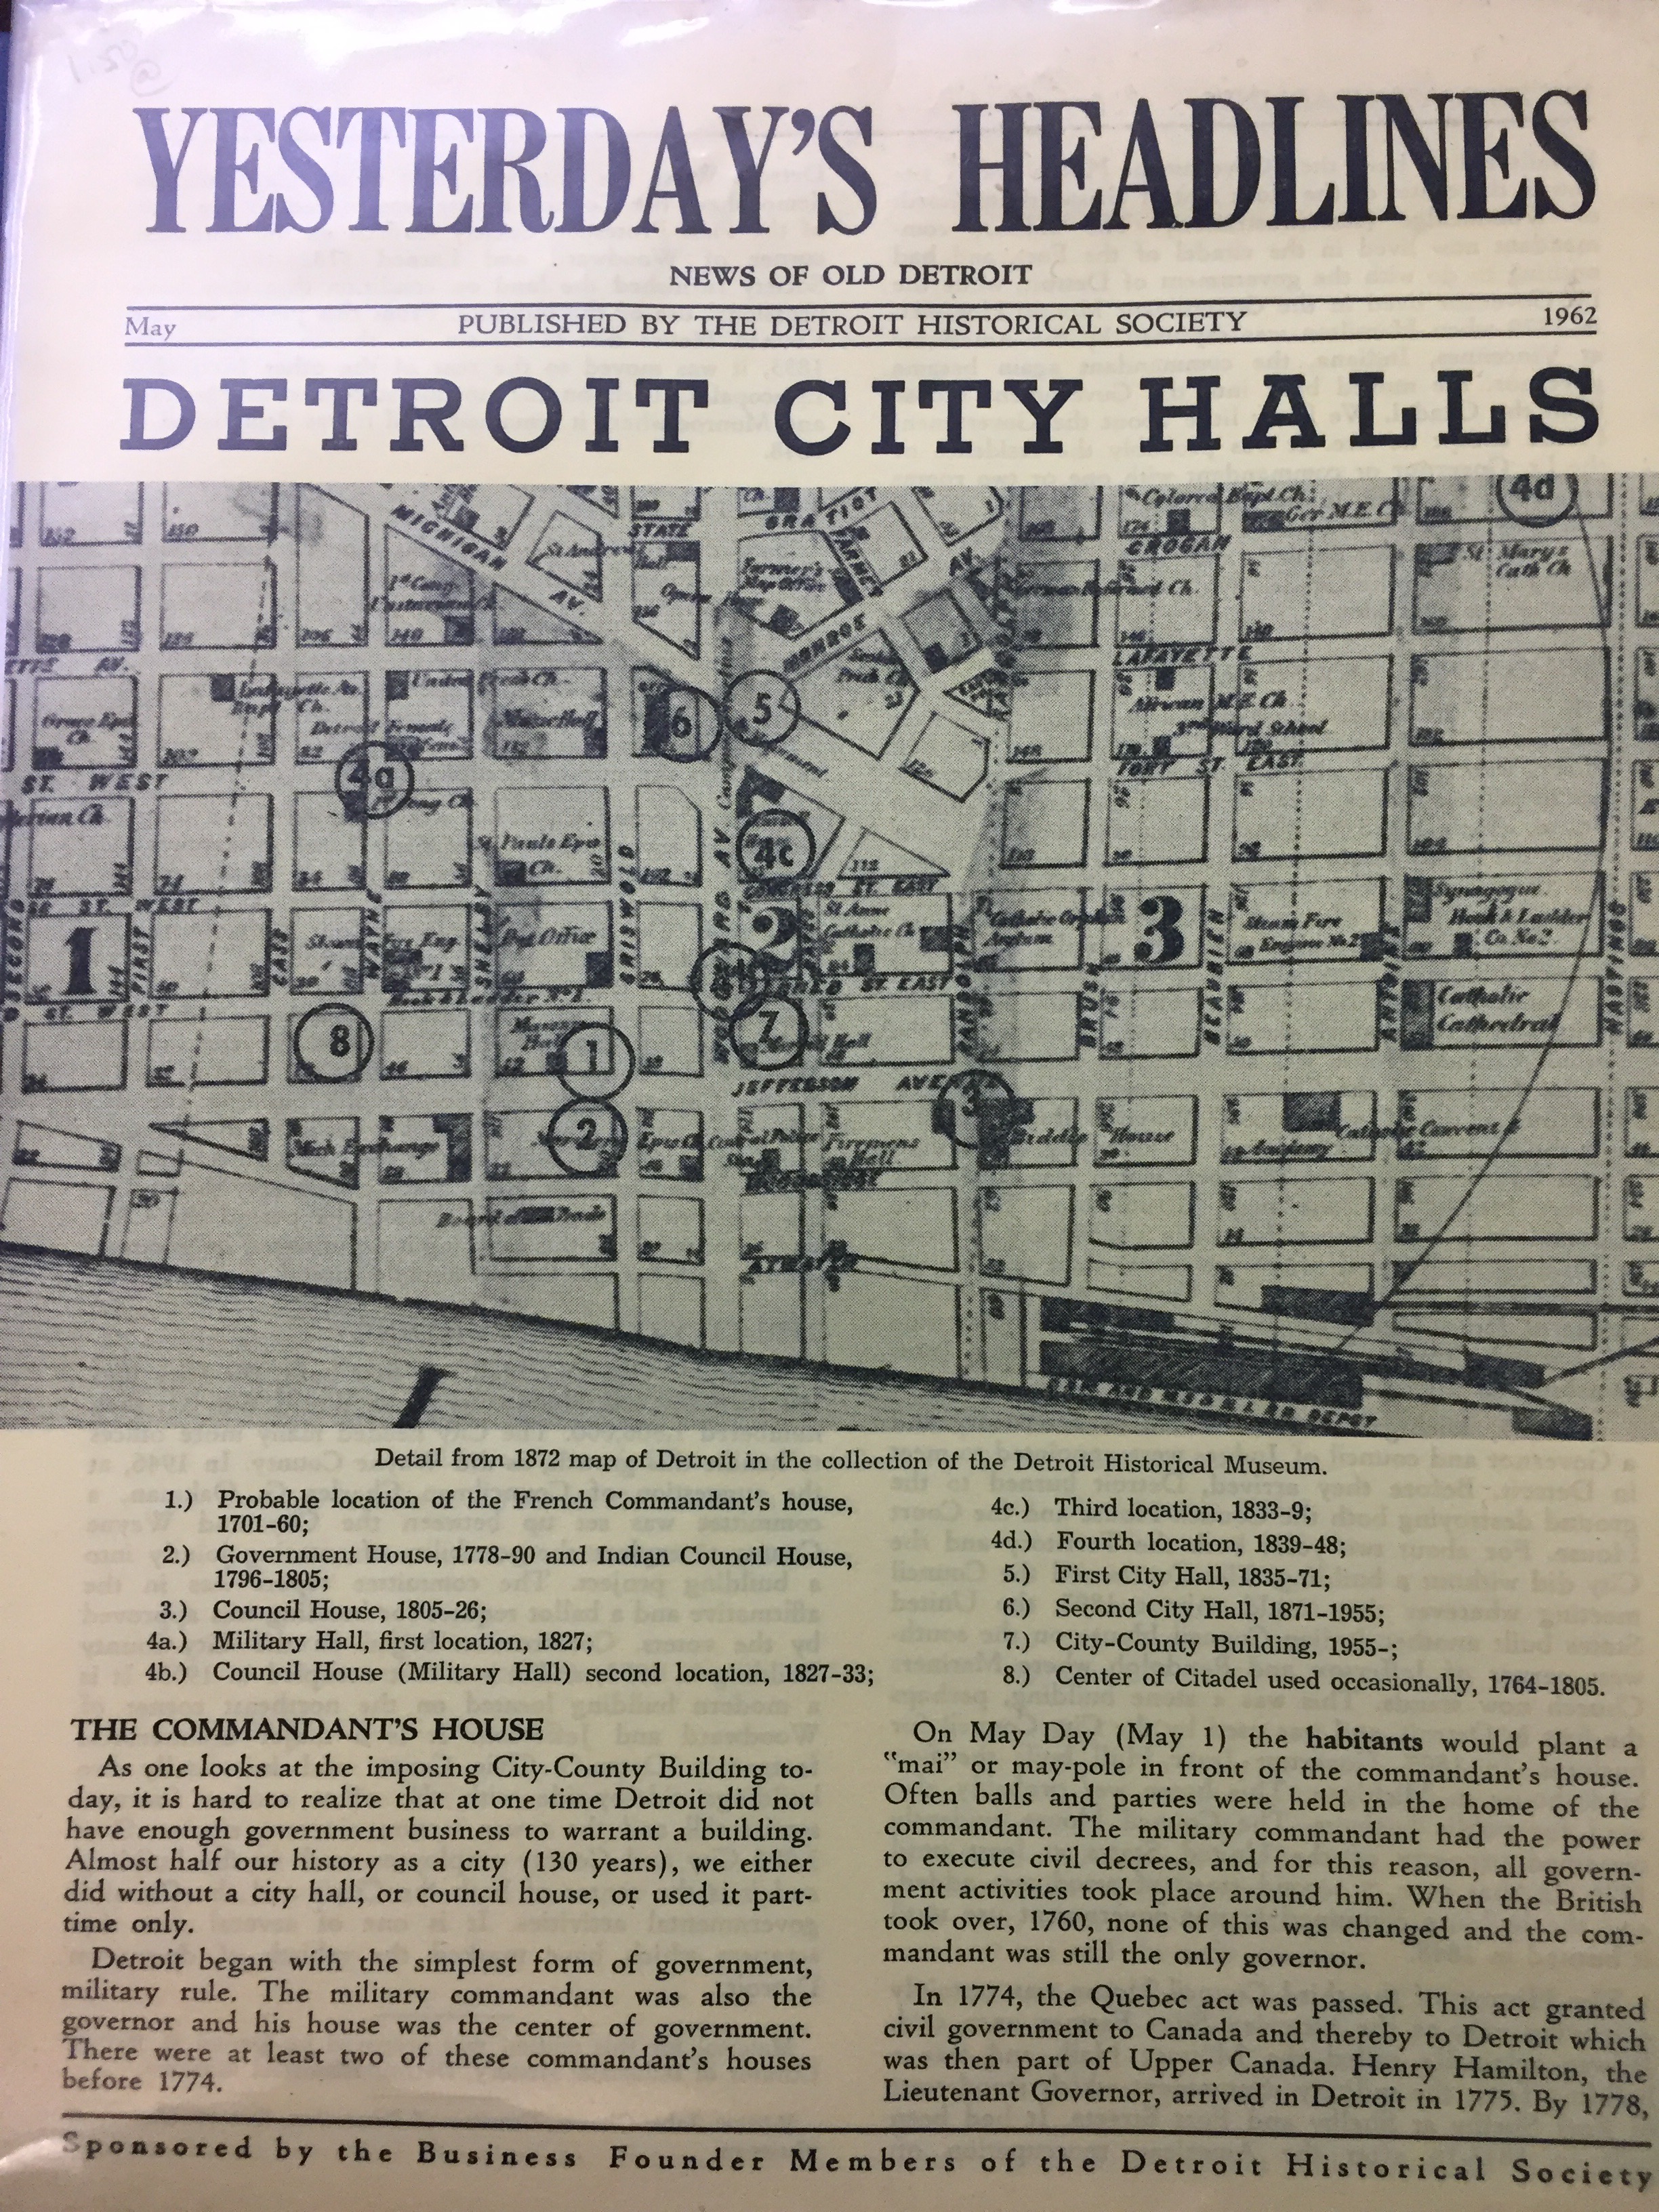
This historic map comes from the writings of none other than Clarence Burton himself in a volume titled: “Detroit in earlier days : a few notes on some of the old buildings in the city” focused on four specific parcels of land in the city surrounding Campus Martius.

The Campus Martius square used to be the focal point for city government, including Detroit’s original City Hall erected in 1871, an Academy for women’s education (later leased to the University of Michigan for 999 years), and a private railroad depot owned by Edmund A. Brush (later to become the Michigan Central Railroad depot).

Next time you enjoy the Campus Martius beach, think of all the history you are sitting on.

Map: Preferred Bicycle Paths in Detroit 2006

preferred_bicycle.png

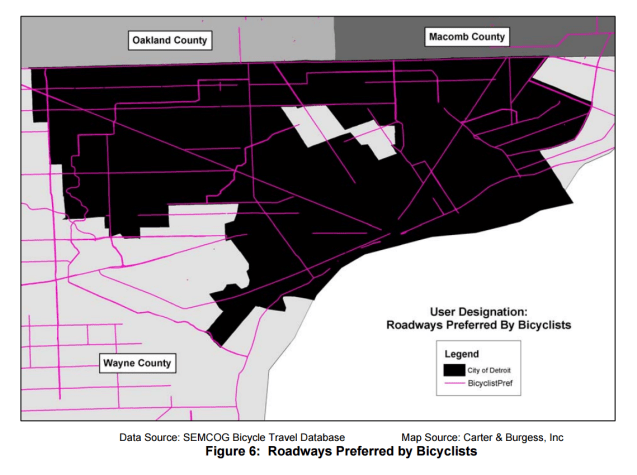
This map comes from the June 2006 City of Detroit Non-motorized Transportation Master Plan. The report notes the need for more bicycle parking and bike lanes (395 miles), all of which would be incrementally added as regular maintenance and upgrades occurred.

Among the many ideas and proposed plans, the report called for Mayor Kilpatrick to convene a Non-motorized Taskforce to implement, educate, and use of a new non-motorized system.

Streets should be swept regularly, with priority given to those with higher bicycle traffic. (Page 43)

Map: Comparative Health Rating for Sections of Detroit 1920-1921

Screen Shot 2017-02-20 at 8.27.36 PM.png

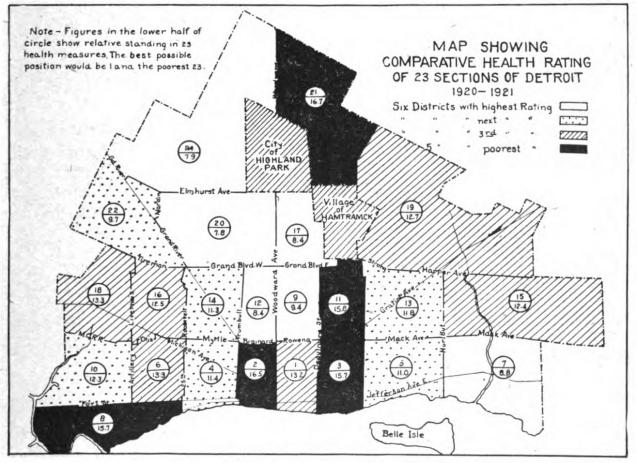
In 1922, the health of Detroit was marked by a spike in measles cases. Infant mortality was through the roof at 87.6 deaths per 1,000 births.

This map in particular ranks each of Detroit’s 23 sections at the time by aggregating 23 different health indicators.

Map: Predicting Gentrification in Detroit with Longitudinal Census Data

screen-shot-2017-02-19-at-5-54-48-pm

Ken Steif and his team at Urban Spatial note the Urban Institute’s call for an early warning system for gentrification in US cities. In response, they decided to start analyzing data and building models to help predict gentrification potential. The above map is based on models run with 2000 and 2010 data to forecast at the census tract level for the year 2020.