I was fascinated by this map of urbanization in the Detroit region and attempted to track down the datasets behind the visualization. Little did I know that I would be in for a big surprise. I first reached out to Mark Jones at SEMCOG, who informed me via his colleague Jeff Nutting that there were no datasets and the map had been hand drawn and colored.
Later, Jeff Nutting (a 22 year veteran at SEMCOG) and I discussed the process for creating this beautiful visual. The urbanization data is derived from aerial photos of the region, which are taken every 5 years. Jeff said that they would print out a large map on thin paper, line up the aerial photos under the map, then hand draw polygons for various land uses.
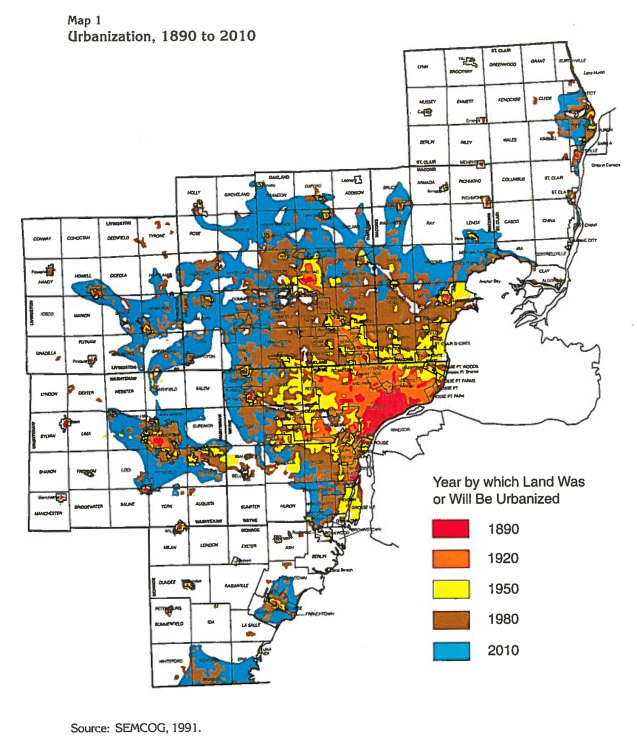
The urbanization map was derived from a combination of several years of land use maps that were then hand colored. Urbanization maps of the 1980s and 1990s could be commonly found in agency reports. Jeff noted that it was unusual to create color maps at the time and most maps that were produced were simply boundaries in black and white. It wasn’t until the early 1990s that SEMCOG started using a large digitizing table and ESRI ArcInfo running on Unix workstations for mapping.

Pingback: Map: Tracking Detroit Urban Sprawl 1900 – 2000 | DETROITography