Researchers have long been working to better analyze and model the impact of environmental pollutants. Stuart Batterman, Rajiv Ganguly, and Paul Harbin have a new model that also is visually impactful.
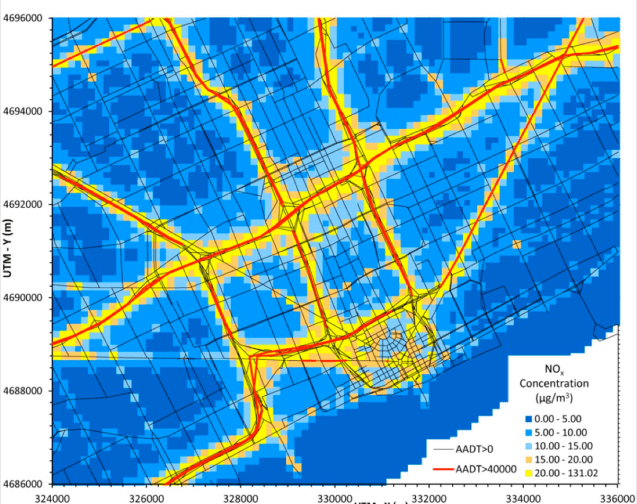
Vehicle traffic is one of the most significant emission sources of air pollutants in urban areas. While the influence of mobile source emissions is felt throughout an urban area, concentrations from mobile emissions can be highest near major roadways. At present, information regarding the spatial and temporal patterns and the share of pollution attributable to traffic-related air pollutants is limited, in part due to concentrations that fall sharply with distance from roadways, as well as the few monitoring sites available in cities. This study uses a newly developed dispersion model (RLINE) and a spatially and temporally resolved emissions inventory to predict hourly PM2.5 and NOx concentrations across Detroit (MI, USA) at very high spatial resolution.
Read more: http://www.mdpi.com/1660-4601/12/4/3646/htm

Pingback: Map: Auto Emissions in Metro Detroit 2017 | DETROITography