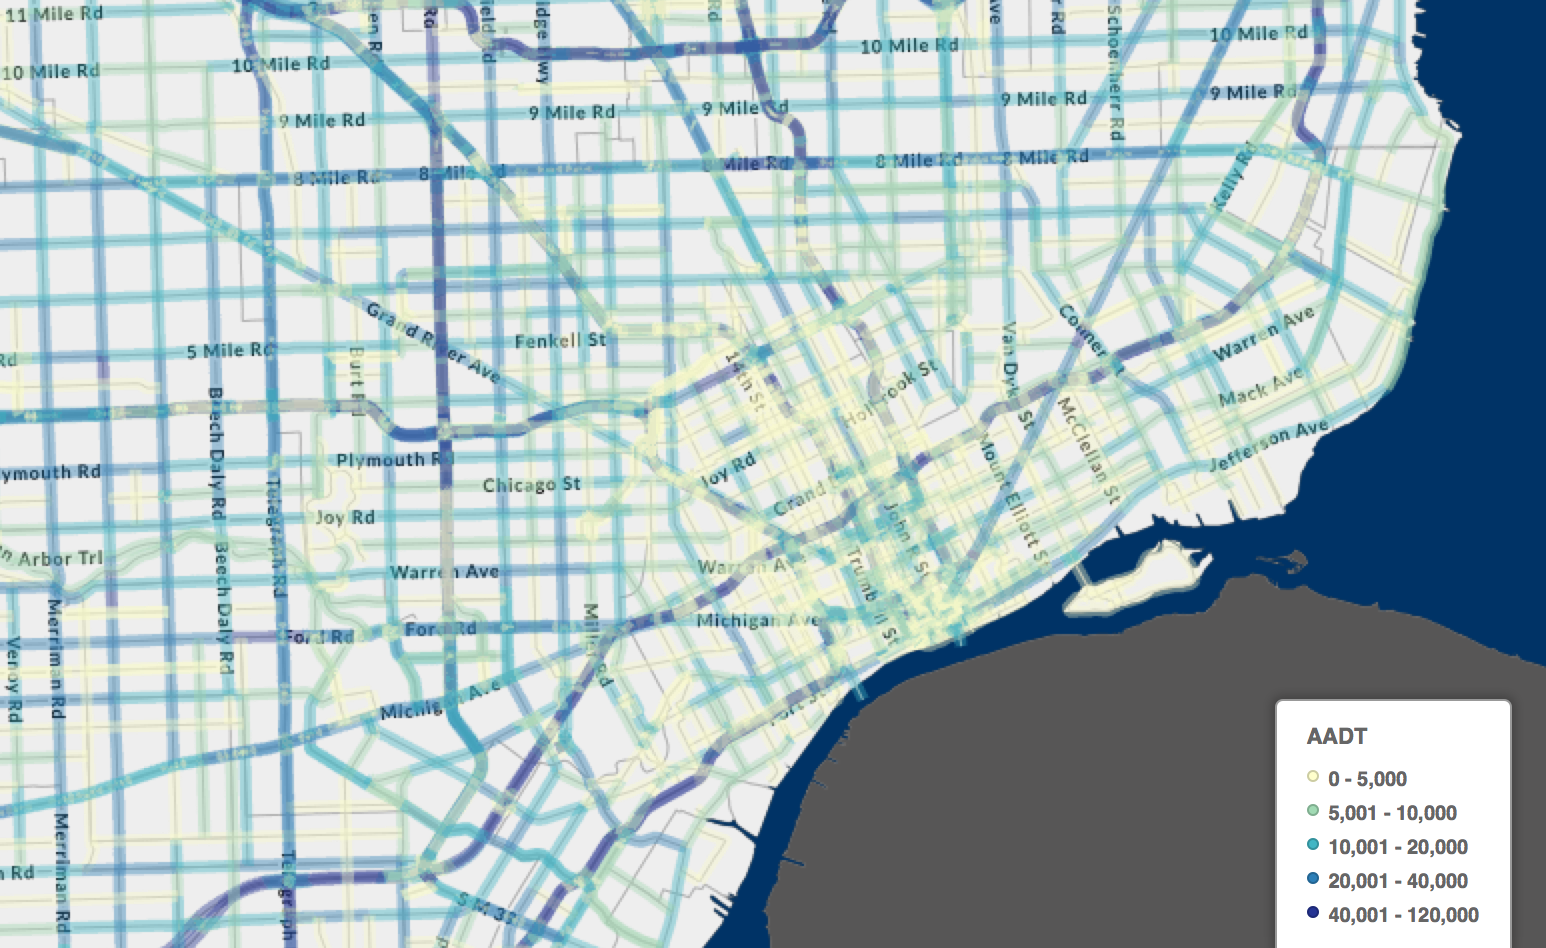
SEMCOG’s traffic volume map represents Average Annual Daily Traffic (AADT) for roads in Southeast Michigan that are eligible for Federal Funds.
The three types of AADT’s represented:
1. Observed – actual counts taken on the segment
2. Interpolated – calculated based on adjacent counts
3. Default – calculated based on county, number of lanes, and functional class.
