After looking into the DDOT data via TextMyBus for a while, I had been very interested in ridership and where people were riding the bus the most. All the issues with DDOT aside, my main question was: ‘what routes were transporting the most people.’ The data that I have obviously doesn’t account for where people got on or off, but rather an aggregate number of riders for the year on a particular route. Not surprisingly, the busiest routes are on Detroit’s main artery roads:
| Agency | Route Num | Name | TOTAL |
| DDOT | 53 | Woodward | 3,029,371 |
| DDOT | 16 | Dexter | 2,549,735 |
| DDOT | 21 | Grand River | 2,399,730 |
| DDOT | 34 | Gratiot | 2,038,153 |
| DDOT | 45 | Seven Mile | 1,573,339 |
The crosstown routes were also busier than others with 7 Mile, 8 Mile, Crosstown, and Jefferson routes all moving at least 1 million riders.
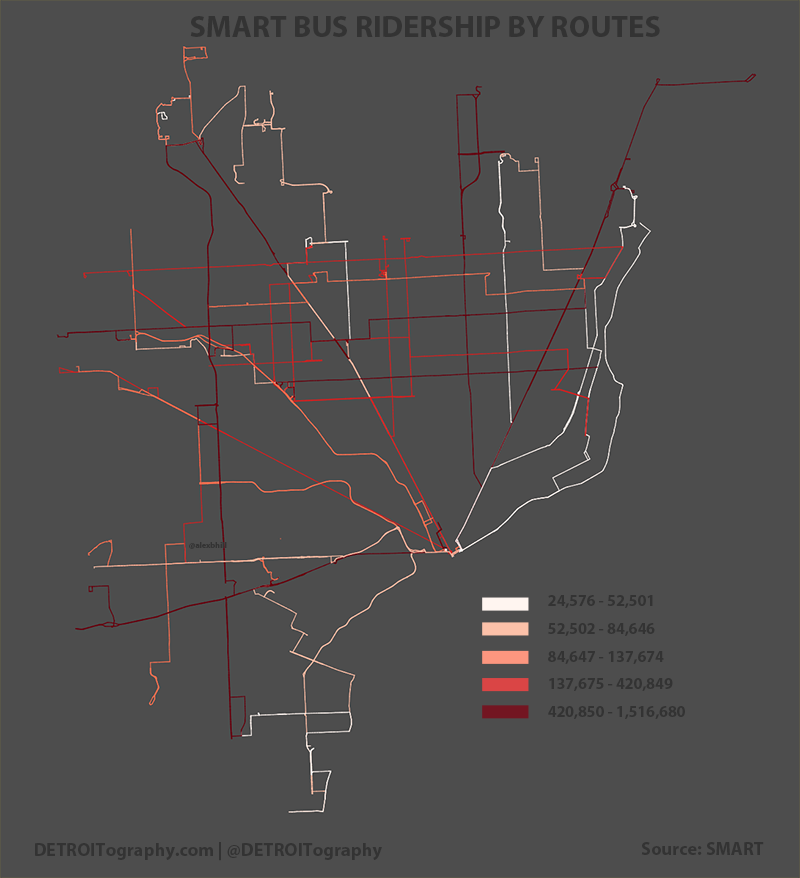
The top SMART routes also follow Detroit’s main arteries (Gratiot, Michigan, Grand River), but tend to have an expected focus on routes that travel North-South from suburbs to city, such as Van Dyke or Southfield-Greenfield. With the passage of the recent SMART millage, these data show that SMART is an important connector for many people to travel between the city and suburbs and vice versa.