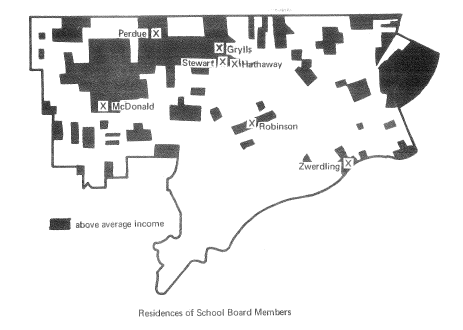
This map comes from the Detroit Geographical Expedition Institute (DGEI) in the Field Notes II paper. William Bunge and the DGEI had a particular focus on children and how social issues impacted children. Field Notes II was a compelling report that highlighted inadequacies and inequalities in the education system of Detroit. This map demonstrated the income inequality of representation on the school board.

Compare this map to the map of Low Vacancy neighborhoods in the Detroit Future City Plan. Above average income in 1970 turns out to be a very strong predictor of low housing vacancy in 2013.