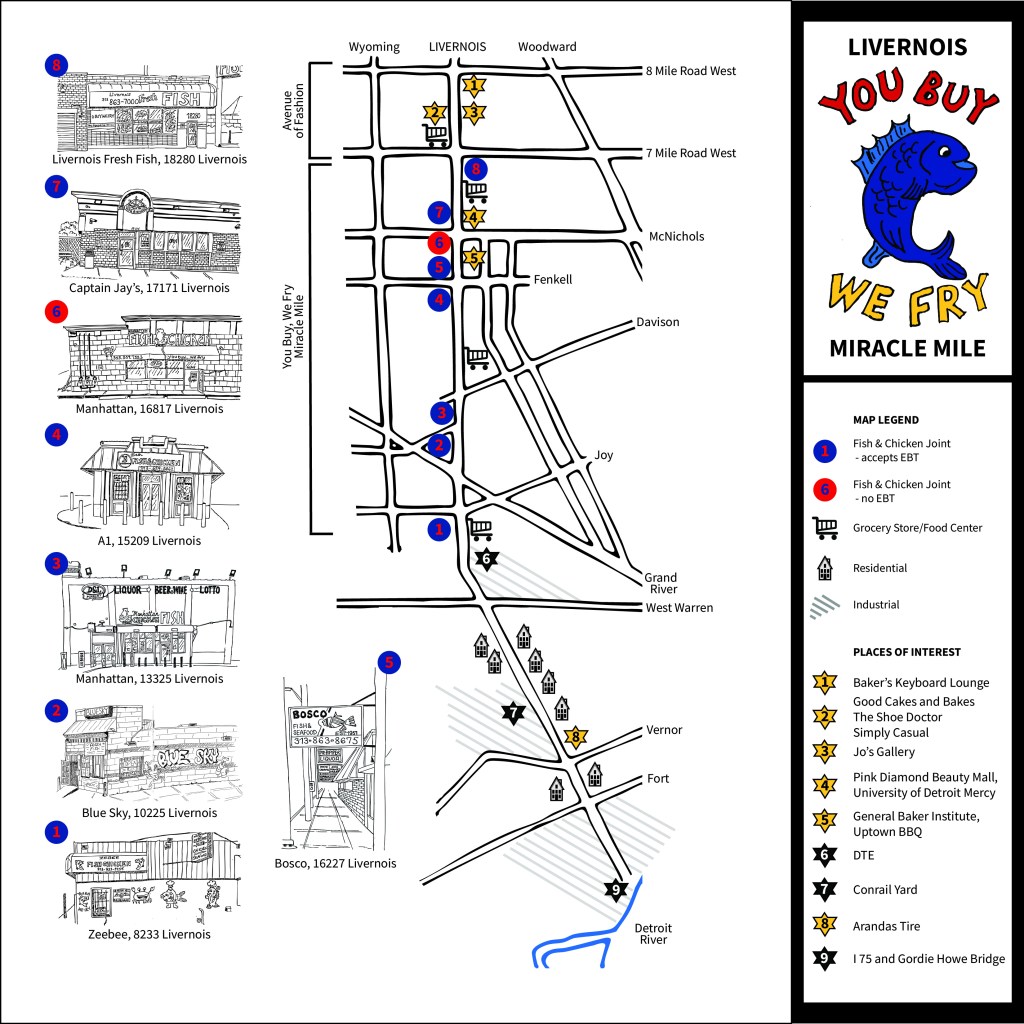
Starting with Zeebee, just south of Joy Road, and running north to Livernois Fresh Fish on the southeast corner of Livernois and Seven Mile, Livernois Avenue has been called the “You Buy We Fry Miracle Mile.” This stretch of Livernois between 8 Mile and Joy is home to both the big names in Detroit Fish & Chicken, Captain Jay’s and Manhattan, and an array of stand-alone independently owned Fish & Chicken Joints.
The longest operating Fish & Chicken Joint on Livernois, Bosco Fish, Seafood and Poultry, just north of Fenkell Street has been cleaning fish for Detroit anglers and serving fish for dinner since 1951.
Both located between Grand River and Fenkell, Livernois highest rated Fish & Chicken Joints on Google are A1 with 4.6 stars and Blue Sky with 4.5 stars.
Detroit’s own Captain Jay’s, founded in 2003 and offering groceries as well as carry-out fish and chicken dishes sits on the opposite side of Livernois from University of Detroit Mercy and the Pink Diamond Beauty Mall.
The other big player in Detroit Fish & Chicken, Manhattan, has two locations on Livernois, one at the busy intersection of Livernois and Davison and the other almost next door to its rival, Captain Jay’s. Unlike Captain Jay’s, Manhattan is not a restaurant chain or franchise but a group of affiliated Fish & Chicken Joints known for their special style of fish and chicken and their lemon pepper seasoning.
All but one of the Fish & Chicken Joints on Livernois accept EBT.
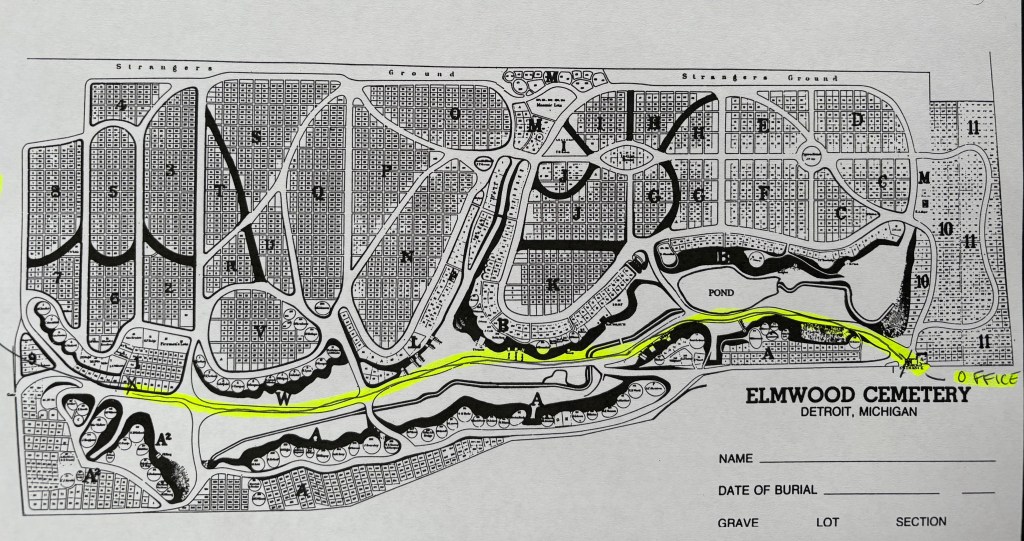
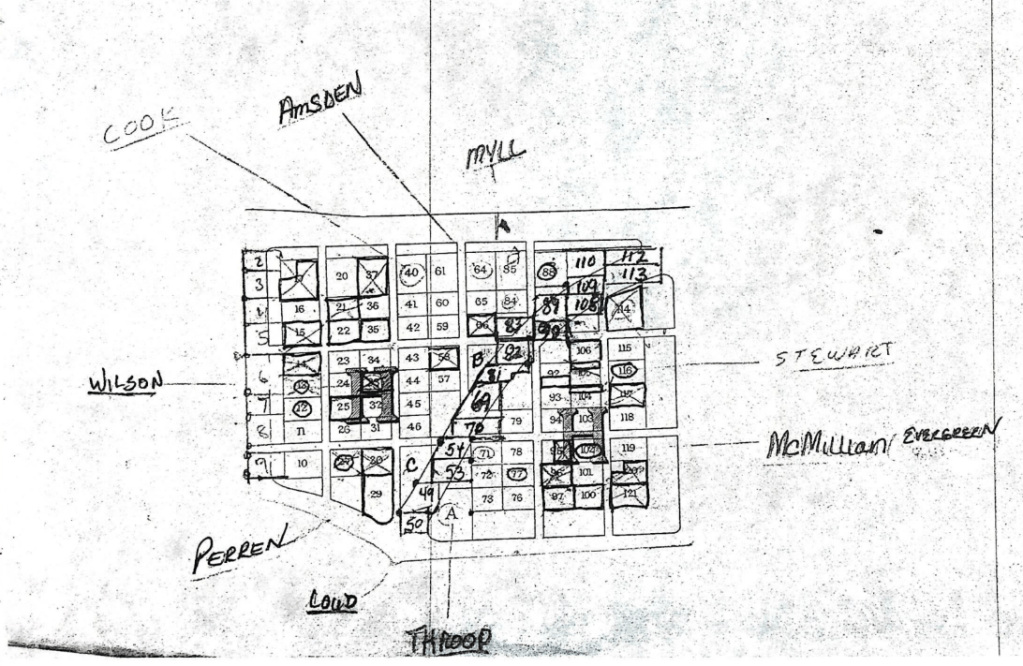
If you’ve ever visited Elmwood Cemetery and asked for the location of a gravesite, we may have given you a map. That map probably looked like this:
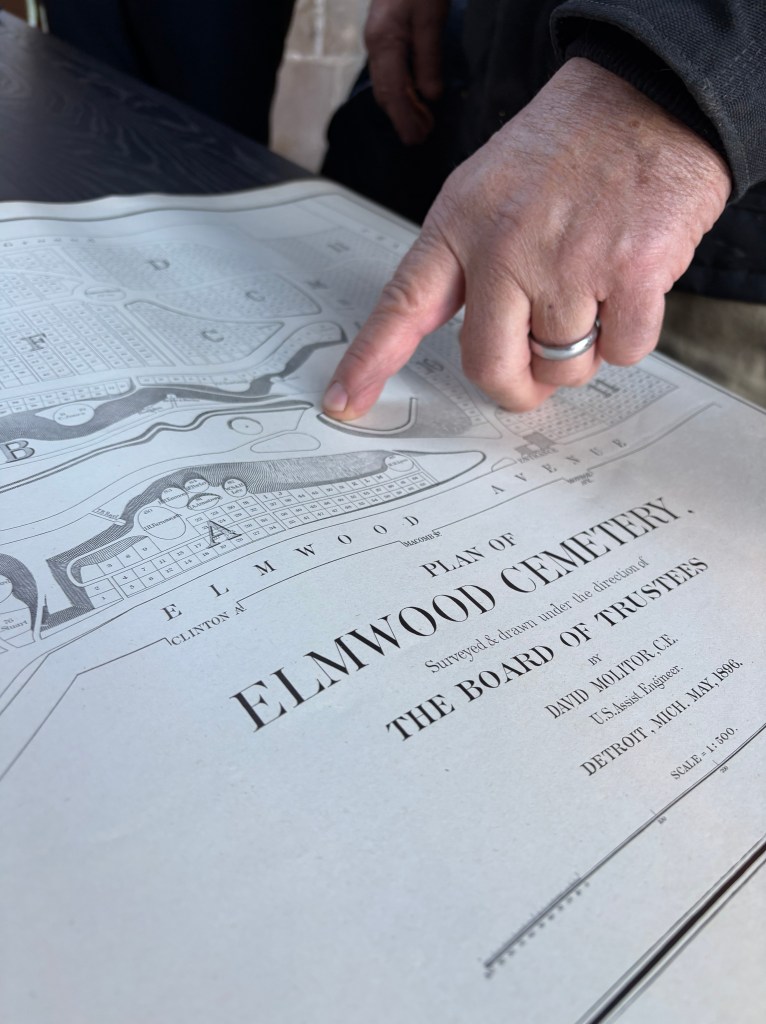
Hopefully, that map got you where you needed to go. If it did, you can thank our helpful staff, but also David Albert Molitor, who surveyed and mapped the cemetery about 130 years ago, when he was 30 years old.
Several other cartographers and surveyors have made significant maps of Elmwood throughout our history. Our first map was reportedly made by Augustus Canfield of the U.S. Army Corps of Engineers, although no copies of this map apparently survive. (The trustees reported they’d lost hope of finding it way back in 1880). Legendary mapmaker and historian Silas Farmer published a beautiful map of Elmwood in 1865, and our visionary superintendent A.W. Blain made his own map 20 years later. But the Molitor maps have a special place in our history as the maps that have lasted the longest, and the maps we still use today.
Molitor, born in Detroit in 1866, would become a civil engineer of international repute. Shortly after completing the Elmwood map, he went to work on the Poe Lock at Sault Ste. Marie, the largest lock in the world when it opened in 1896, where he oversaw construction of the lock’s gates. In 1906 he was commissioned to work on the Panama Canal, where he was the designing engineer of its locks and emergency dams. He worked on the sea walls of the Toronto Harbor and the superstructure of the Memphis Bridge over the Mississippi River. I think of Molitor whenever I see the Fisher Building, a crown jewel of Detroit architecture. You already know it’s an Albert Kahn – but David Molitor designed its steel frame.
When Elmwood’s trustees hired Molitor to make a new map of the cemetery in 1895, it was a pivotal time for the cemetery. The trustees were working to implement a set of recommendations from influential landscape architect Frederick Law Olmsted to preserve Elmwood’s historic and natural character. (These recommendations included removing excessive lot decorations, investing heavily in tree maintenance and planting, and avoiding straight lines and 90-degree angles when laying out roadways.) A new public mausoleum was under construction along the creekway. And they were adding acreage and laying out new burial lots to serve a population that had grown tenfold in the half-century since the cemetery was established.
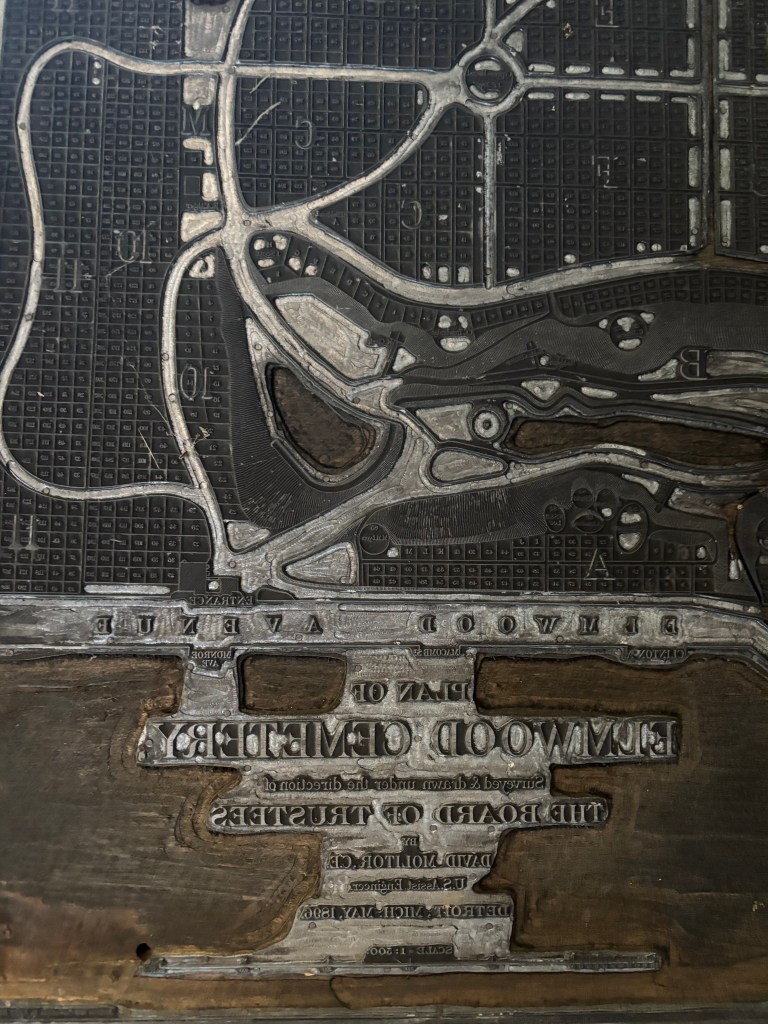
Molitor agreed to a fixed $500 fee for the entire project, which was completed the following year. Molitor joined several board meetings to discuss his specifications for the map and to present his drafts and invite critique. According to our minutes from these meetings, the trustees were pleased with his work and approved the final design without much back-and-forth. We still have the original copper plate that was used to print the Molitor map.
American cemeteries are designed with eternity in mind, but of course they do change over time. Elmwood’s boundaries are more or less the same today as when Molitor made his map, but more than a few things have changed on our grounds since then. We’ve laid out new burial lots, constructed a new public mausoleum, bumped out hilltops and infilled roads. Some of those changes were added to the Molitor map in 1906, when we hired the engineer Paul Heinze to make a few updates. Heinze began his career as a railroad engineer but later became known for his cemetery lay-outs; his c.v. includes Grand Lawn in Detroit, Roseland Park in Royal Oak, and Michigan Memorial in Flat Rock.
But in the century since Heinze added his byline to the Molitor map, we’ve made map changes in-house – by hand. It’s not the most sophisticated system, but it does what we need it to do.
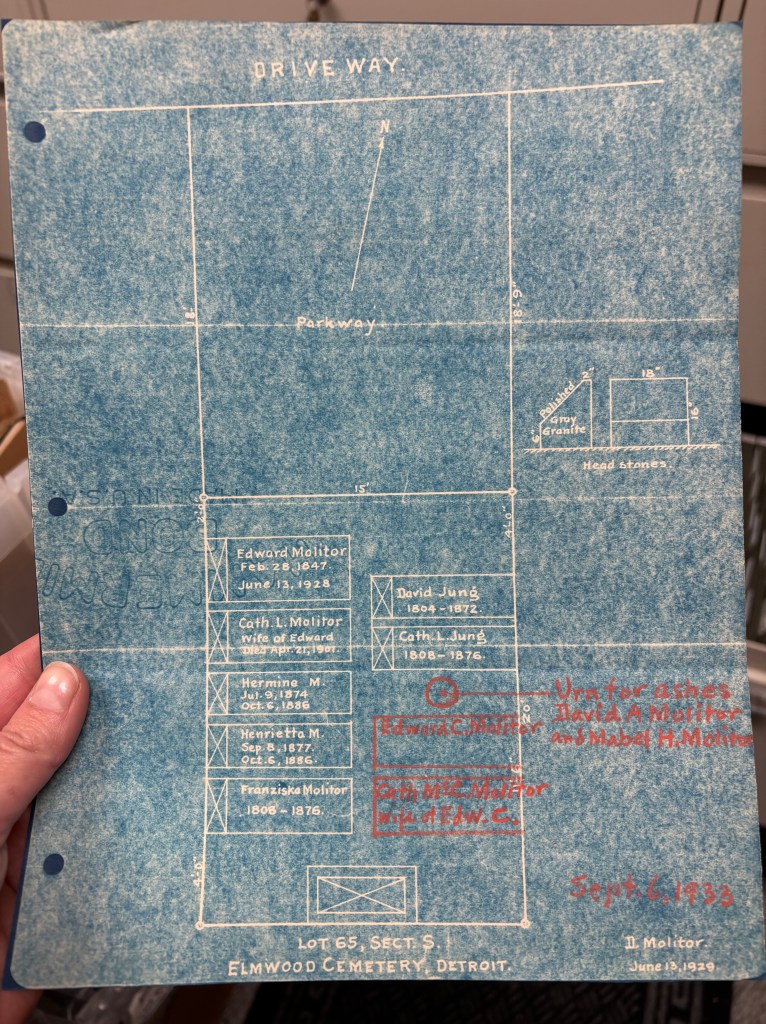
Molitor died in 1939 and was buried on his family lot at Elmwood on Section S. He designed the lot himself.
There will come a day, and it may not be too far in the future, that we retire the Molitor map. But for generations of staffers and visitors, the Molitor map is the map of Elmwood Cemetery. Ask for a copy next time you stop by the office. Molitor made it to last.
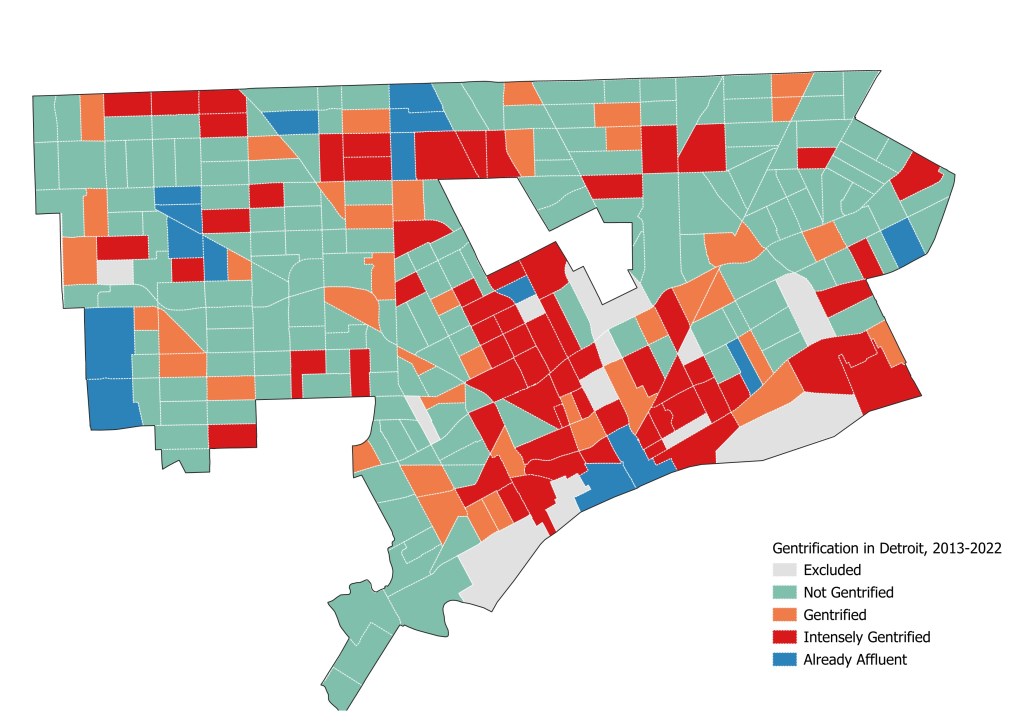
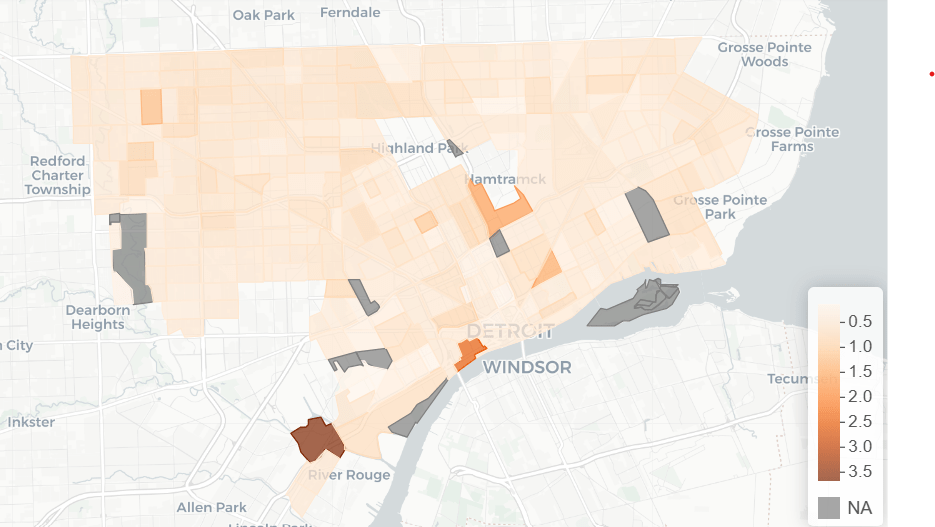
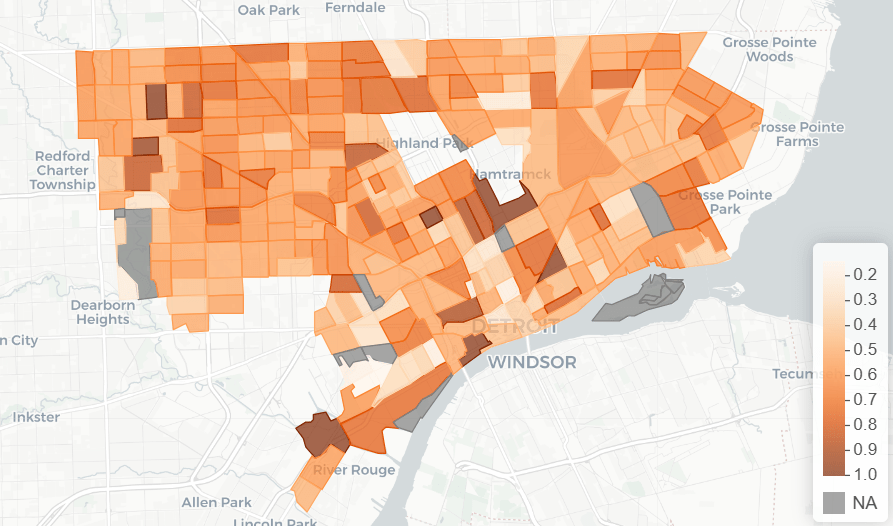
In a recent study, Alisha Butler (Wesleyan), Danica Brown (independent scholar), Michelle Taylor (Wayne State University), and I studied the dynamics of gentrification in Detroit and its relationship with middle-class families’ school choices in the city. As part of their analysis, they prepared a map of gentrification status by Census tract. The map provides a useful update on gentrification status after a decade of substantial but uneven development throughout the city. These findings update prior work from the 2000s and early 2010s, which had documented intense gentrification downtown but low overall levels of gentrification in the city.
We used a measure of gentrification proposed by the Urban Health Collaborative (UHC) at Drexel University. Their measure is based on changes over time in local incomes, college education levels, home values, and rent prices. Census tracts are classified as “not gentrified,” “gentrified,” or “intensely gentrified”—which helps goes beyond a binary of either gentrified or not. Their measure also provides guidelines for excluding tracts based on low population (<50 people) or missing data; and labeling tracts as “already affluent” based on high starting levels of household income, home values, and education levels. Following this method, we used one decade of Census Bureau tract data—from 2013 through 2022—to produce our measures of gentrification in Detroit.
We found that about 22% of Census tracts in the city intensely gentrified between 2013 and 2022, while another 14% gentrified (but not intensely), and 55% did not gentrify. We also identified 5% of tracts as “already affluent” and 4% were excluded. From the paper:
Intense gentrification was concentrated in the greater downtown and midtown areas, as well as neighborhoods expanding southwest, southeast, and north of the city’s downtown. Some intense gentrification is also concentrated in the northern part of the city. Gentrifying tracts are found throughout the city, though they are often found adjacent to intensely gentrifying tracts.
Changes over time in the socioeconomic characteristics of these tracts help illustrate the contours of gentrification. Both intensely gentrified and already affluent tracts had sharp increases in the share of residents with BAs, the median income, home value, and median rent. Gentrified tracts, compared to those that did not gentrify, had greater increases in the share of residents with BAs, as well as slightly higher home values, but median incomes and rents remained comparable. In addition, the share of residents with BAs and median home values in gentrified tracts remains much lower than intensely gentrified and already affluent tracts.
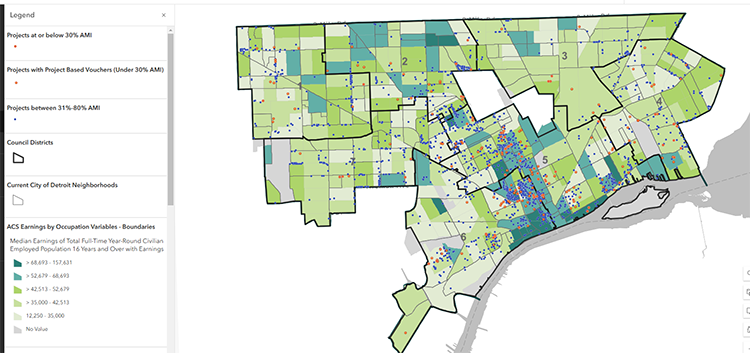
There’s been a lot of attention on Detroit’s affordable housing initiative recently from politicians who planned on using Detroit’s policies as an inspiration for the country’s policies. Having family who grew up in Detroit in the lower income brackets rallied my interest in what’s going on in Detroit’s housing department; I wanted to see how the City’s helping the less fortunate, and why it’s gaining so much attention. From HUD.gov, “The Project Based Voucher (PBV) program is a component of the Michigan State Housing Development Authority’s (MSHDA) Housing Choice Voucher (HCV) Program. The HCV program is federally funded by the United States Department of Housing and Urban Development (HUD) Public and Indian Housing (PIH) and is the primary resource for providing rental assistance to very low to moderate income families. MSHDA’s PBV program targets extremely low income (30% AMI) supportive housing target populations.” Also “The Project Based Voucher (PBV) program is a component of the Michigan State Housing Development Authority’s (MSHDA) Housing Choice Voucher (HCV) Program. The HCV program is federally funded by the United States Department of Housing and Urban Development (HUD) Public and Indian Housing (PIH) and is the primary resource for providing rental assistance to very low to moderate income families. MSHDA’s PBV program targets extremely low income (30% AMI) supportive housing target populations.”
In this map, the red dots show the ‘deeply affordable’ units, which is made up of 30% AMI and below, and projects receiving project-based vouchers. The blue dots show all other units that are still affordable between 31% AMI and 80% AMI. This shows there is a good spread of ‘deeply affordable’ units across the city, particularly in the higher earnings areas in the middle of the city. Using earnings as a proxy for higher opportunity areas, this shows a positive trend for the City. The colors of the map are broken out into different income levels shown by different colors. This information comes from the City’s Open Data Portal.
Overall, the City has a good spread of affordable housing, even in the lower income areas; this provides the resources for people to live comfortably, when they perhaps, otherwise, couldn’t. Deeply affordable housing in higher opportunity areas means that lower income individuals and families can benefit from living in these higher opportunity areas, and it’s a positive trend as the City aims to be somewhere where all can thrive as it redevelops post-bankruptcy.
Place names are an enduring and omnipresent way of remembering the past. The choice of place names informs whose version of history is commemorated and given precedence today, and in the future. Our daily interaction with the names of streets, parks, rivers, and buildings continuously reinforces a specific version of history and consciously and subconsciously informs our relationship to the places we live.
A Brief History of Place-Naming in Michigan
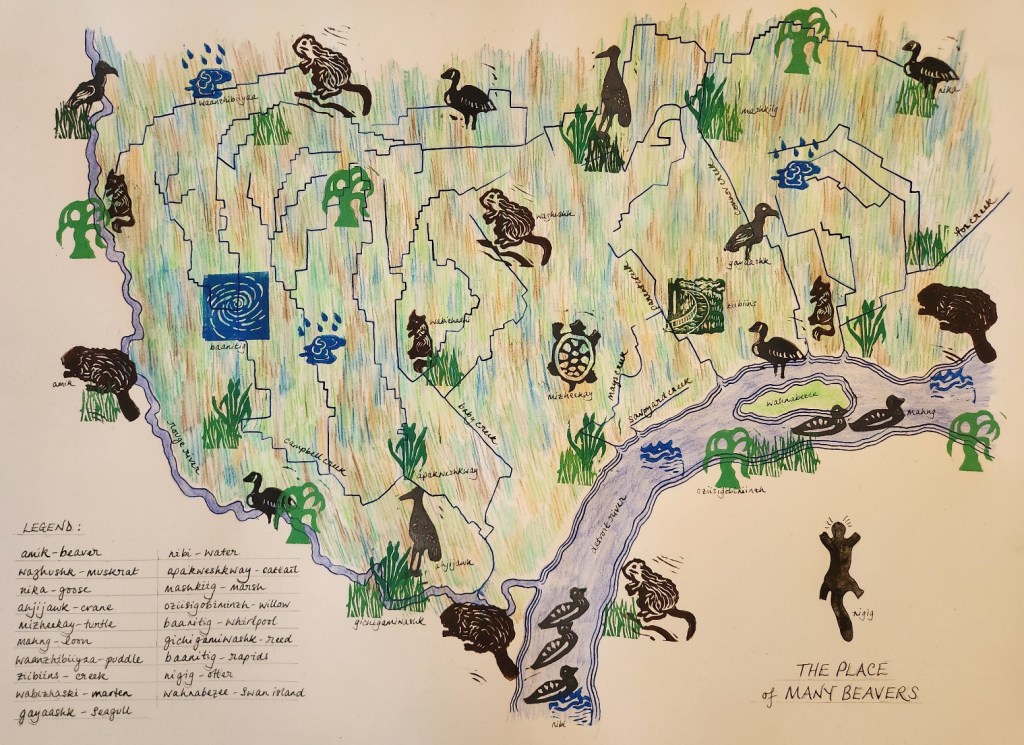
People have been naming places for as long as there have been people in places. Indigenous place names often relate to the intrinsic nature of the land. Teuchasa Grondie, the place of many beavers, is the place name Iroquois speakers call the place we call Detroit, and Maskigong, based on Ojibwe “mashkig” meaning “swamp,” describes the large wetlands at the headwaters of the Maskigong Ziibi (Muskegon River). Descriptive place names value the land for its innate properties and allow for the creation of practical maps that share knowledge of how to get from one place to another, using narrative stories, poetry, and song, as well as pictorial images.
Settler-colonialism brought with it the practice of naming places to claim land ownership. British, French, and Spanish colonizers asserted the collective ownership of their rulers and cultures through naming places for kings and queens, Christian Saints, towns and cities, and famous figures from their history. Hence across the river in Ontario there is a town called London and a river called Thames, and any number of places across the U.S. named for St. _____ and various Charleses, Marys and Georges.
Individual colonizers claimed ownership of land by affixing their names to the places they settled. To give just two of many examples in Michigan; Pellston was named by William Pells in 1882, to claim his ownership of a camp on the Grand Rapids and Indiana Railroad (Petoskey News Review, 14 April 1966), and on the Lake Michigan coast, Bliss was named for Rhoda Bliss, the first white woman to colonize there (The Petoskey Record, 19 September 1883). Many of the places the colonial settlers slapped their names on already had names. Some of these names were erased and replaced, such as Teuchasa Grondie by Detroit, and some were erased and colonized by language, for example, Maskigong to Muskegon, Michigami to Michigan, and Michinimakinaang to Mackinaw.
Later settlers stole not only Anishinaabe land but also Anishinaabe language to name places. Peter White, iron mining tycoon, appropriated the Anishinaabemowin word “ni-ga-ni” meaning “he walks foremost or ahead,” and anglicized it to Negaunee, to name a colonial settlement on the Upper Peninsula in honor of the “pioneer” ore furnace in the region. Henry Schoolcraft, US “Indian Agent” in Michigan, who incidentally has a street named after him in Detroit, made up place names by combining Anishinaabemowin and Latin. For instance, Arenac is a combination of Latin “arena” meaning sand and Ojibwe “ac” meaning land or earth made up by Schoolcraft to mean “sandy land” or “sandy place.” Some other Schoolcraft appropriated names include Alcona, Alpena, Iosco, Kalkaska, Oceola, and Oscoda. Before assuming that a place name is Indigenous in Michigan it is worth researching to ensure it was not made up by Henry Schoolcraft.
Place naming for individuals did not just rename the land, it redrew the map. Instead of explaining, verbally or pictorially, how to get from A to B by describing the features of the land, maps now facilitated navigation using the names of the local colonizers. This orientation around ownership claims removed a layer of connection to the land as people walked or rode along the path navigating, not by the wetlands at the headwaters of the river, but by Pells’ Railroad Camp.
Redrawing the map also erased and rewrote history. Many books, blogs, historical societies, websites, and Wikipedia posts have been dedicated to the stories of settlers who named places for themselves. All these sources, directly or indirectly, legitimize colonizers’ land ownership claims and orient us to place from a settler colonial perspective. Trying to dig beneath the layers of William Pellses, Rhoda Blisses and Arenacs to learn the original place names and the stories of the people who called them home is not an easy task.
A New Gazetteer for Downtown Detroit
To visit downtown Detroit to be immersed in a space created to laud a specific version of the city’s past and perpetuate a vision of the future where that vision is seen to be the natural, and only possible, order of things. This space is created using monuments, statues, parks, fountains and, most ubiquitously, street names. In his work on the naming of Martin Luther King Jr. Streets in the Southern US, Derek Alderman notes that, “Naming is a powerful vehicle for promoting identification with the past and locating oneself within the wider networks of memory” and, “[street names] make the past intimately familiar to people in ways that other memorials cannot.”
What does it feel like to move through a land where your place names, language and history have been erased or ignored? For People of European Descent with our language and history so prolifically and seemingly indelibly inscribed on the land, it is almost impossible to imagine.
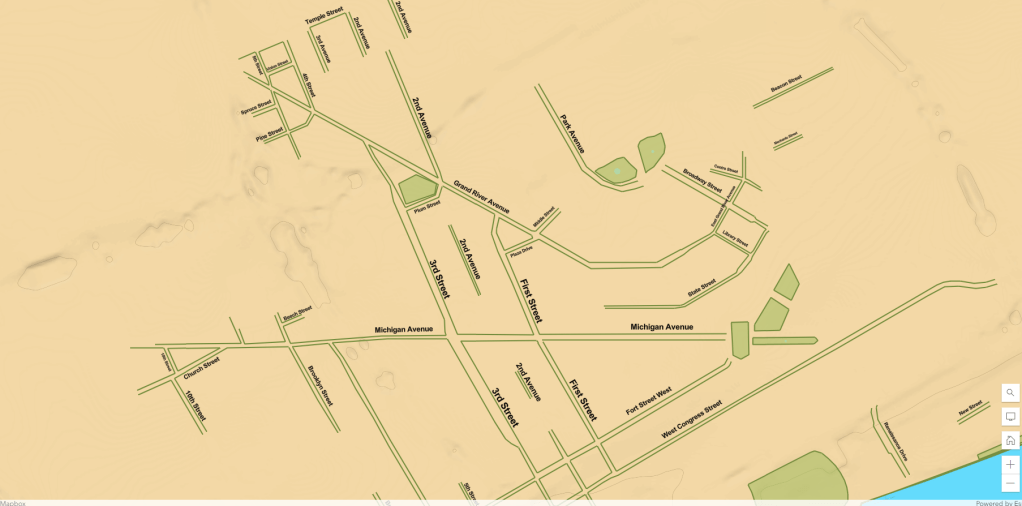
This map shows what downtown Detroit would look like if you erased the streets and street names that honor the colonizers. While in no way parallel to hundreds of years of human, land, history, and language theft and erasure, may this map give you pause to acknowledge it and to recognize the impact of its inscription on the land.
Map: Downtown Detroit with the street and street names that honor French, British and U.S. American colonizers removed.
Unlike removing monuments or changing the names of private buildings, such as university halls, changing street names is a hard and expensive task and one that, frankly, we do not have the time to organize around given all the other needs of our communities. We also cannot boycott or divest from street names, they are everywhere; on signposts, maps, your ID, your mail, every form you fill out, your online billing statements, your RSVP to the DSA meeting, and many more.
This Gazetteer asks us to change the conversation by subverting the street name narrative to tell another version/s of our shared history…
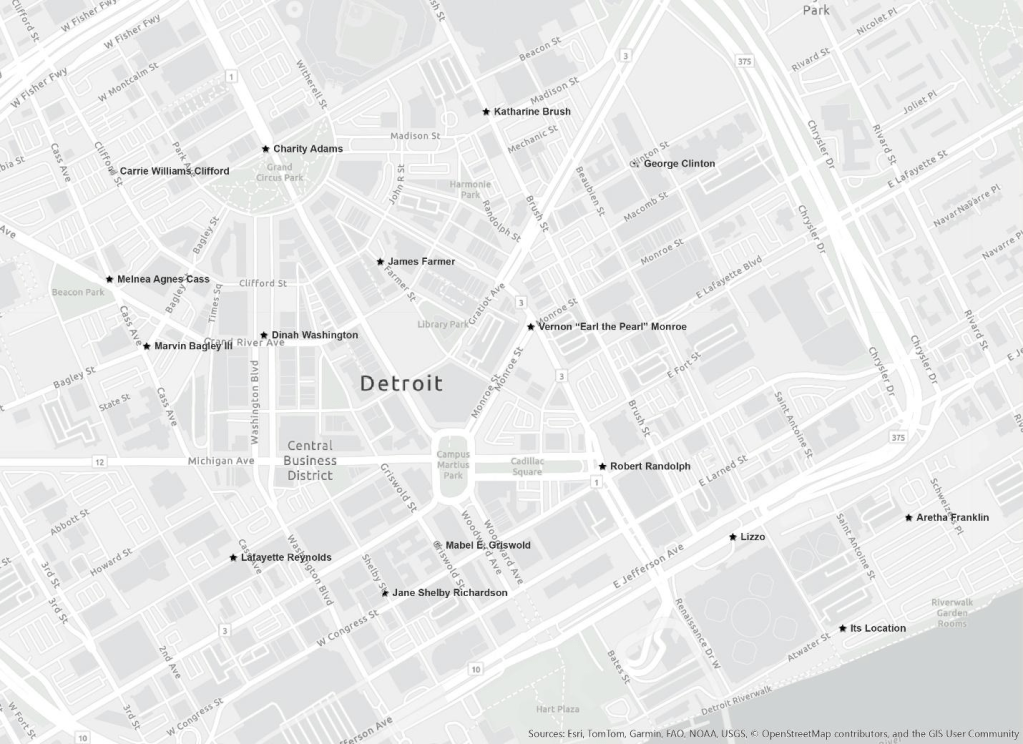
Map: A New Gazetteer for Downtown Detroit
This project is not intended to be the final word on street names. I am in no way anymore qualified to be naming Detroit’s streets than the city’s so called “founders.” My intention is to inspire Detroiters to use street names to tell different narratives of place that expand our learning of history and thus our vision for the future.
In working on this project, I noticed I was only able to find Black and White honorees for the street names. I want to recognize that this is directly related to the legacies of colonialism and imperialism as discussed above, and to the legacy of slavery, which erased the indigenous names of enslaved people, and replaced them with the names of their White enslavers.
Charity Adams was an educator, soldier, and community leader. Adams studied at Wilberforce and Ohio Universities to become a teacher. On the outbreak of WWII, she joined the Women’s Army Corps (WAC) and later commanded the first Black WAC unit to go overseas. After the war, Adams returned to Ohio to complete her studies and worked at the Veteran’s Administration.
Katharine Brush was a journalist and author. Almost forgotten today, Brush was a critically acclaimed and popular writer during her lifetime. She was best known for her short stories and syndicated newspaper columns, which covered among other things, Ohio college football…and therefore probably Michigan football as well.
Marvin Bagley III is a basketball player with the Detroit Pistons. While perhaps not the greatest player ever to grace a basketball court, naming a street for Bagley represents the importance of recognizing everyone’s contribution to the team. And his career is still young, there is time…
Melnea Cass was a civil-rights activist, suffragette, and labor organizer. Cass worked tirelessly to protest racist hiring practices, register women to vote, and train domestic workers to advocate for social security and other benefits in her hometown of Boston. She also helped found Freedom House to advocate for Black civil-rights and address issues ranging from “urban renewal” to education.
Carrie Williams Clifford was a poet and founder of the Minerva Club, a reading club dedicated to seeking a better world for Black women. She also co-foundered of the Ohio State Federation of Colored Women and actively recruited for the Niagara Movement.
George Clinton “Free your mind….”
James Farmer was a co-founder of CORE (Congress of Racial Equality) and organizer of the Freedom Rides in the summer of 1961. Farmer studied at Wiley College and then Howard University where he was introduced to Gandhi’s teachings. He advocated for and practiced non-violent direct action such as sit-ins and freedom rides.
Carrie Fisher “May the Force be with you….”
Aretha Franklin “R E S P E C T….”
Mabel E. Griswold was an activist and founder of the National Women’s Party in Wisconsin. Following the passage of the 19th Amendment granting women the right to vote in 1920, Griswold and her partner, Elsie May Wood, worked in the Wisconsin Governors’ office.
Melissa Jefferson aka Lizzo is a flutist, rapper, songwriter, and singer. Lizzo was born in Detroit in 1988. Her family moved to Houston, Texas when she was 9. She is the winner of numerous awards including 4 Grammys and a strong supporter of LGBTQ+ rights.
Lafayette Reynolds played by actor Nelsan Ellis (1977 to 2017) on the HBO Series True Blood. Lafayette is a cook and medium who can communicate with ghosts and spirits. Ellis’ portrayal of Lafayette won him a Best Supporting Actor Award from the International Press Academy and millions of fans around the world.
Vernon “Earl the Pearl” Monroe is a NBA Hall of Fame Guard. Monroe scored 17,454 points with the Baltimore Bullets (now Washington Wizards) and New York Knicks during his 22-year career. He won the NBA Championship with the Knicks in 1973.
Robert Randolph is a pedal steel guitarist and gospel band leader. Randolph plays both secular and Sacred Steel, a gospel musical style introduced to into worship in the 1930s. Detroiter, Felton Williams, was one of the most talented sacred steel guitarists. Felton designed and built his own guitars and mentored young musicians in the Detroit area.
Jane Shelby Richardson is a biophysicist. As a child Shelby Richardson was keen astronomer, she calculated the orbit of the Sputnik satellite from personal observation. In 1981, she published her work on The Anatomy and Taxonomy of Protein Structure, which included the Richardson Diagram or ribbon diagram method of drawing the 3D structure of protein. Her diagram remains the standard expression of protein structure throughout the world today.
Dinah Washington was a jazz, blues, R&B, gospel, and pop vocalist. Washington called herself the “Queen of the Blues, she was a prolific and influential singer in a variety of genres and her work continues to inspire musicians and audiences today. Washington was inducted into the Rock and Roll Hall of Fame in 1993.
A version of this article originally appeared in the Detroit Socialist in 2023. Today, as the current Presidential administration embarks on re-naming projects that further a white supremacist version of history, it feels even more important to recognize the impact of street names on our collective understanding of our history and culture.
The inspiration for the Fish & Chicken Joint project came from a friend visiting from Washington State who loves bodega food. We went for the required Coney hot dog at American Coney Island downtown, but it didn’t feel quite “bodega” enough. Driving around the city he pointed out Harlem Fish & Chicken on Grand River. So, we went to a Fish & Chicken Joint. Not Harlem, but East Jefferson Fish & Chicken in the liquor store at the corner of Jefferson and Holcomb. I was hooked, literally and figuratively. What is up with Fish & Chicken restaurants?
As I finish up mapping the buried waterways I have started noting and sketching the Fish & Chicken Joints that I pass on my rides.
I am curious about the relationship between Fish & Chicken Joints and fishing in the Detroit River. Many of them offer fish cleaning services. Do they also serve fish caught in the Detroit River?
I love that they have found a way to accept EBT. The prohibition on using EBT for prepared or restaurant food feels to me like another way to make more work for poor people. Cooking every night is not just additional labor. It is also a lot of additional energy in heat for cooking and cooling for air conditioning added to our already high DTE bills.
I wonder how many of them are small to medium sized local businesses with connections to the neighborhoods they serve rather than national chains making money for distant billionaires. Are they recognized and applauded by the Detroit Economic Growth Corporation or Motor City Match? I doubt it.
And as with everywhere I go in Detroit I am fascinated by the architecture. They may not have all the unique decorative elements of our fancy skyscrapers but there are fun shapes and colors, patterns in the brick work, and murals on the walls.
This map is my first Fish & Chicken Joint visualization. It shares all 14 Fish & Chicken Joints along 7 Mile Road between Telegraph and Moross. I hope you enjoy it. And go and get some Fish & Chicken!
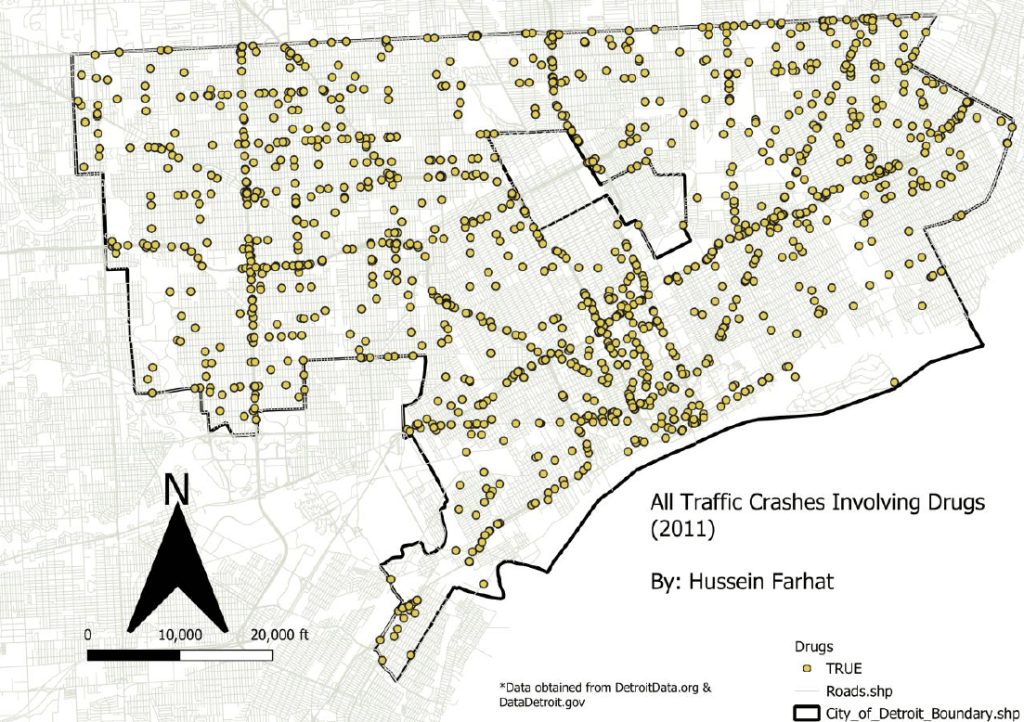
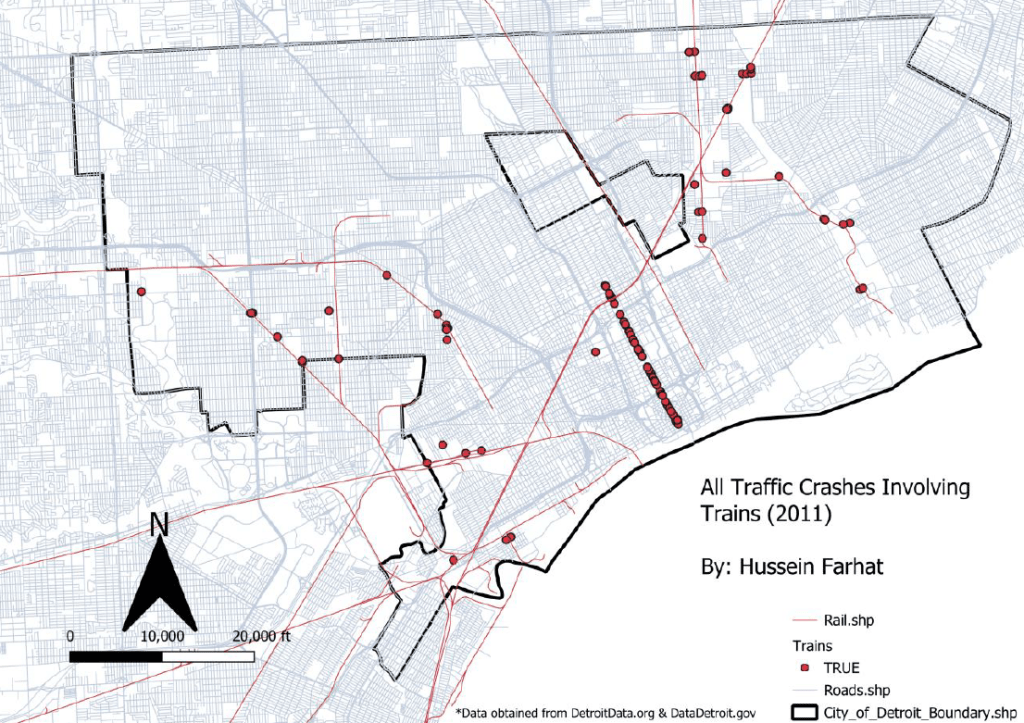
by: Hussein Farhat, Wayne State University, Intro to GIS, Fall 2024
In this map, we see all the traffic crashes that involve drug use. The crashes are relatively scattered across the map, with a bit of a grouped cluster in the more southern part of Detroit also known as Downtown Detroit. The map accounts for all drugs that are involved in crashes and doesn’t exclude any that cause impairment.
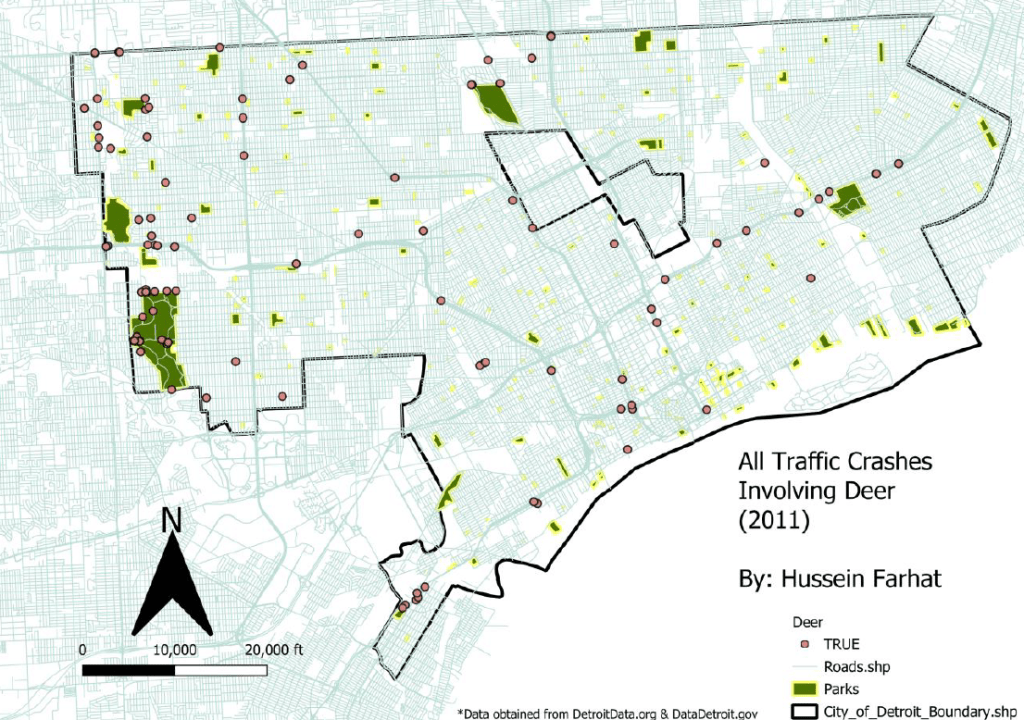
In this map, we see all the traffic crashes that involve deer. The crashes are relatively scattered and minimal across the map. We now see a bit of a grouped cluster in the more western part of Detroit, more specifically, River Rouge Park. This makes a lot of sense; due to the increase of relative wildlife it is natural for more deer to be present. With an increase in deer, the risk of a traffic crash with a deer increases.
In this map, we see all the traffic crashes that involve trains. The crashes are not scattered, and as expected, tend to be exclusive to areas around railway systems. We see a strong lined cluster that cuts right through the railway system near Midtown. There could be many reasons for the increased susceptibility for collisions with trains in this area. It’s possible that the railway design, paired with the road could be a bit faulty.
This map is one of my first explorations of how I might interpret the data I researched and collected on Detroit’s buried waterways to share visualizations of the city. I am very convinced that the way we talk about a place impacts our relationship with it. I created this map to learn the Ojibwe names of some of the Indigenous plants and animals of Teuchash Grondie (The Place of Many Beavers) / Waawiyaataanong / Karontaen / Motown / Midnight / Motorcity / Detroit.
Following two Michigan Supreme Court rulings, Rafaeli v. Oakland County in 2020 and Schaeffer v. Kent County in 2024, Michigan residents who experienced property tax foreclosure between 2015 and 2020 were granted the right to retroactively claim surplus proceeds from their homes being auctioned for more than the tax debt owed. For example, if a homeowner hadn’t paid their $1,000 annual property tax for two years and lost their home to foreclosure, and the county later auctioned the property for $20,000, the homeowner would now be owed $18,000. This practice of retaining surplus proceeds resulted in Wayne County reportedly collecting $92 million between 2005-2015.
Based on data provided by Alex Alsup (link), it became clear that, among Wayne County’s 41 cities, Detroit residents were disproportionately impacted, effectively sacrificing their homes to keep the county financially afloat. Filtering out commercial properties and speculators, Alsup and Outlier Media identified approximately 2,700 former Detroit homeowners who qualified to claim surplus proceeds, with an average amount of $8,000 each.
Outlier Media became aware of this in late 2024 (link)(link), resulting in a very short window to identify and notify affected residents before the March 31, 2024 claim submission deadline mandated by Michigan statute. Starting in late January 2024, Outlier began hosting phone banking events (link). Initially, we only had the address and the name on the deed at the time of foreclosure, making it difficult for volunteers to locate phone numbers. As a workaround, many phone bankers had to rely on Google searches to identify current contact information.
Outlier partnered with the Detroit Justice Center (DJC) to gain access to public records via LexisNexis. From there, Detroit Documenters and DJC volunteers began looking up both contact information and whether the former homeowners were still living. If deceased, volunteers were asked to identify likely next of kin or potential beneficiaries. Tragically, 40% of the former homeowners were found to be deceased. With limited clarity from the Wayne County Treasurer’s office, Outlier operated under the assumption that it was best to submit claims by the deadline, even if no probate cases or estates had been opened. After searching for contact information, more phone banking events were held where unlike the first sessions, these later events had a noticeably higher contact rate as volunteers were actually reaching people.
I was hired on a three-month contract as project manager in the first week of February after contributing as a Documenter, helping look up contact information, and attending a pilot phone bank in January. Recognizing the scale of the outreach, I bought a cheap flip phone to keep communications organized, as I was responsible for dozens of follow-up calls after each phone bank.
In the two months leading up to the deadline, we made 4,321 calls, resulting in 481 successful contacts. We estimate these efforts could lead to $5,882,473 potentially being returned to impacted former homeowners and their families. Out of those 481 contacts, I personally responded to 200 follow-up calls, which I tracked individually. Fortunately, the Detroit Housing Network’s call center stepped in to assist with additional follow-up efforts.
On March 29, just days before the deadline and after our final phone bank, I attended the workshop “Mapping Your Local Environment” led by CJ Knoble and presented by Detroit Documenters, Planet Detroit, DetroitData, Urban Data Response, and Rooted Futures Lab. We learned how to use Felt for mapping and were encouraged to create one ourselves. The day before, I had organized a one-stop claim submission event at the Joseph Walker Williams Recreation Center where free notary services were provided, and the City of Detroit’s Department of Revitalization collected claim forms to deliver to the Treasurer’s office. As I helped people complete their paperwork, I realized I had previously been in contact with many of them. Inspired, I created a map at the workshop to explore whether the residents I’d reached represented the broader geographic spread of the windfall profits owed, and whether some areas saw more concentrated profits than others.
Data Layers Included:
The boundary of Wayne County
The boundary of Detroit
A heatmap of addresses eligible for surplus proceeds, released by the Wayne County Treasurer’s office
📲 Emojis from my claimant follow-up spreadsheet, each representing a home I personally consulted
Observations:
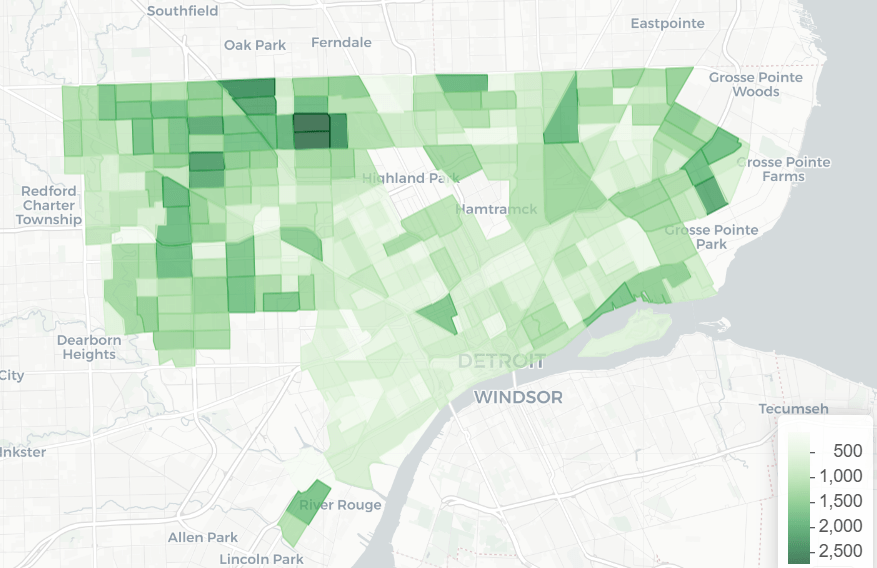
To visualize areas with higher concentrations of qualifying foreclosures, I converted the list of eligible addresses into a heatmap. The results are likely not surprising to most Detroiters: the issue was widespread across the city except in areas such as Wayne State University/Cass Corridor/Midtown, the riverfront, and neighborhoods near Ferndale and Grosse Pointe. Although there were pockets that were less impacted by property tax foreclosure between 2015-2020, it was painful to see how prevalent they were in Detroit compared to the other cities in Wayne county as depicted in the heat map.
The distribution of the 📲 symbols, representing homes I personally contacted, was wide but I could see that I lacked strong outreach in some heavily impacted neighborhoods. I was especially disappointed that I didn’t assist more residents in Southwest Detroit, where I live, and where the heatmap showed many eligible properties. Given that Southwest is a predominantly Spanish speaking community, they may have routed their follow up calls to our partner there, Bridging Communities or other organizations. Although there are gaps on my personal outreach map, I presume that a map of total calls to 2,163 out of nearly 2,700 impacted former homeowners that were placed during phonebanking events would fill those pockets. If there had been more time it would have been great to map earlier on to track the distribution and build more localized partnerships.
Next Steps:
Michigan statute requires that claimants receive a response from the Wayne County Treasurer’s Office by July 1st 2025. It is the second week of June and I am getting calls from anxious claimants who still have not heard back. I am able to relay that no one has received their letter as of yet, and their calls assure me that I will know when they do arrive. The expected letter from Treasurer Sabree is supposed to confirm the amount that is owed and instruct the claimant on next steps. I expect that a large portion of claimants will be disappointed to find that there is another step, which is to file a motion in court. This might be particularly intimidating for those who claimed interest as heirs or beneficiaries. We do not know how WCTO will be responding to claimants who didn’t have a probate open when they submitted the initial form March 31st. Detroit Justice Center is contracting experienced probate attorney Deborah Choly to assist heirs with filing. I am back at Outlier as of last week for this second phase and will be organizing workshops where claimants can be guided through filing as well as receive specialized support and resources for the process. I will be keeping track of who reaches back out in this phase and hope to map again to compare and contrast my outreach in each phase.
Shiva Shahmir holds a BA in Fine Arts from the University of British Columbia, with a concentration in architectural theory and environmental design, and an MPS in Arts and Cultural Management from Pratt Institute. Since 2017, she has voluntarily managed Spread Art, a nonprofit, community-programmed cultural space, as President of the Board. In 2023, Shiva joined Wayne State University as part-time faculty in the Music Department, where she lectures on studio recording and music technology. In 2024, she became an active Detroit Documenter with Outlier Media, where she is now contracted as a Project Manager. Shiva is also an artist and a proud FCC-licensed amateur radio technician.
When I started the Mapping Detroit’s Buried Waterways project in 2022, I had no idea I would still be trying to complete it 3 years and 283 miles later.
This map is a screenshot of the current state of the project from my GAIA account, which I use to record tracks as I follow the routes of the buried waterways as closely as I can in real time on today’s streetscape. The base map is the current Open Street Map with the U.S. Geological Survey (USGS) 1905 1:62,500 series map and my tracks and waypoints (GPS coordinates of points of interest) layered on top. I started the project by following Baby Creek and its tributaries because it is the closest buried waterway to my house. To begin with I simply recorded the track as I followed the creek on my bike. As I moved west to Campbell Creek, I began marking waypoints of things I noticed that related to, or reminded me of, water. There are now more than 500 waypoints on the map representing everything from puddles, rain gardens and marshes, to boats, paddling pools and desire paths, to fish lawn ornaments, Canada Geese and Weeping Willow trees. Around summer 2023, when I headed over to the Eastside to map the channels of Fox Creek, I started adding photos (represented by the camera icon) to the map.
I love looking at this map. I love that it documents the evolution of the project and the profusion of the mess of waypoints and the memories they bring back of visiting different areas of the city.
Voter Mobilization efforts should focus on a simple equation that indicates the potential available voters in each U.S. census block. The Voter Participation Rate (VPR) as defined as the Voter Totals / Voting Age Citizens located in each block indicates the untapped quantity of voters available in each tract.
Using reliable data sets for each of the key variables, VPR indicates the highest potential for tracts for voter mobilization activists in the city. The analysis below suggests that these groups should prioritize the following 5 Census Tracts:
Census Tract
VPR
Census Tract 5240.01
14.30%
Census Tract 5242
14.40%
Census Tract 5241.01
17.60%
Census Tract 5173
20.30%
Census Tract 5234
20.70%
Data Sets:
The data used in this analysis is pulled from two sources. The first is a very interesting data set available from Michael Bryan and the Harvard Dataverse where they aggregated precinct level voting totals from 2020 and projected them onto U.S. Census geometries. This allows the analysis to by past known issues with exit polling and use actual voting totals in the calculations. Although this data is reported in a partisan fashion in terms of votes for the president, uses the aggregate total votes across a Census Tract for targeting non-partisan voter registration efforts.
The second data set used is data published by the Census on the count of Voting Age Citizens in a given Census Tract as calculated by the 2022 5-Year estimates which is the most recent data available for this type of estimate and geography.
These data sets provide information on the participation of voters in elections, specifically, the last presidential election as well as the overall available number of voters in a given area, in this case, a Census Tract. Census geometries are useful in that they can also provide various demographics and other data that is not available for precinct areas.
Calculating VPR
The Vote Totals by Census Tract are shown below:
This data shows that the Bagley neighborhood (Census Tracts 5385 and 5386) seems to have the highest counts, while Southwest Detroit shows less voting overall.
Figure 2 shows the counts of Voting Age Citizens from the 2022 ACS data:
There are several items to note from this plot. The first is that populations of Census Tracts vary widely across the city. Most notably, there are several (Belle Isle, the Stellantis Plan on the east side, Rouge Park on the west side, etc.) where the estimated population is 0. These Tracts must be taken into account differently as they cause issues with the analysis.
Using these values, the Voter Participation Ratio (Vote Totals per Census Tract/ Estimated population of Voting Age Citizens per Census Tract) can be calculated:
This plot shows greyed out Census Tracts where no Voting Age Citizens are estimated to live, these are marked as “NA”. Additionally, there are several tracts where the projections exceed the estimates from the Census generating a ratio above one. One possibility is that these are tracts where there was significant decrease in population from 2020 to 2022. Another possibility is that the precinct population from which the projections were drawn is geographically heterogeneous and the projections don’t do a great job for these particular areas. This is likely true for highly industrialized Census Tract 5245, which shows a ratio of 3.7. The Census only estimates that 36 Citizens of Voting Age live in this tract.
If the ratios are capped at 1 by using the Voter Totals as the estimates where the ratio exceeds 1, the plot shows a better looking and more useful chart:
Interestingly, although the prevailing belief is that Detroiters don’t vote, most Tracts have relatively high participation with two thirds of Tracts showing over 50% VPR. Overall, Detroit has a VPR of 56%. Using this data, a list of Census Tracts to target for voter registration and outreach can be generated, including some of the lowest participation Tracts like 5240 (14%), 5242 (14%), 5173 (20%), etc. If voter outreach were to bring these 5 lowest Census Tracts up to the average VPR of 56%, it would boost turnout by 3200 votes in the city.
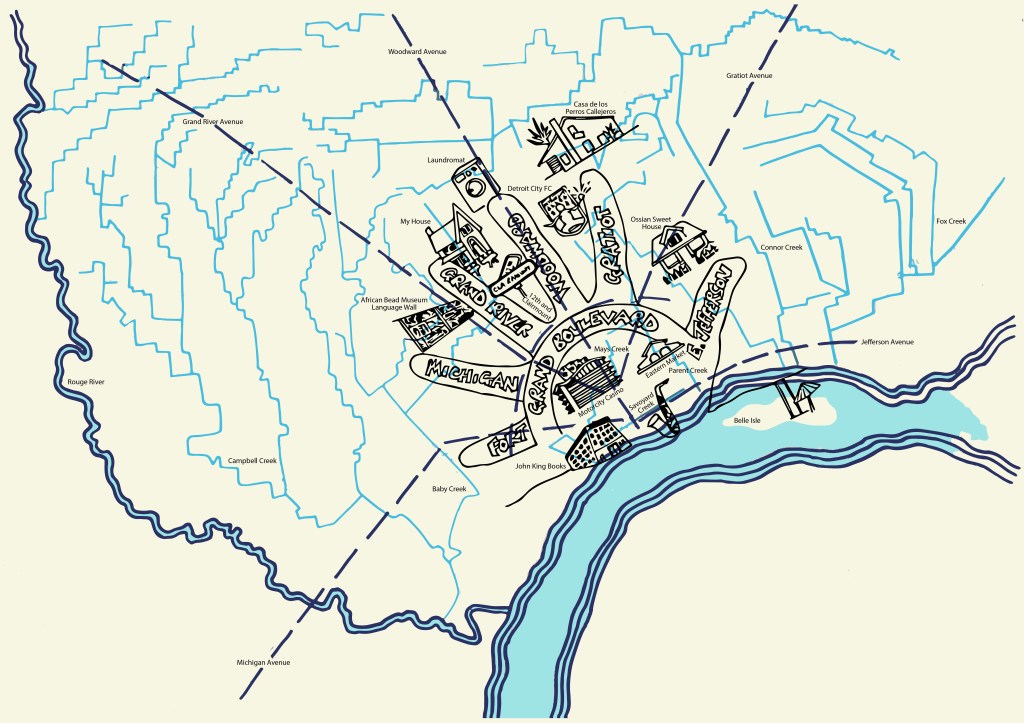
This map combines the classic Detroit hand map with an outline of Detroit’s buried creeks – sketched from tracks recorded while following the creek routes on my bike – to share my relationship with Detroit.
The hand map is the first map I created of Detroit after attending a DETROITography event in 2017. The map focuses on places that were and mostly still are important to my life in the city. My house, the African Bead Museum, and Belle Isle Beach are all places I still go regularly. Thankfully I have a washer and dryer now so my visits to the laundromat are not as frequent.
The outline map of Detroit’s Buried Waterways represents how learning to navigate the city from the perspective of water, rather than concrete, has expanded my relationship with Detroit. Following the creeks on my bike has taken me to neighborhoods all over the city and introduced me to thriving communities, emergent marshes, and resilient people and nature.
by: Neel Marathe, University of Michigan urban technology student completing a GIS internship
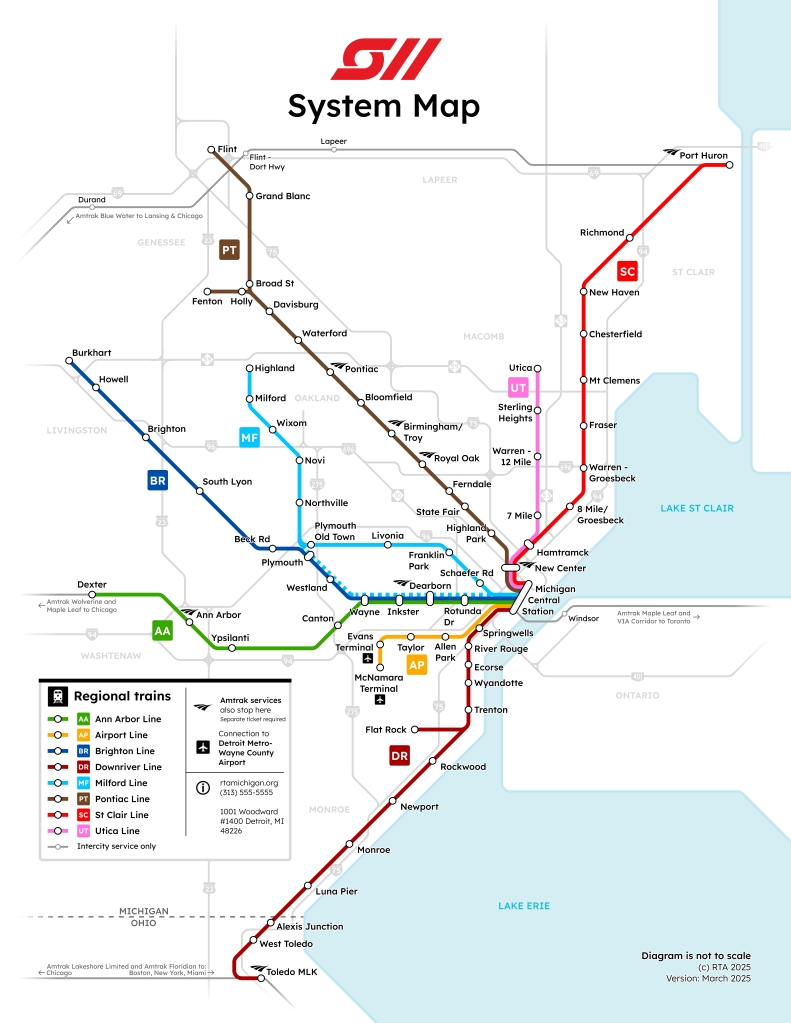
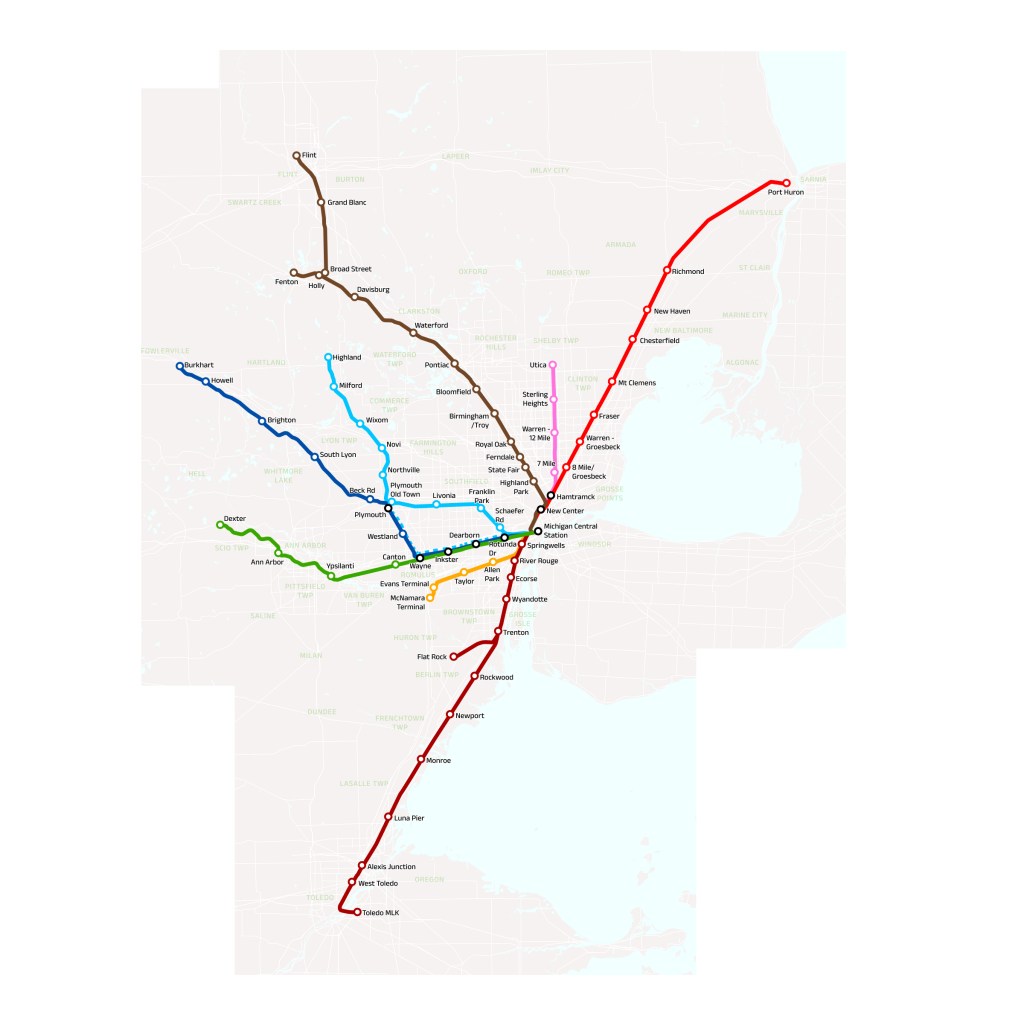
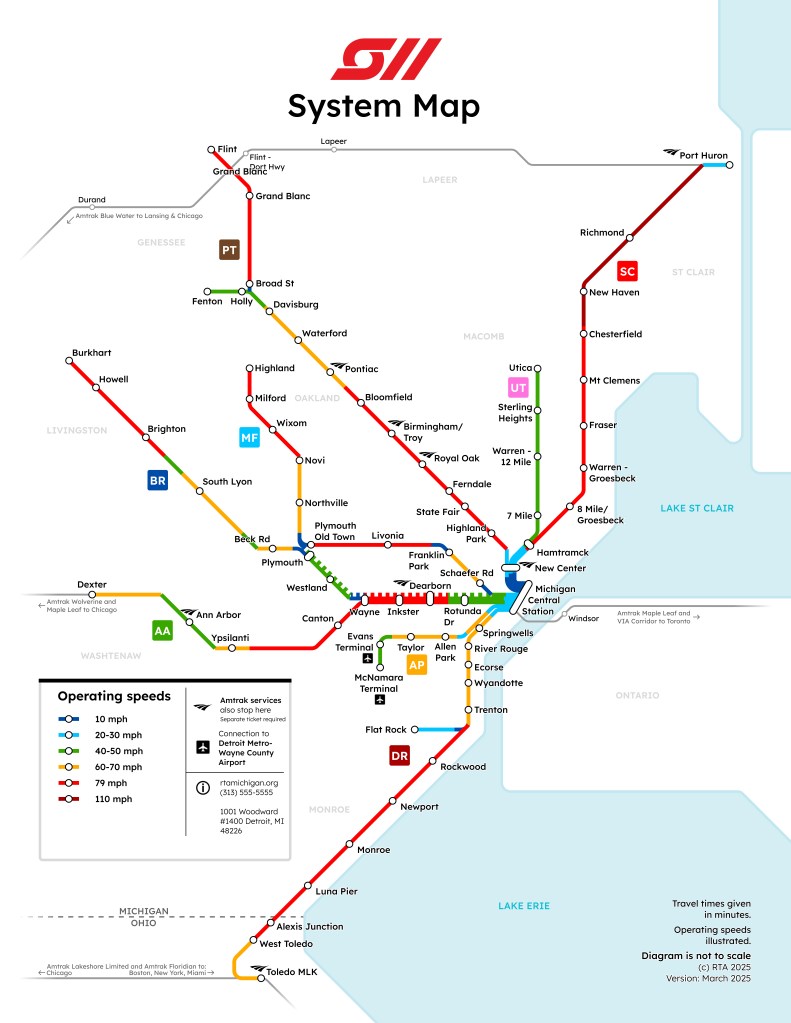
What if SEMTA, the one-line commuter rail from the 70s, grew instead of dying out? Inspired heavily by Metra and GO Transit, this project that I worked on over spring break imagines that Detroit had a regional/commuter rail system that matured through the ages (not like a brand new proposal). This system entirely uses existing tracks owned by many different freight companies, but imagines that they’re improved a lot for passenger use.
Perhaps interestingly, I imagine that what I’ve depicted as the Downriver line is actually an electrified former interurban once operated by the Detroit United Railway—very similar to the South Shore Line in Chicago/Indiana. Even Henry Ford attempted to run an unconventional electrified freight railway on this corridor (didn’t go well). This being electrified would’ve made it easy to also create an electrified airport line, which features the only non-existing right of way in the map. The rest of the lines would probably run with diesel trains.
I’m also in the process of making fictional timetables for all these lines, with service patterns based on a commuting habit analysis sourced from this handy SEMCOG map (the patterns are present there).
Tools: ArcGIS Pro to start & make the shapefiles, Figma for everything visual.
Why no ring line? Why do they all terminate at MCS?
I wanted this map not to be perfect, but somewhat realistic to the imagined continuation of SEMTA’s operation. Thus it looks very similar to Metra’s and GO’s systems. I was especially inspired by GO, who run a great regional bus service that complements their rail network with non-radial lines along major freeways, and fills in the unserved corridors with lower capacity, higher frequency service.
As many pointed out, Detroit isn’t the center of Detroit—there’s much more demand here to go to other job centers: edge cities like Troy, and the unique case of Ann Arbor. I think a radial rail line would be great, and ridership would make sense too, considering the decentralized nature of traffic patterns in our metro area.
Why no western access to the airport?
There are a number of ways to imagine this system—this one is not great for that use. There’s definitely rail routings that’d make transit from the western metro to the airport more possible. For mine, I wanted to imagine that an electrified interurban down to Toledo would be the basis for an electrified, high frequency airport line that also serves some other downriver communities that the main lines would miss out on.
Why no service to Southfield, Farmington, etc?
I wanted to stick to using current existing rail right-of-ways to remain realistic; there are no rail lines that go to those communities. This is also somewhere I imagine that a complementary bus service would fill the gaps, by providing connections to stations or directly into town and other peripheral destinations. I imagine that the current SMART buses would be very useful for this—travel from the Troy/Birmingham station into the business district, for instance.
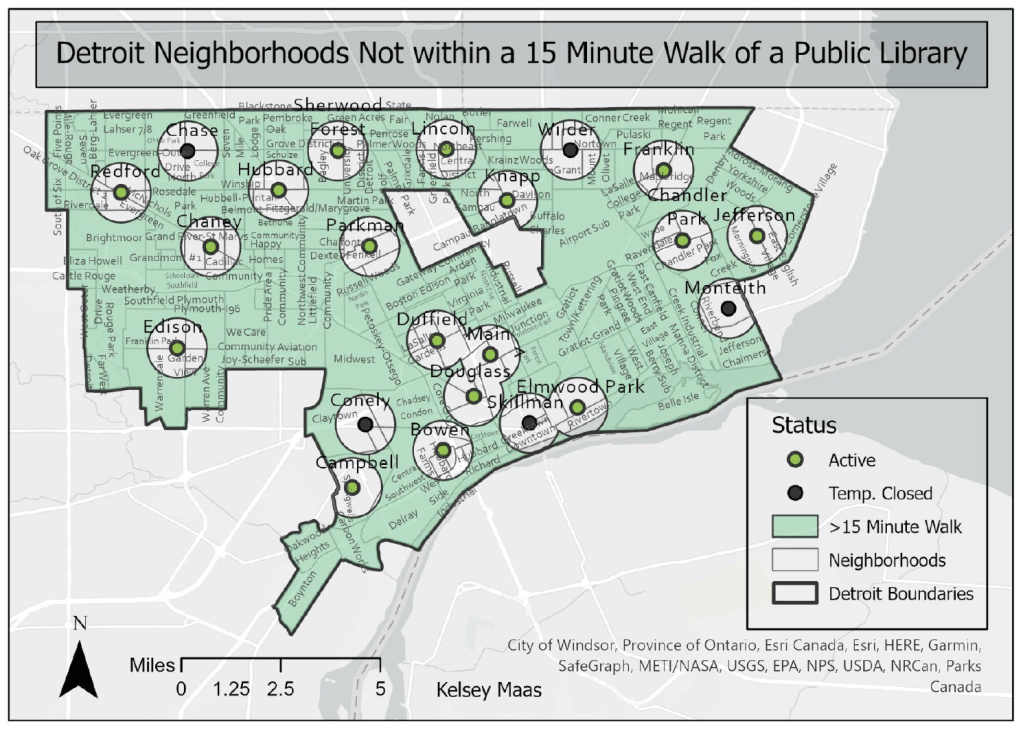
by: Kelsey Maas, Wayne State University (Intro to GIS, Fall 2024)
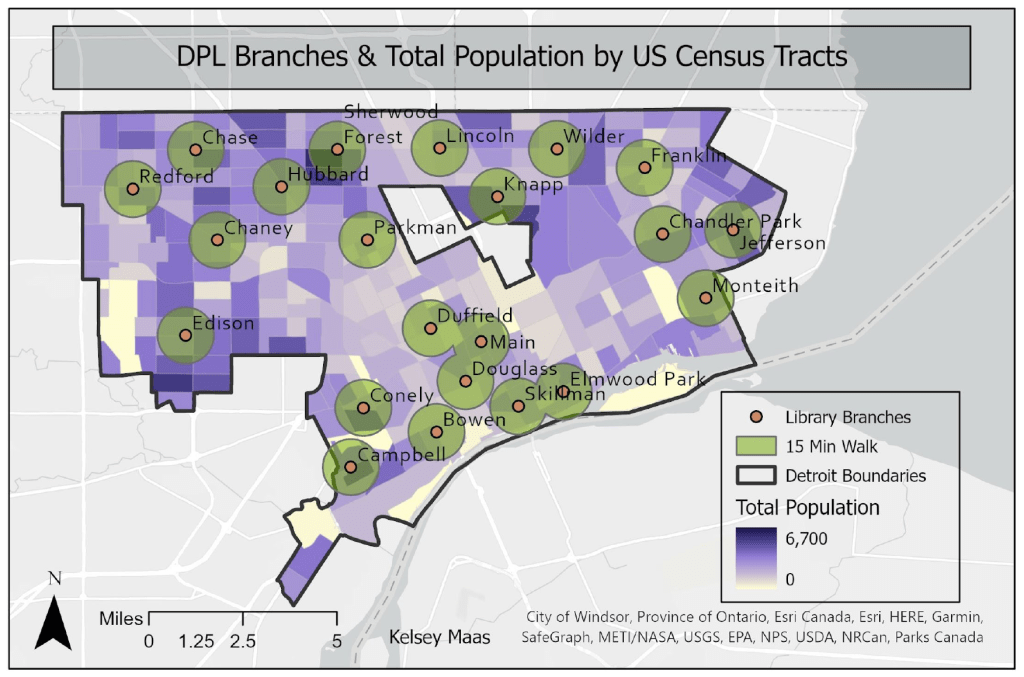
Public libraries have long served the people of Detroit. The first public library opened in 1865 in the Old Capitol building. Due to extensive population growth, the City constructed its first library branches to meet need. Eventually, eight more branches were created from funds from the American Industrialist Andrew Carnegie with the last Carnegie branch approved by the City Council in 1917. More branches continued to be built to serve the growing city well into the twentieth century. Eventually, the appearance of new branches ceased as the population shrank in the mid-twentieth century.
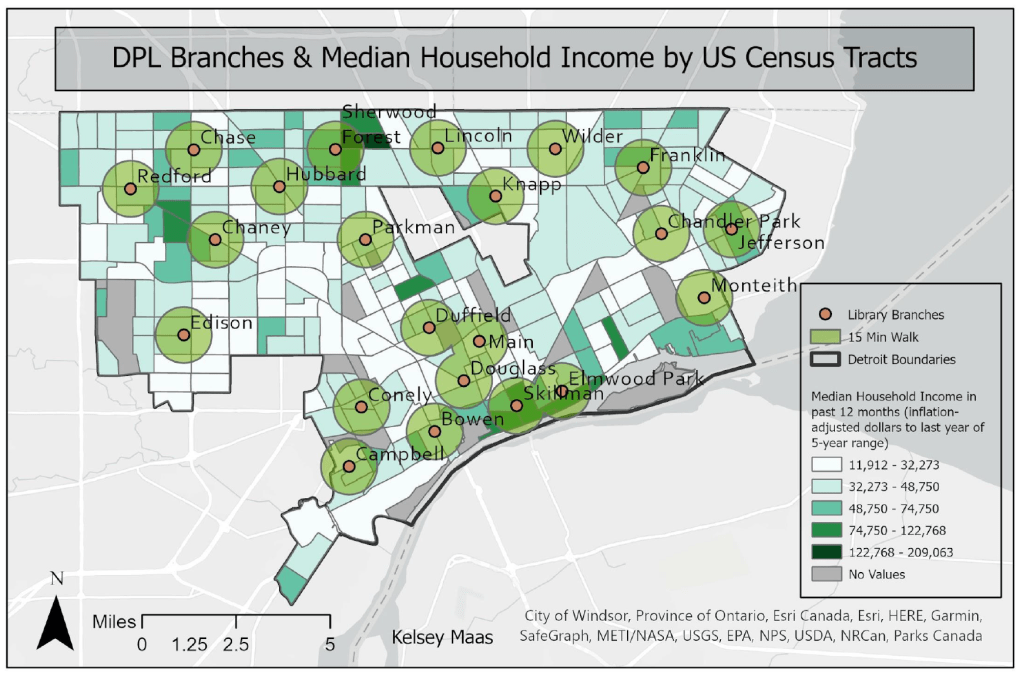
More recently, public and community resources (library branches, public schools, etc) have reduced due to the loss of Detroit residents and disinvestment. As Detroit is geographically large (143 mi), this means residents must travel further to access public amenities. Additionally, limited public transportation options and frequency, further adds to access issues. This project aims to examine who can walk to Detroit Public Libraries and who is left out through a spatial lens. The boundaries are the City of Detroit’s borders. It will highlight the neighborhoods served and underserved by Detroit Public Libraries.
The concept of the 15 Minute City helps to frame walkability. The term was coined by urbanist Carlos Moreno and remains a popular framework for evaluating the livability of cities. The 15 Minute City is an ideal urban environment that is structured at a human scale where residents can get to their everyday needs within a 15 minute walkable or cyclable travel radius. Community benefits from a 15 Minute City design consist of socioeconomic equity (residents are not limited if they do not have a car), less vehicle dependence (reduces carbon emissions), increased walking and biking (better health), and increased standards of living (conveniently located services).
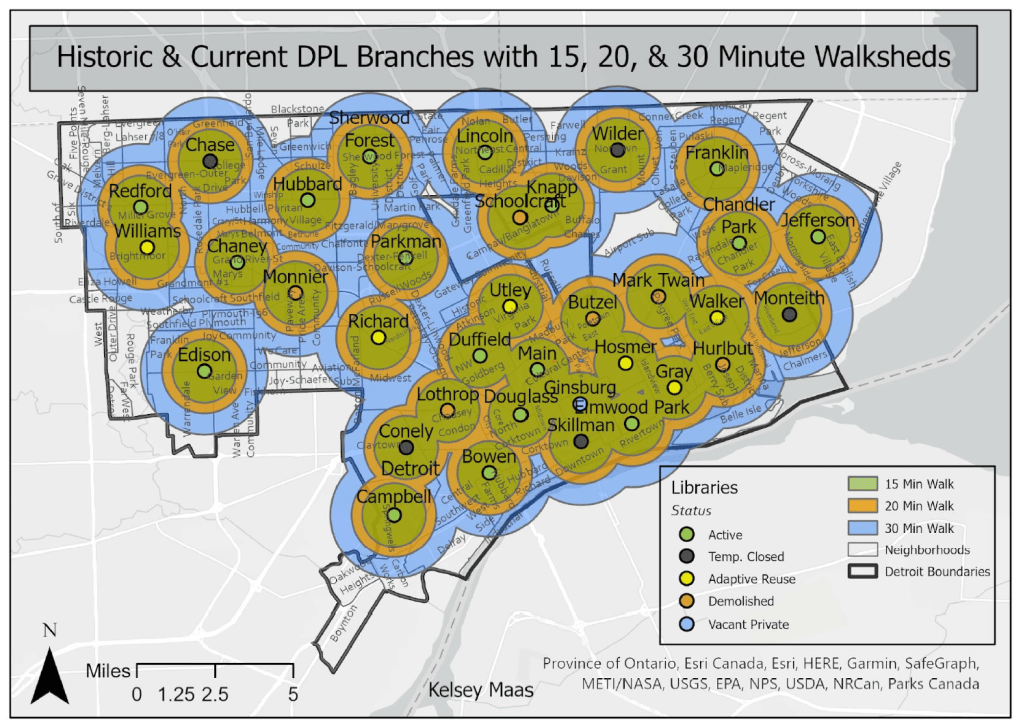
The Detroit Public Library system currently has 22 physical locations. Of these branches, five are temporarily closed. The first set of maps illustrates which Detroit neighborhoods are serviced within a 15 minute (0.75 mile), 20 minute (1 mile), and 30 minute (1.5 mile) walk of a library branch. The map’s buffer distance was calculated per the 15 Minute City framework and methodology.
The maps include both the active and temporarily closed branches with the understanding that the five temporarily closed branches will reopen in the coming years.
by: Andrew Chiles, Wayne State University (Intro to GIS, Fall 2024)
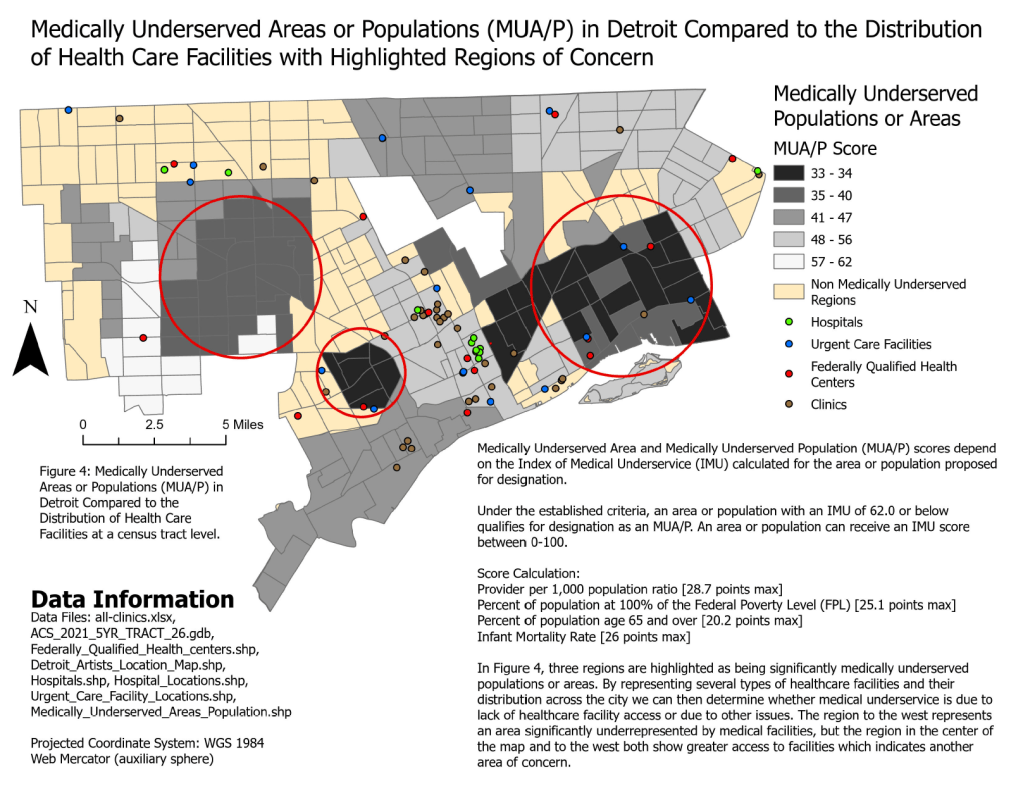
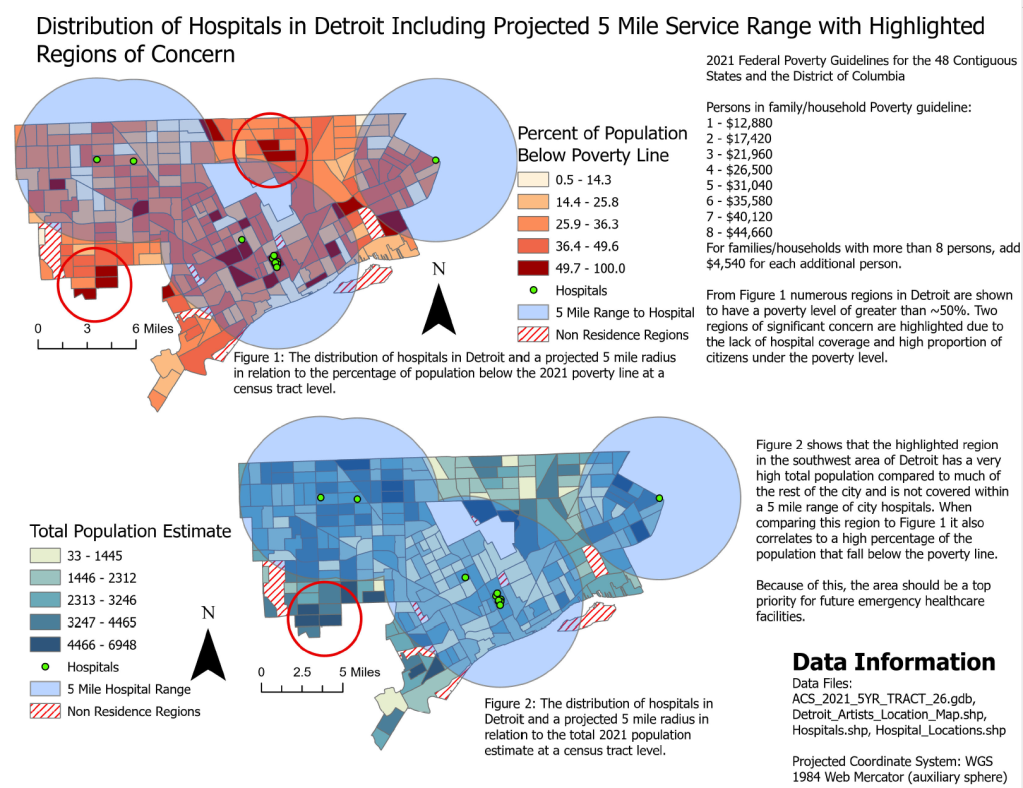
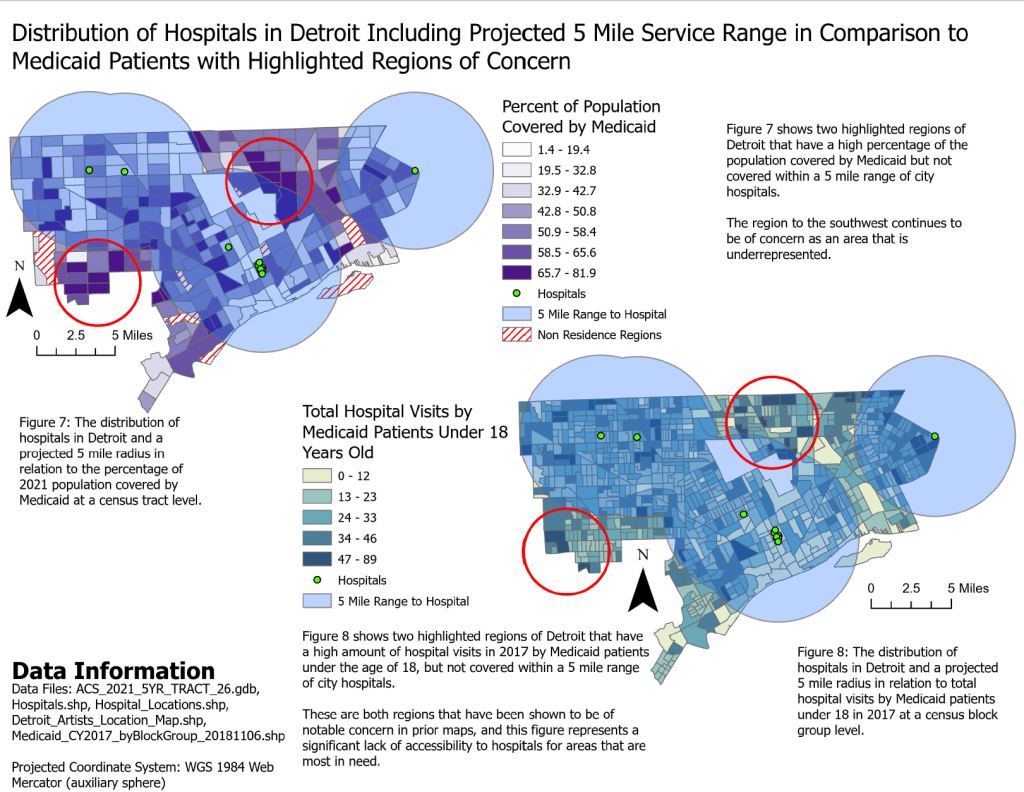
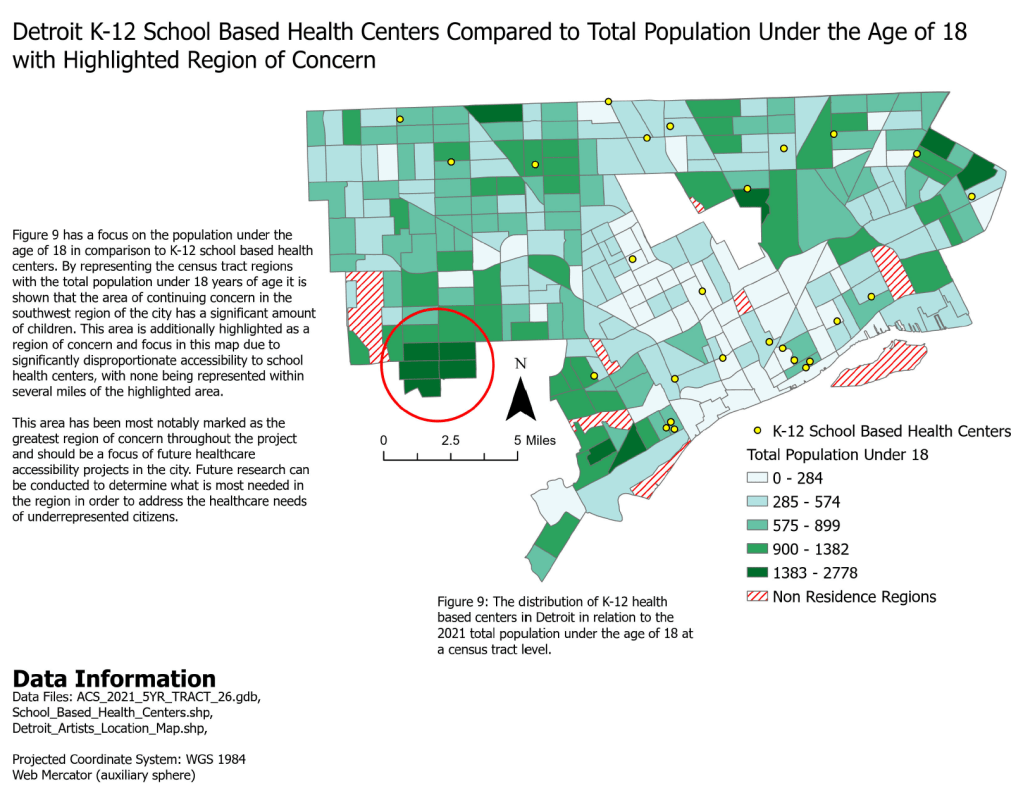
Access to healthcare is a crucial aspect of public health outcomes, even more so in urban areas such as Detroit, where socioeconomic disparities can influence who receives adequate medical care. This project will focus on examining access to healthcare facilities across Detroit, through the use of geospatial data analysis. Specifically, I would be seeking to answer how the spatial distribution of healthcare facilities in Detroit corresponds to varying demographic dynamics within the city, and what gaps exist in terms of healthcare accessibility.
By examining the geographic placement of hospitals, clinics, and other healthcare facilities in Detroit and overlying the data with population metrics and health outcomes, we can identify areas that are underserved by healthcare services and/or disproportionately affected by preventable or manageable diseases and health issues.
This topic is significant in regard to discussions on health equity and urban health disparities. Detroit has been deeply affected by systemic racism in the past and continues to have the lingering effects. This research may help to showcase how it is rooted within public health. The results of which can inform public health initiatives aimed at improving healthcare accessibility and reducing illness prevalence in vulnerable communities.
The geographic focus of the project is the entire city of Detroit, with a detailed analysis at the neighborhood or census-tract level. Detroit is characterized by it’s extremely diverse neighborhoods and communities, many have been shaped by historical patterns of disparities and economic disadvantages. By focusing on the entire city, we are able to capture the spatial variations in healthcare access and diseases to explore how they differ across different parts of the city. Neighborhoods of specific interest or concern will be highlighted and focused on to showcase these disparities across the city.
The data used in the project is from DetroitData and Data Driven Detroit (D3), catalogues of opensource data for the Detroit community, as well as the 2021 TIGER/Line Demographic and Economic Data and 2020 TIGER/Line zip code tabulation areas from the US Census Bureau. Additional reference material comes from the US Department of Health and Human Services – Office of the Assistant Secretary for Planning and Evaluation (ASPE) and the Health Resources & Services Administration (HRSA).
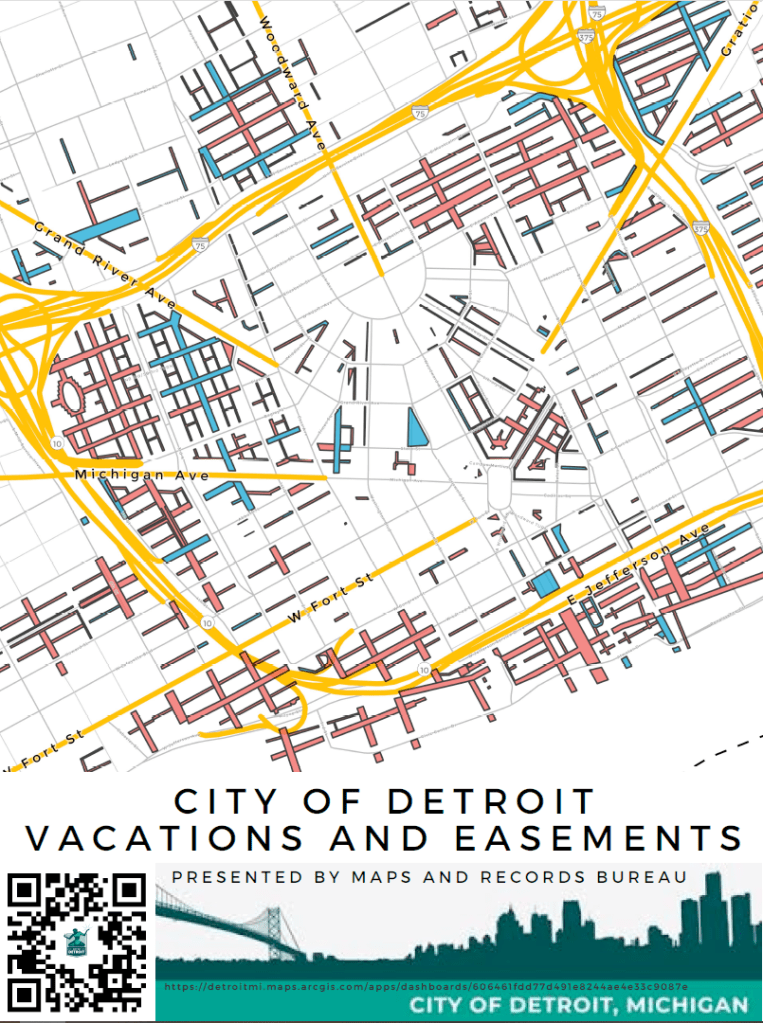
by: Yanyun Li, Jered Dean, Houjon Ding, Raven Wright – City of Detroit
This layer indicates all streets and alleys vacated ‘Outright’ and vacated with conversion to utility easement in the City of Detroit. This layer is updated regularly.
by: Steven Wiltse, Martin Denicolo, Zachary Manning, Kevin Zhang, Tess Parr – City of Detroit
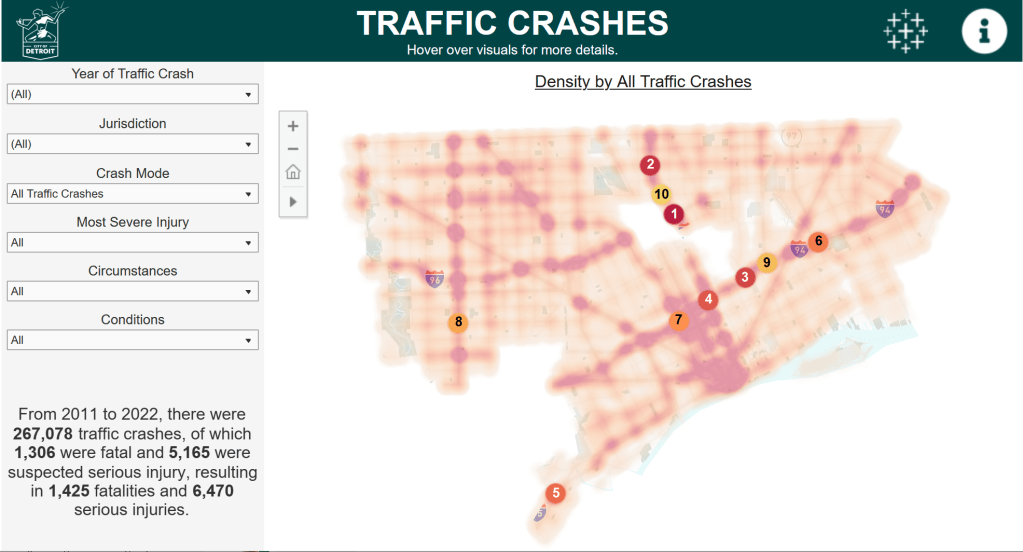
The City of Detroit has launched its Open Data Portal Analytics initiative in order to increase public access and understanding to valuable data and information that is posted on the Open Data Portal as raw datasets.To that end, the Traffic Crashes dashboard was built to visualize 267,078 traffic crashes that occurred in the city of Detroit from 2011 to 2022. The dashboard’s visual elements include a heatmap of traffic crashes with top 10 intersections, a highlight table of crashes by time and day of the week, and a histogram of crashes by type.Users can apply filters on the dashboard to explore deeper trends in the data. Drill-downs include the road jurisdiction, modes involved (e.g. automobile, pedestrian, bicycle, etc.), most severe injury to occur, circumstances involved in the crash (alcohol/drug use, red light running, speeding, etc.), and conditions at the time of the crash (rain/wet, snow/ice, dark-unlighted, etc.). The filters dynamically change all the elements on the dashboard, including written descriptions.The Traffic Crashes dashboard was built in Tableau Desktop and embedded in an ArcGIS Experience Builder application.
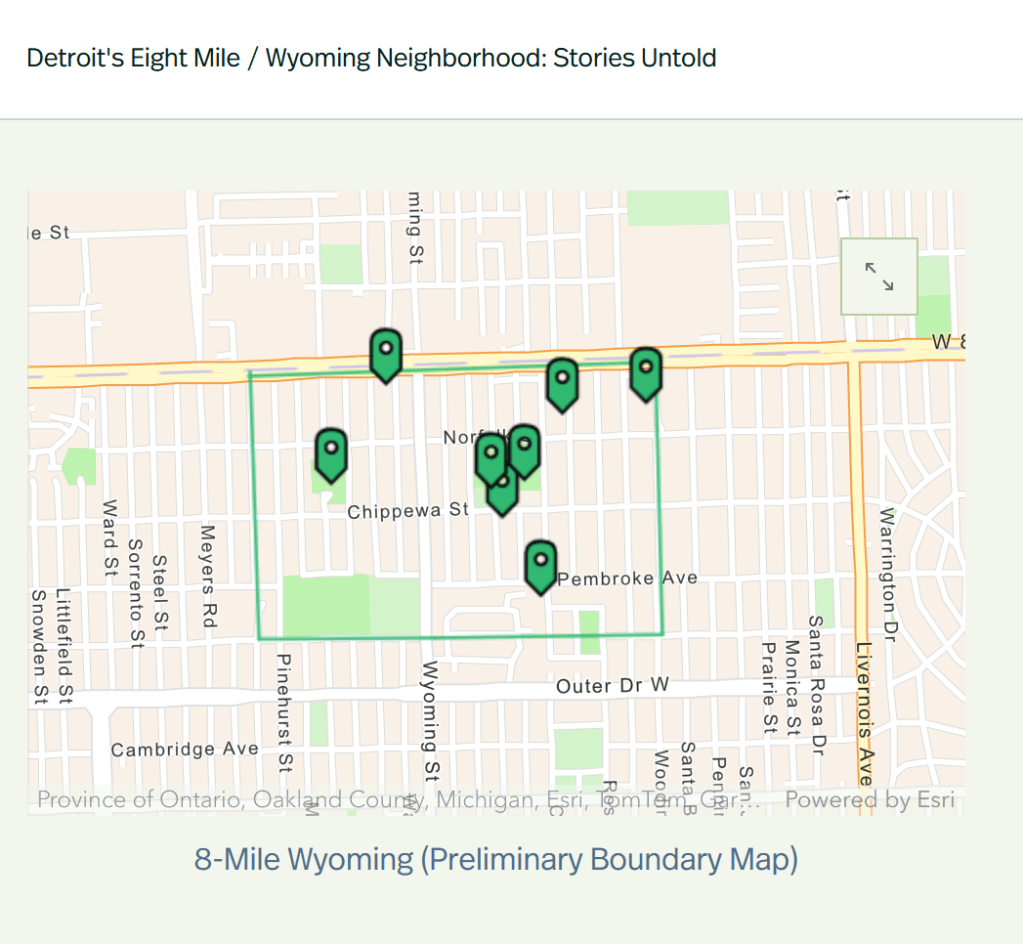
by Kelsey Maas & Megha Bamola – City of Detroit, Historic Designation Advisory Board (HDAB)
Detroit’s Eight Mile-Wyoming neighborhood is the oldest Black neighborhood in Northwest Detroit. The neighborhood signified a starting point for many working-class Black Detroiters; one of homeownership, hopeful revitalization, and a sense of community. Numerous resources remain in the community that highlight significant moments in African American and Civil Rights history. We invite you to explore these sites with us and learn more about the people and places of Eight Mile-Wyoming! This Story Map was a part of the Eight Mile-Wyoming Intensive-Level Survey project and was supported in part by an Underrepresented Communities grant from the Historic Preservation Fund administered by the National Park Service.
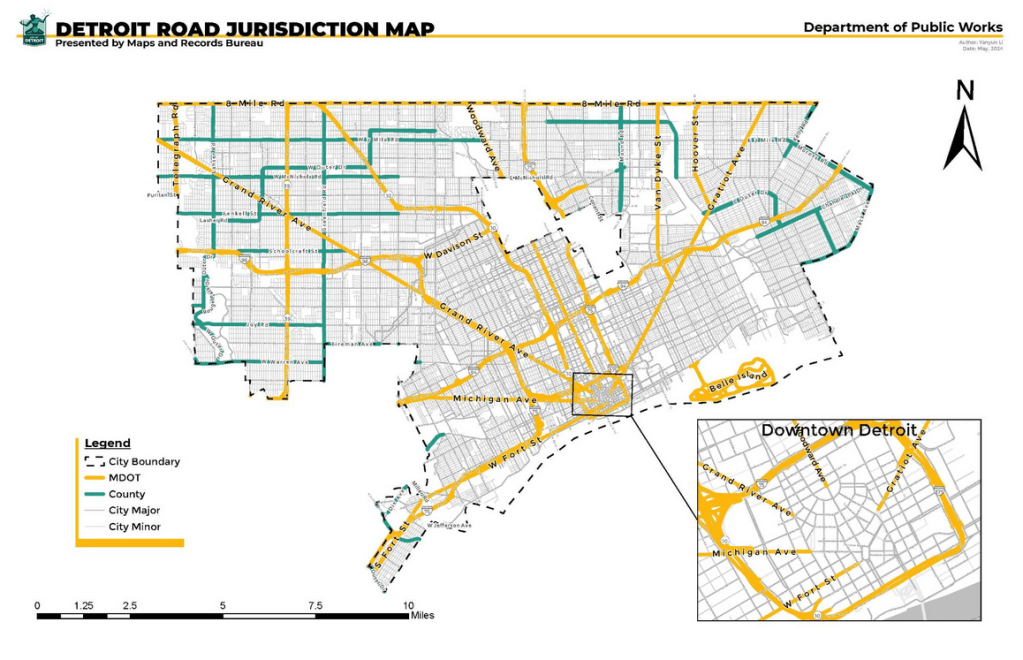
by: Yanyun Li – City of Detroit, Department of Public Works (DPW)
The jurisdiction map of Detroit delineates city, county, and MDOT territories. City-owned roads include city minor and city major. MDOT’s highways serve as vital conduits linking Detroit to broader networks. This map will serve as a valuable tool for promoting efficient city right-of-way governance, fostering collaboration, and guiding urban development.
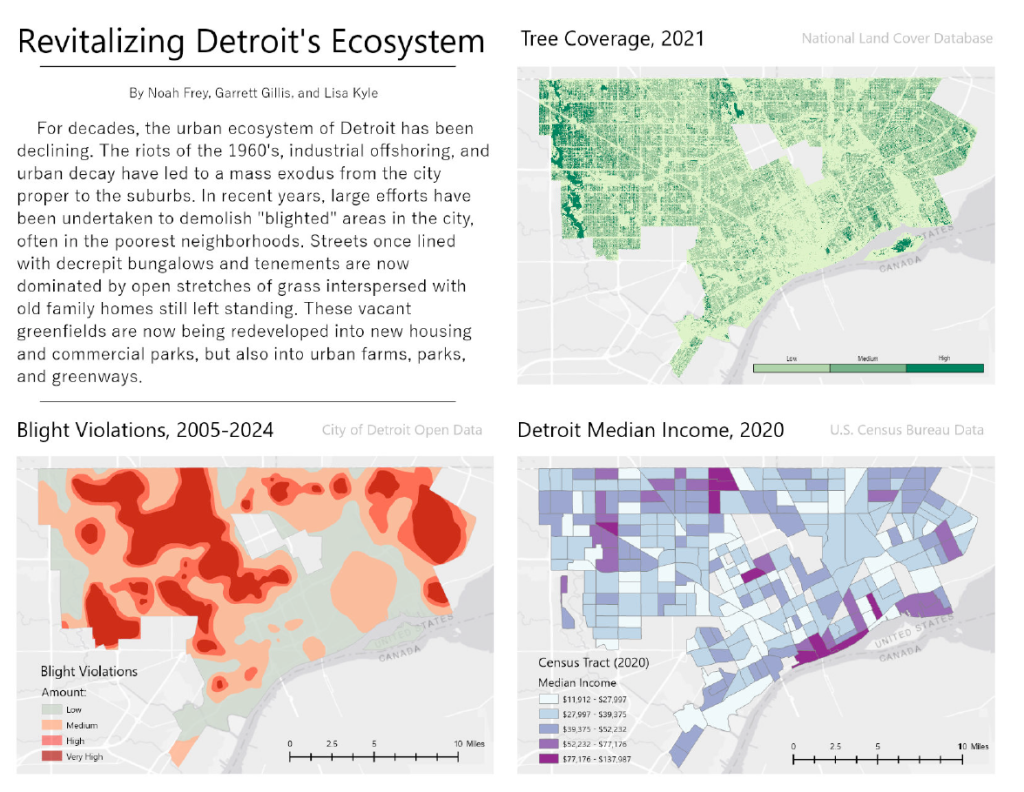
by: Lisa Kyle, Garrett Gillis, Noah Frey (Wayne State University)
We chose to focus on the present development of Detroit because, in our view, the city is at a crucial precipice. The latter half of the 20th century was not kind to our city — but recent blight removal projects give us a unique opportunity. That opportunity is, of course, to rebuild the city with modern values and sustainability in mind.
In terms of visual presentation, this project contains three maps representing different aspects of Detroit’s urban environment. We wanted the layout of the poster to be colorful, yet sleek and organized. Each map is laid out in an array so as to provide easy reference to the others. No dataset exists in a closed environment; trends, history, and real world knowledge can be obtained from a close look.
Other Research: – U.S. Census Data (2020) – Tree cover, National Land Cover Database (2021) – Detroit Daffodil Map – Bees in the D Map – City of Detroit Riverfront Trail Network Map
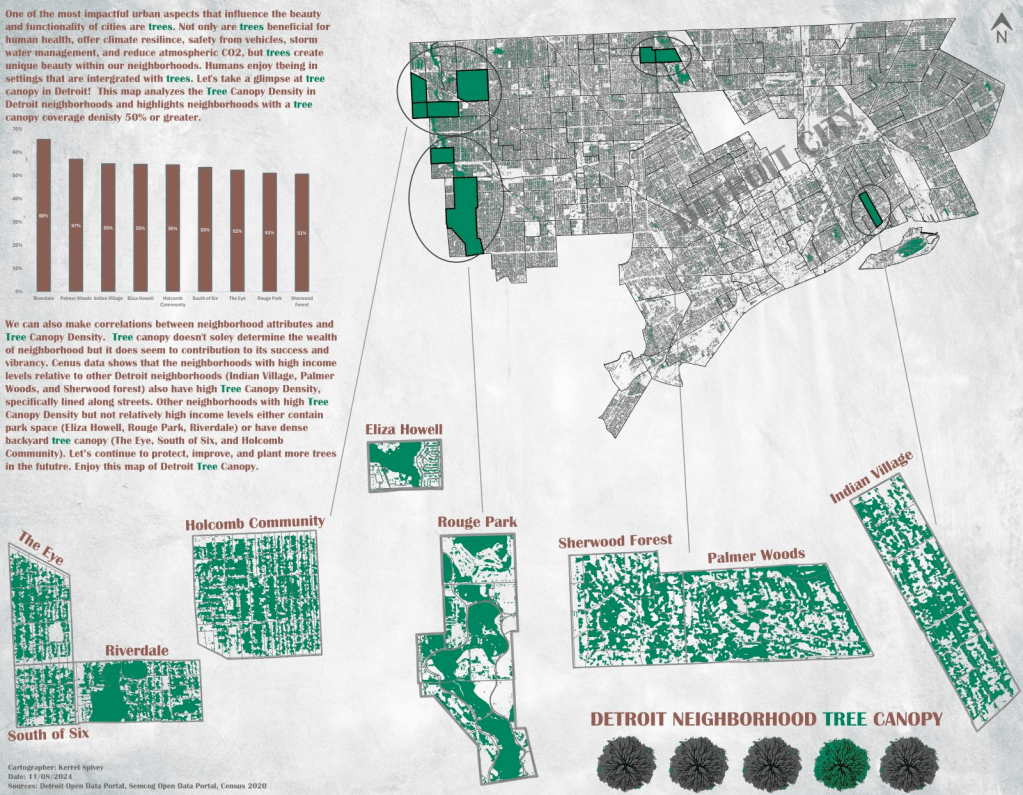
Detroit, once known as a tree-filled city before its urban decline starting in the 50s and the emerald ash borer invasion beginning in 2002, has experienced landscape change over the decades. Neighborhoods within a city can be defined by their people, setting, and character. Trees influence all three of these by improving the mood of residents, beautifying the landscape, and creating unique features. This map looks at neighborhoods with the highest tree canopy density (greater than or equal to 50%) and what we can learn about those areas because of their higher density.
Whether high tree density is lined on the streets of a neighborhood, occupy park space, or fill large backyards these areas can experience numerous benefits. From healthier environments to thermal control and from community cohesion to economic stability it is important for any urban environment to maintain and grow trees. Traveling in a neighborhood filled with sprawling sycamores and large oaks brings a feeling of tranquility and inspiration. Its clear the benefits of looming tree canopy in an area are extremely valuable. Let’s increase of tree planting efforts in Detroit for current and future generations to enjoy.