Welcome to our Data Forum where we will discuss wildlife in the city. Join us online for lunch-and-learn filled with insightful discussions, tips, and tricks on all things related to the data.
We’ll be joined by the Nyeema Harris from the Yale University, Ava Landgraf of Detroit Bird Alliance, and Joanne Coutts, who has mapped animals along Detroit’s historic waterways.
Don’t miss out on this opportunity to connect with fellow data enthusiasts and expand your knowledge.
WHEN: Friday, October 24th, 12:30-1:30pm
WHERE: Virtual
WHAT: Join us for our Data Forum where we will discuss wildlife in the city!
Make it count! Detroit By The Numbers latest monthly segment on the Authentically Detroit podcast is live! We highlight significant data and numbers from the past month for Detroiters!
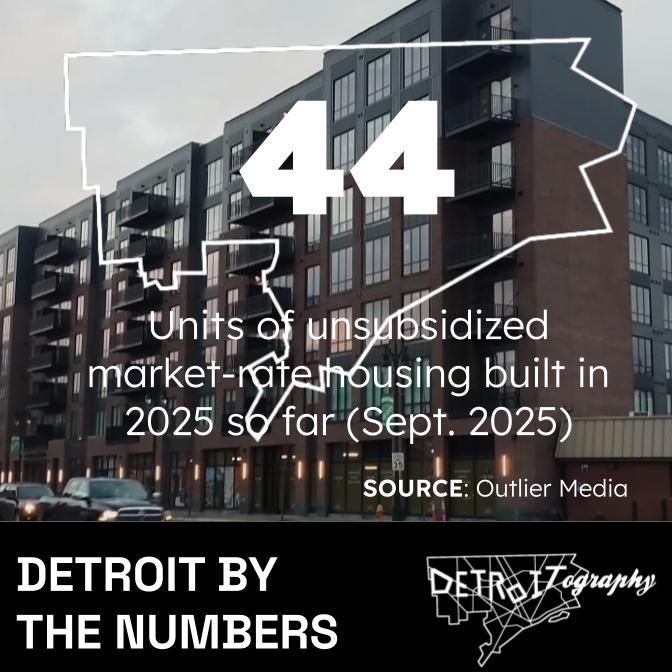
Units of unsubsidized market-rate housing constructed so far in 2025. Many apartment buildings are going into foreclosure. Property insurance has doubled in the last few years. Interest rates are up, making loans or refinancing more expensive. Construction and maintenance costs are still sky-high. And Detroit has some of the highest property tax rates in the country. There are strong concerns that rent prices will increase to cover costs. (Outlier Media).
100%
The pay gap between commuters and Detroiters with jobs is double (average commuter wage is $100,000 vs. Detroiter wage is $53,000). The recent City of Detroit University Economic Analysis Partnership highlighted this disparity. Commuters hold almost 75% of all jobs in Detroit. Tracked from 2010 to 2020, the gap has only gotten worse. (Axios)
48,823
DPSCD student enrollment is up! This same time in 2024: 48,386 and 2023: 47,401. “As of Day 11, we are trending 437 students more than last year and 1,422 more students as compared to two years ago,” Vitti said. Total enrollment: 52,505 K-12 students are enrolled in DPSCD compared to 2024: 53,044 students. (BridgeDetroit)
20
This is really important, but we don’t think about it as much as we should. Detroit is bordered by 20 other local municipalities including two fully surrounded by the city, and one international city (making it 21?) – Windsor (239 municipalities in 7-county region). Shoutout to the Greater Detroit Windsor Project Conference set to happen at the WSU Law School on October 17th to explore connections and opportunities in our region!
Agendas and speakers to follow. Don’t miss out on this unique opportunity to be a part of a dynamic community dedicated to driving positive change in the region. Reserve your spot today!
WHEN: Friday, October 17th, 8:30am-4:30pm
WHERE: Wayne State University Law School, Spencer M. Partrich Auditorium
WHAT: This day long event will bring together professionals, experts, and enthusiasts from across the region and both sides of the Detroit-Windsor border to explore innovative ideas and foster partnerships.
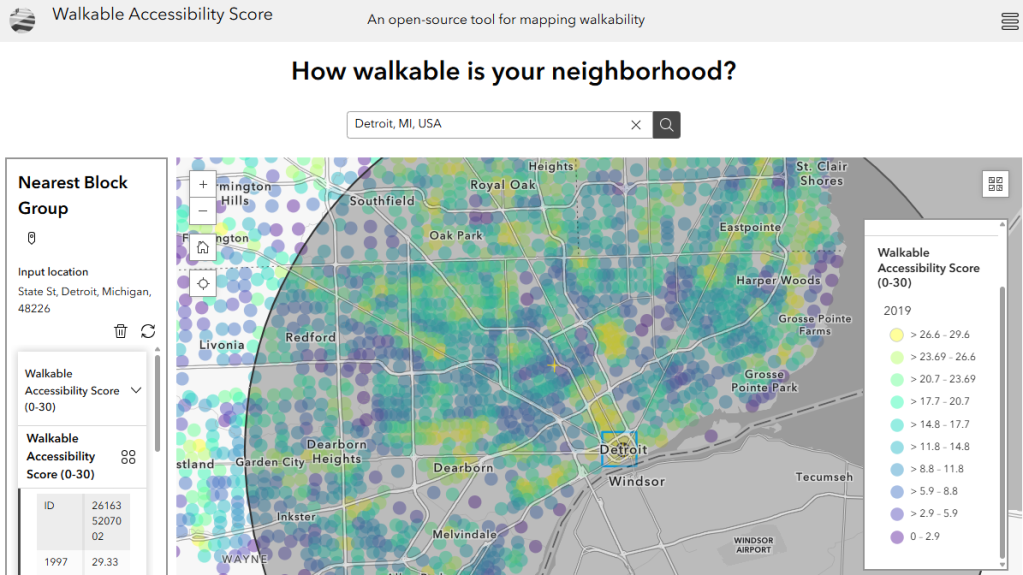
… the Walkable Accessibility Score measures the average accessibility to nearby urban amenities from neighbourhood centers. To create the WAS, we first calculate the distance from every block group centroid (shown on the map above) to the nearest30 grocery stores, pharmacies, retail shops, banks, bookstores, schools, parks, hotels, restaurants, cafes, and bakeries. Then, the distance to each of these amenities is weighted by how far away it is from the block group centroid, up to a maximum distance of around 1600m. A block group with 30 amenities all located within a very short distance of its center (e.g., 400m) recieves a full value of ’30’ for the WAS. Using POI data, we are able to calculate the WAS for every block group in the continental US for every year from 1997-2019. For more detail, see the full paper here.
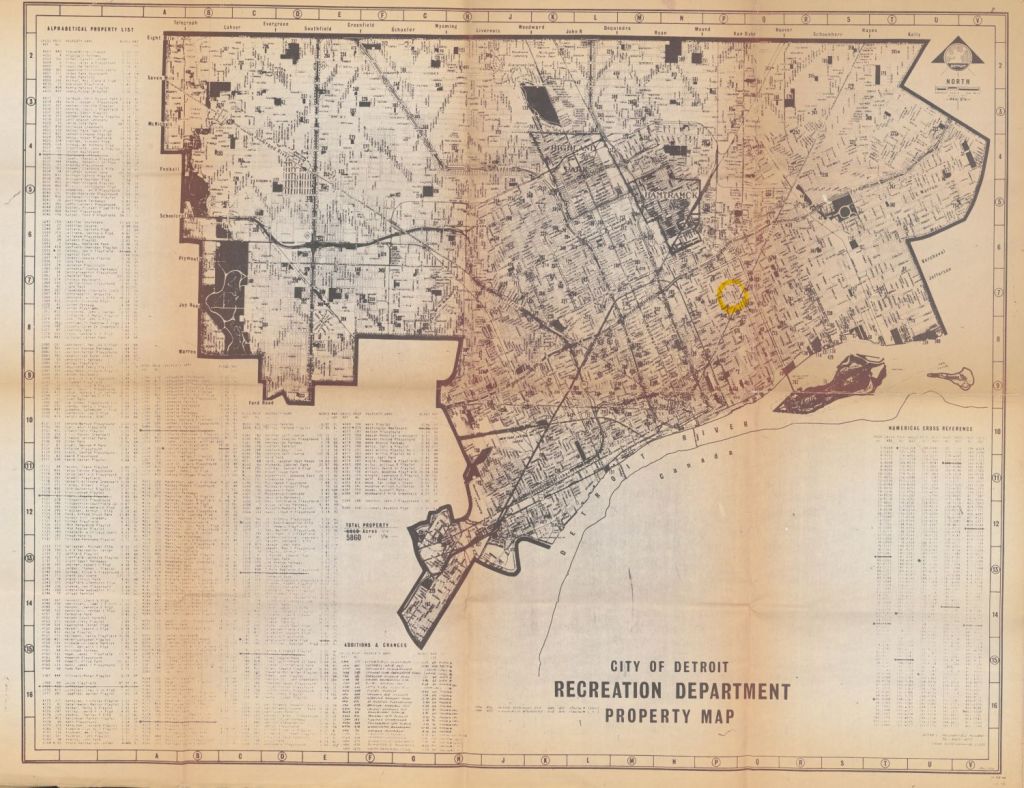
I can’t remember where I found this map, but I’m glad that I did. The map is huge and could only be scanned using the large format, flat-bed scanner at the Reuther Library. This map is printed on this heavy paper, thick to the touch almost like a stiff fabric.
The map has some weathering and discoloration, but was clearly a map in active use from at least 1972 to 1976. What I love most about it is the active crossing out of property locations, like the “Seward 12th Playlot” and the active “Additions & Changes” including name changes, like “Seward-12th Playlot.” The map total the acres for the recreation Department at 5850 as of 1/72 (January 1972) and 5860 as of 1/76 (January 1976). There is a mystery highlighted circle at Mt. Elliott north of Gratiot. What was the Recreation Department planning in 1976?
This map is part of the Hill Map Collection digitized in partnership with the Reuther Library and Archives as part of the Detroit Atlas Collaboration funded in part by the WSU Union of Part Time Faculty (UPTF) Professional Development Fund.
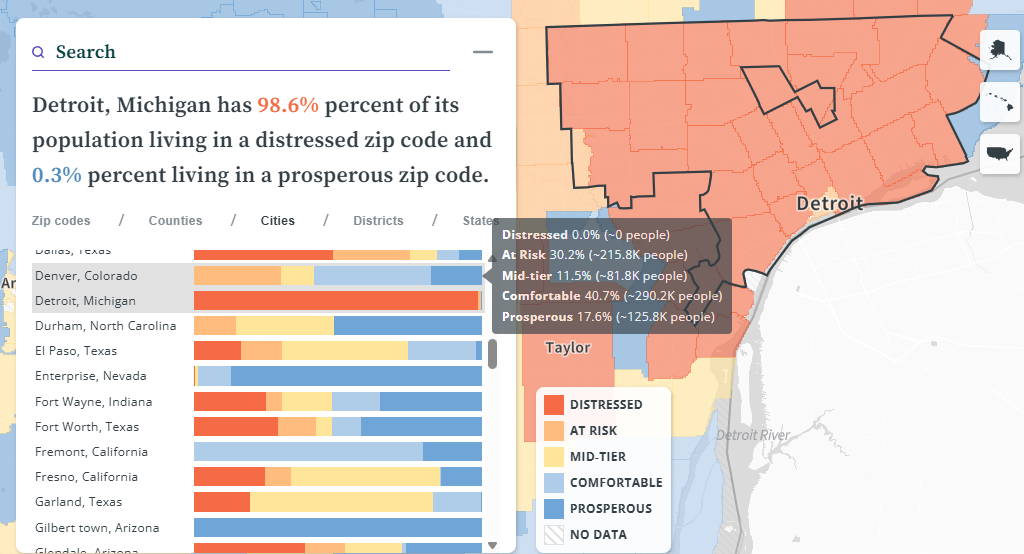
I don’t generally look to these index rankings of Detroit, but the comparisons are powerful. Detroit is a donut hole in the region; surrounded by communities of higher prosperity and higher opportunity. The city sits on par with Cleveland, Buffalo, Newark, and Memphis.
What are the known strategies and policies that build opportunity in distressed communities?
Make it count! Detroit By The Numbers latest monthly segment on the Authentically Detroit podcast is live! We highlight significant data and numbers from the past month for Detroiters!
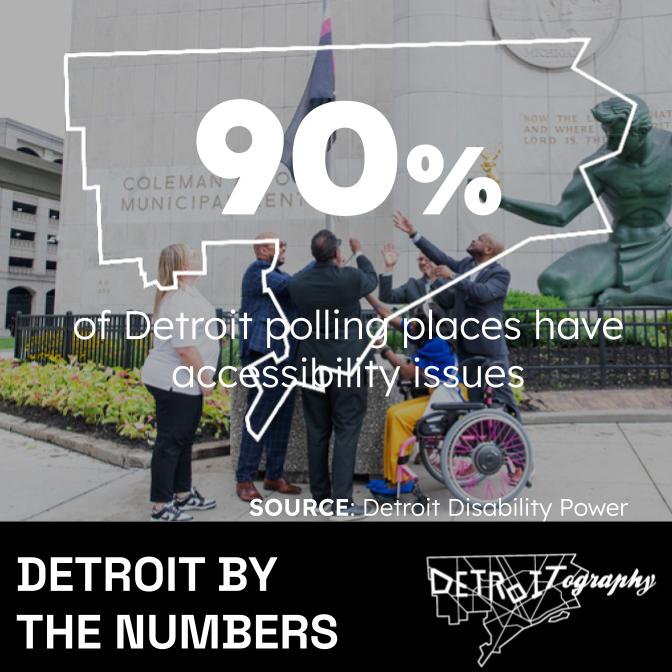
The overwhelming majority of polling places have accessibility challenges. Detroit Disability Power (DDP) have conducted a regular poll audit and recently updated their polling place audit, “accessibility problems at more than 90% of Detroit polling locations” – you can now check your polling place and its accessibility at VoteDetroit.org (WDET)
$144M
Total investment in Belle Isle since 2014. Michigan Department of Natural Resources and the Belle Isle Conservancy have launched a survey, open through Labor Day, asking visitors to rank potential investments. (Planet Detroit)
96
Events for Detroit Month of Design next month. Check out the list of locations and events back to 2019 on DetroitData.org (DetroitData).
Bonus: check out our recent Data Forum on Arts and Creative Ecosystems (Youtube)
$2M
$2 million has been spent ($2.5M raised) by mayoral candidates in the primary already. The bulk of the funding was raised by Mary Sheffield ($1.3M) which is on track with Mayor Duggan’s re-election bids in 2018 ($1.2M) and 2021 ($1.1M). (BridgeDetroit)
Welcome to our Data Forum where we will discuss traffic data, mobility, and safety in the city. Join us online for lunch-and-learn filled with insightful discussions, tips, and tricks on all things related to the data.
We’ll be joined by the Darius Mason from the City of Detroit’s Office of Mobility Innovation, Patrick Bowman of UM Transportation Research Institute, and Jenya Abramovich from SEMCOG.
Don’t miss out on this opportunity to connect with fellow data enthusiasts and expand your knowledge.
WHEN: Friday, September 19th, 12:30-1:30pm
WHERE: Virtual
WHAT: Join us for our Data Forum where we will discuss traffic data, mobility, and safety.
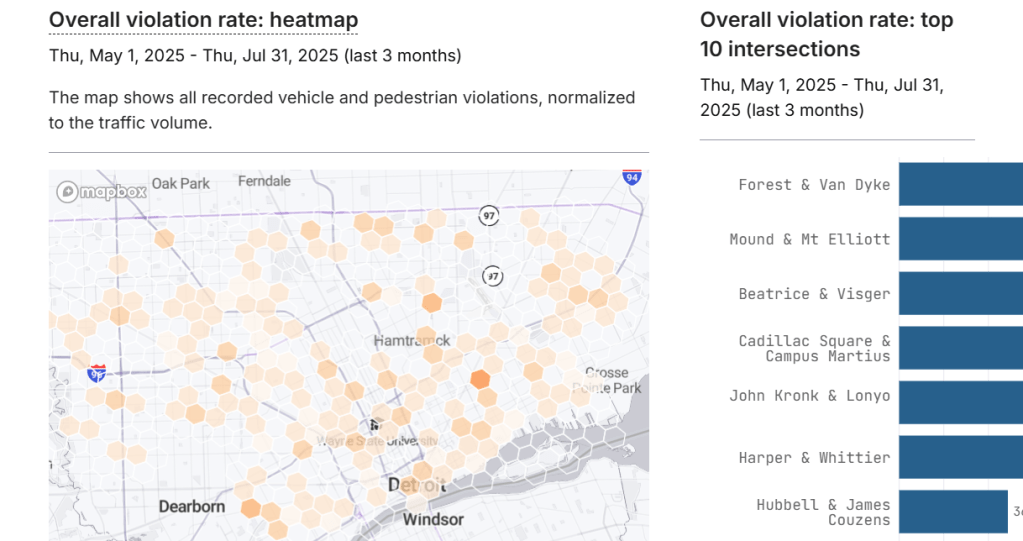
The City of Detroit has launched a new tool to track road safety:
The Detroit SMART MODES dashboard is officially live! This powerful new tool uses real-time data to detect near-misses and support smarter, safer street design across the city. Developed in collaboration with leading tech partners and community stakeholders, the dashboard marks a major step forward in making Detroit’s mobility system more connected and people-centered.
By streamlining the analysis and intervention process, Detroit MODES aims to significantly reduce the time required to address traffic safety issues, ultimately saving lives and enhancing the overall efficiency of the city’s transportation system.
I really enjoyed collaborating with Sidewalk Detroit on developing trail maps and wayfinding markers for Eliza Howell Park. My early foray into mapping was when I was in high school and used by uncle’s handheld GPS to trace trails at a local park that did not have an accurate trail map. I used an early GIS program to load the GPX files and created the finished product by hand. It was exciting to apply my collected years of GIS mapping to create these updated trail maps.
The Sidewalk Detroit team had done an incredible job of tracking and planning what they wanted to see on these maps. I dove headlong into best practices for trail maps and wayfinding design. One data oddity was that we discovered the data file for the Rouge River sourced from the EPA was not accurate. Based on the Sidewalk Detroit team knowledge and some satellite imagery referencing, I updated the correct curvature of the Rouge River through the park.
Welcome to our Data Forum where we will discuss the arts and creative institutions in the city and their connections. Join us online for lunch-and-learn filled with insightful discussions, tips, and tricks on all things related to the data.
We’ll be joined by the Kevin Gilboe from DesignCore, Steve Panton of Essay’d, and Nafeesah Symonette from Detroit Excellence in Youth Arts (DEYA).
Don’t miss out on this opportunity to connect with fellow data enthusiasts and expand your knowledge.
WHEN: Friday, August 15th, 12:30-1:30pm
WHERE: Virtual
WHAT: Join us for our Data Forum where we will discuss arts and the creative ecosystem in Detroit.
I’m so excited that Detroit By The Numbers will be a new monthly segment on the Authentically Detroit podcast! We’ll highlight significant data and numbers from the past month for Detroiters!
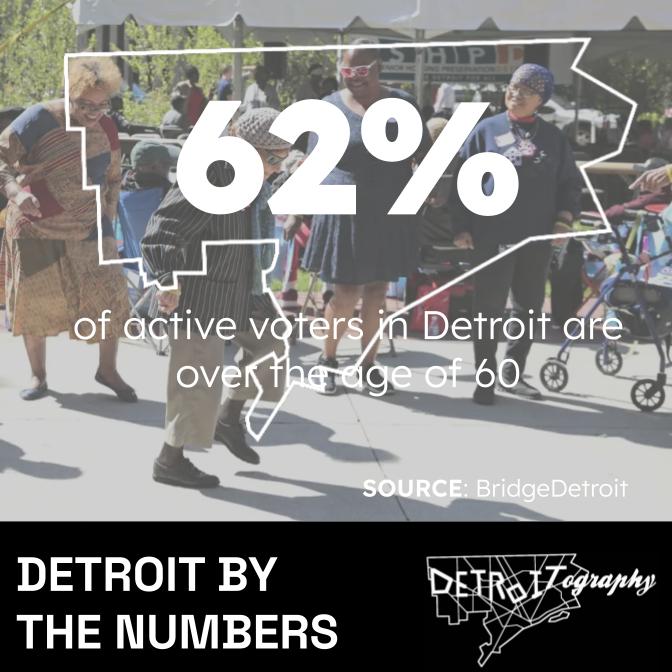
percent of active voters are aged 60 or over (BridgeDetroit). If you need to check your voting options and polling place visit VoteDetroit.org
163.5
acres of land that will be devoted to Detroit’s solar neighborhoods. The largest solar array to date was 10 acres at O’Shea Field. The new “solar neighborhoods” will take up space as large as Downtown Detroit. Check out our impact assessment on heat effects, tree canopy, and impervious surface (DETROITography). Bonus: check out our recent Data Forum on Clean Energy (Youtube)
40
city buses went out of service in the last 2 weeks. DDOT has cleared the hurdles of low numbers of bus drivers and bus mechanics, but many buses on the fleet are still aging out. The loss of the 40 buses has caused significant service disruption. (Transit Riders United)
26%
the low estimate of homeowners without home insurance in Detroit. The higher estimate is 41% of Detroit homeowners without home insurance. 18 of the 25 ZIP codes with the highest home insurance premiums are located in Detroit. Crime rates, credit scores, and the age of homes factors into the high premiums, but others have likened it to modern-day redlining. (Outlier Media/DetroitData)
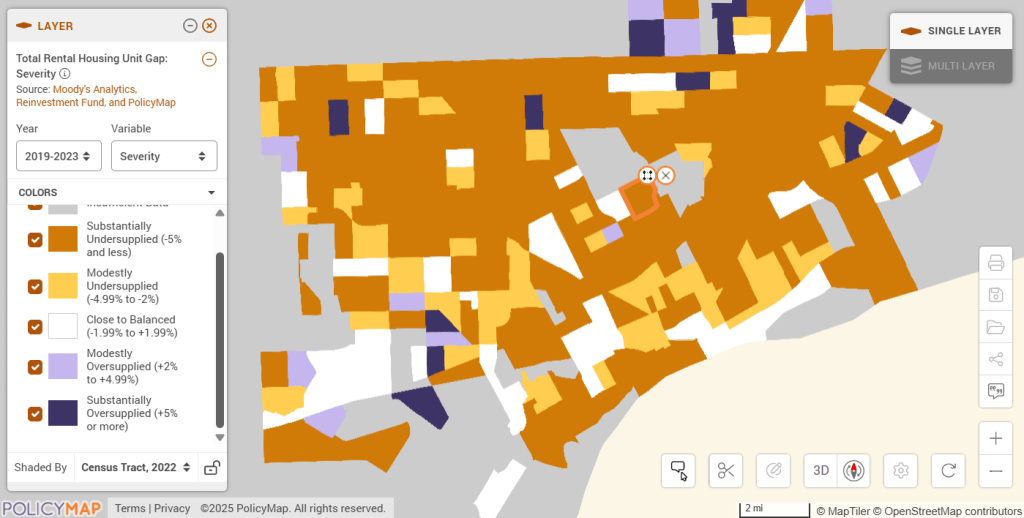
Moody’s may have increase Detroit’s credit rating over the years, but Moody’s Analytics still recognizes the difficulties and gaps in serving Detroiters. Rental housing in Detroit in particular is an on-going discussion with efforts to finance “affordable housing,” renovate formerly vacant homes, and improve quality of property management while at the same time reducing requirements on landlords.
The rental housing gap as defined by Moody’s is:
The total number of renter housing units below or above expectation is the difference between the current number of renter vacant units in a census tract and the expected number of renter vacant units in a “normal” market.
Citywide, nearly all Census Tracts are considered to be a “substantially undersupplied.” Big data caveat here is what Moody’s considers to be a “normal market” because Detroit has the furthest thing from a normal housing market and I couldn’t even predict when that might start to change. Still today, there exists the possibility of purchasing a home for $1,000 as well as a Downtown condo for over $1 million. The abnormal housing market data also needs to be paired with the fact that most Detroit households are housing burdened, where they are spending 30% of their income on their housing needs.
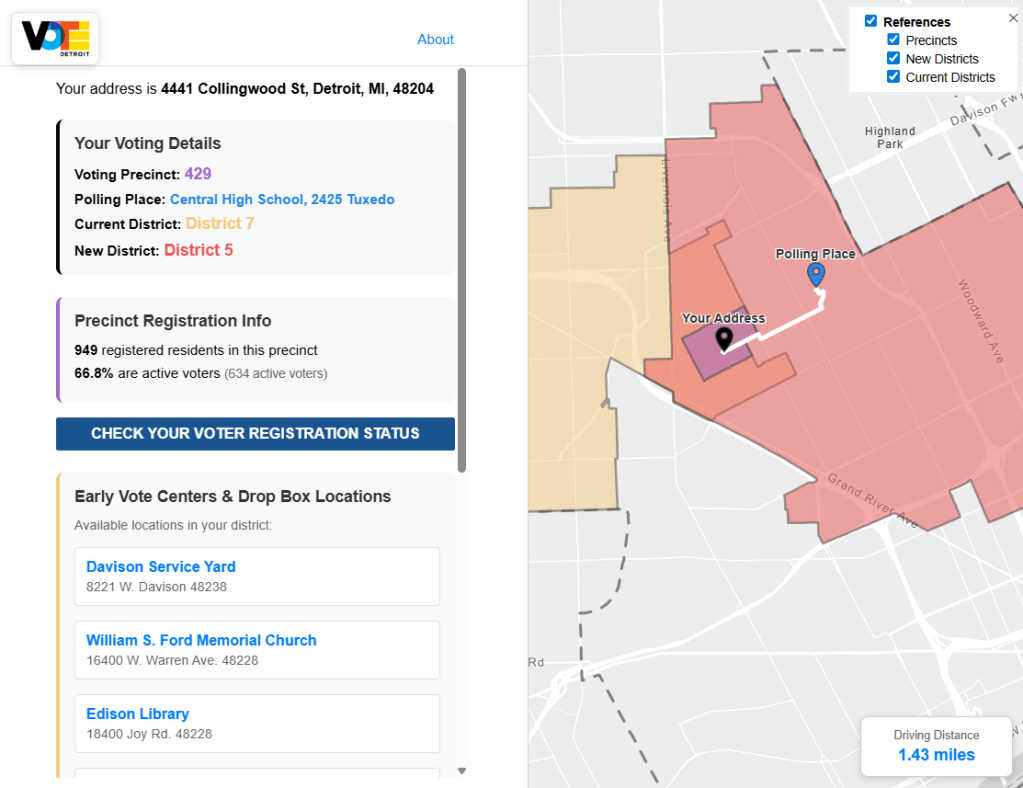
Web application developed by Marie Yu and Aditya Tambe for DETROITography
Knowing where to vote and how to get there should be the easy parts of voting. Democracy depends on engagement and Detroit has relatively low levels overall from the loss of city services, emergency management, and general apathy towards local government. We’ve built a tool that helps anyone work through their voting options based on their address: VoteDetroit.org
“Detroit’s future demands a functional and dependable government. Change – real change – can only happen when we start making the connection between voting and quality of life. Only through rigorous, informed participation will we say our city – our democracy – matters. The time is now. Every city resident needs to be here, be informed and be heard.”
The Department of Elections should be building these tools and making voting information publicly available. Thanks to Malachi Barrett for FOIAing the 2025 Primary Polling Places and many internal city government employees or vetting and verifying data that should be reliable open data.
The VoteDetroit.org tool allows you to check if you have been redistricted into a new City Council District as well as check your assigned polling place based on your voting precinct. Early in-person voting is available at the Department of Elections starting June 26th until August 4th and at Early Voting Centers across the city on July 26th until August 3rd.
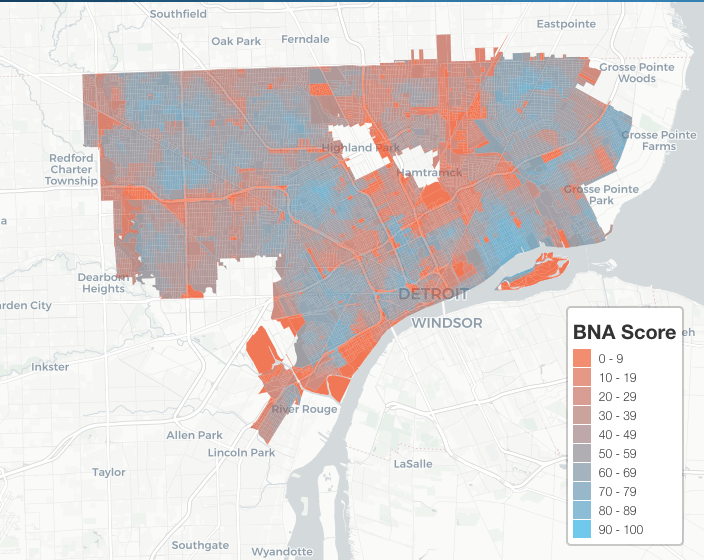
The 2025 City Ratings are out from People for Bikes. In the past, Detroit has not scored very well but some methodological changes have helped give a clearer picture of where Detroit stands among other global, United States, and Midwest regional cities. One area that dings Detroit is the presence of bike lanes with parking, which is true for almost all bike lanes in the city. The difference is that Detroit has the bike lane along the curb and car parking next to the roadway – more ideal for people on bikes.
The bike network in Detroit has some clear wins with well connected neighborhoods, but what appears to be more islands of bikeability rather than a connected city until the Joe Louis Greenway is completed near the end of 2030. I think most of my friends on bikes often are coming from Hamtramck which has almost no “bike network” connecting to Detroit.
city-sponsored Arts Alleys over the next month and has commissioned 47 artists to install art in the alleys (City of Detroit)
31
updated polling places for the 2025 Detroit Primary on August 5th. Check your polling place and precinct at: VoteDetroit.org (DETROITography)
2,519
families displaced in Detroit’s Black Bottom area with 92% being families of color. The total number of people is unknown, but Rod Arroyo, planning professional consulting for the MDOT I-375 project estimates 36,000 people. (Renewing Inequity, BridgeDetroit)
$50,000
City of Detroit awarded funds from Bloomberg Philanthropies to better merge property data into one common database and will compete for $1M global prize (Detroit Free Press)
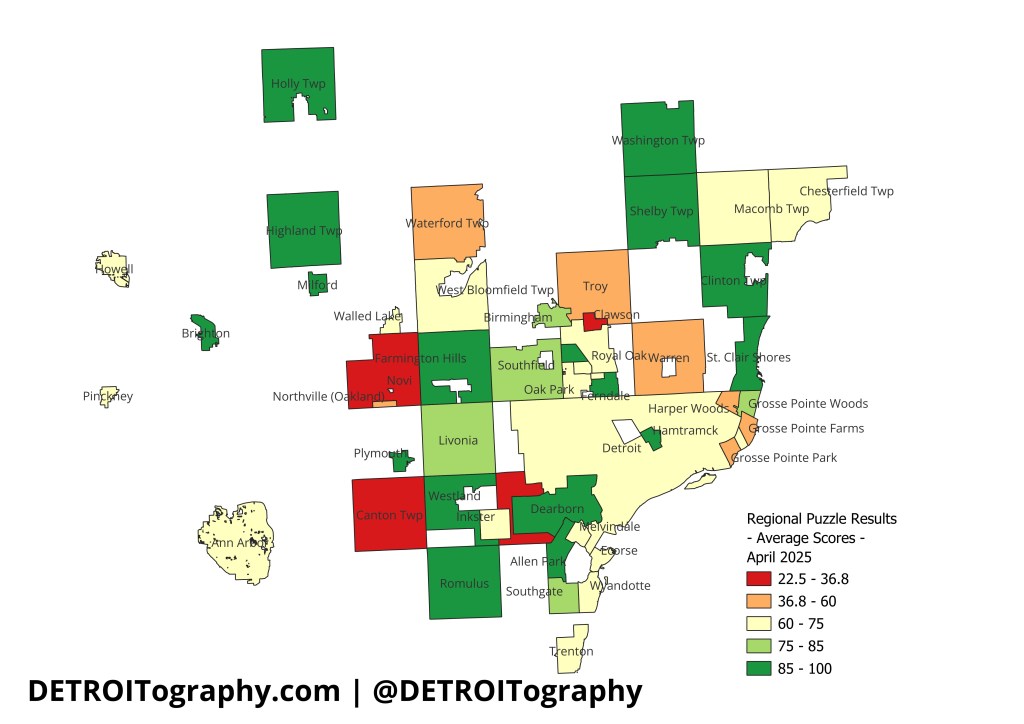
Since launching the map puzzle in September 2024, we’ve had almost 400 puzzle submissions from cities and municipalities across the 7-county region. The puzzle asks users to place all the municipalities correctly that border the City of Detroit. The average results are presented here with the caveat that small numbers of people have submitted from certain areas.
What stands out is that Detroit scores poorly in correctly identifying its own neighbors. The Grosse Pointes score even worse than Detroit, while western Wayne County areas really know their region well. Hamtramck does very well, but maybe that’s because everything is a border to residents there?
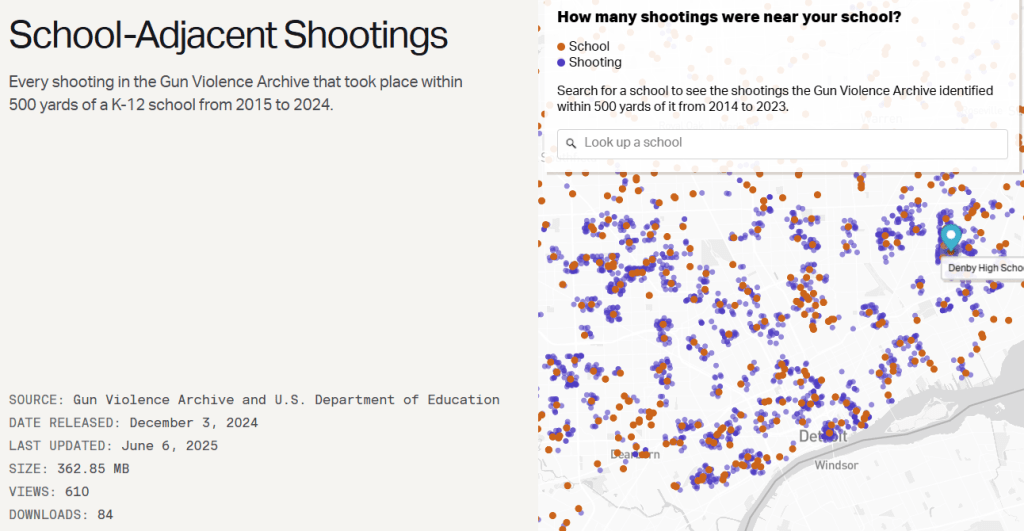
Gun violence affects so many young people in Detroit and the trauma of experiencing violence and losing someone to violence has lasting effects. I had this exact analysis in my head for a number of years, but glad to see team at The Trace tackling it across the country. On the map you can search for a school name and see how many shootings happen within 500 yards.
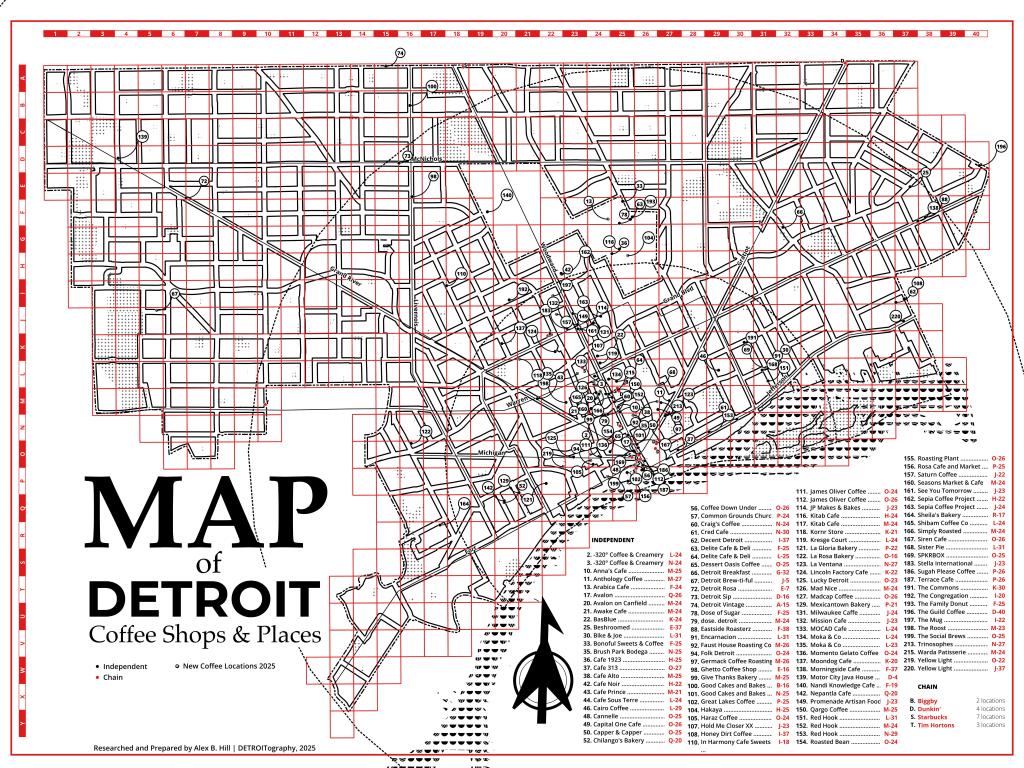
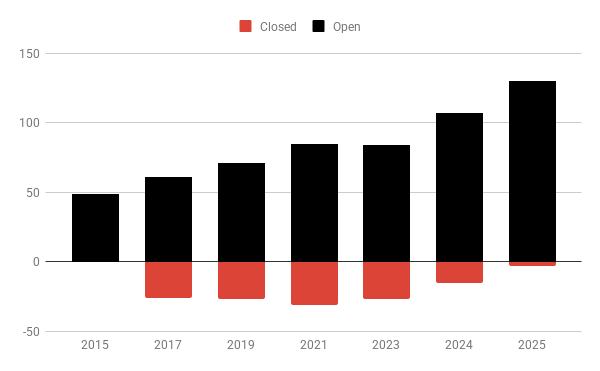
The ever constant search for coffee around the city continues.
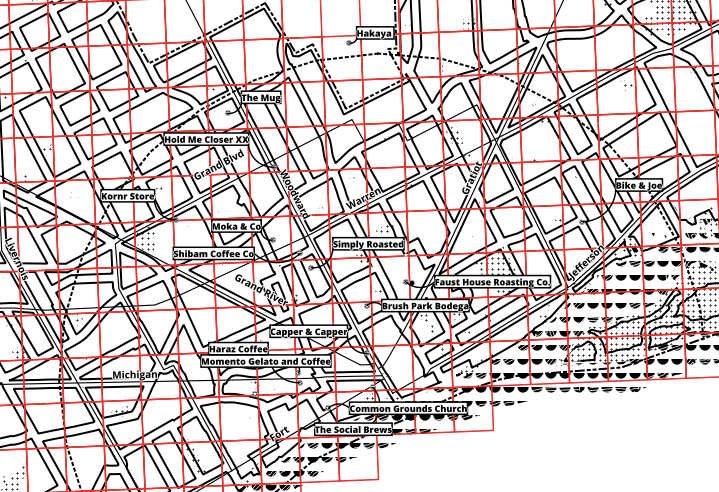
Since last year there have been 20 new coffee shops and only 3 closures since I last updated the map in 2024. This is the smallest number of closures year-over-year since 2015 which is why Detroit has the greatest number of coffee shop ever with 130 coffee spots. Almost all of the new coffee shops opened within a 3 mile radius of Downtown.
I most excited about the spot that used to be Frenchie’s across from Sister Pie that is now Bike & Joe, bike repair shop and place to grab a cup of coffee. Moka & Co. has such an exciting range of coffee options from across the Middle East that I might just have to keep trying something new. Shibam is located right inside the new Hilberry gateway on WSU’s campus. The Woodward Corridor is getting two very coffee-y named spots “Simply Roasted” and “The Mug” that seem like they might become staples of caffeine acquisition.
Do you want a physical print of this map? We’ll notify you when the pre-orders are open!
Welcome to our Data Forum where we will discuss clean energy advancements in Detroit. Join us in-person or online for lunch-and-learn filled with insightful discussions, tips, and tricks on all things related to the data.
We’ll be joined by the Tepfirah Rushdan, Director of the City of Detroit Office of Sustainability, Gary Ringer, Executive Director of Joy-Southfield CDC, and Arena Johnson, Climate Equity Program Manager at Eastside Community Network.
Don’t miss out on this opportunity to connect with fellow data enthusiasts and expand your knowledge.