Welcome to our Data Forum where we will discuss the intersection of data and artificial intelligence.
We’ll be joined by the Aaron Wilkerson, Data in the D and Carhartt, Tyler Musgrave, WSU School of Information Science, and Mike Sabbagh from Lakeshore Legal Aid.
Don’t miss out on this opportunity to connect with fellow data enthusiasts and expand your knowledge.
WHEN: Friday, March 27th, 12:30-1:30pm
WHERE: Virtual
WHAT: Join us for our Data Forum where we will discuss data and AI.
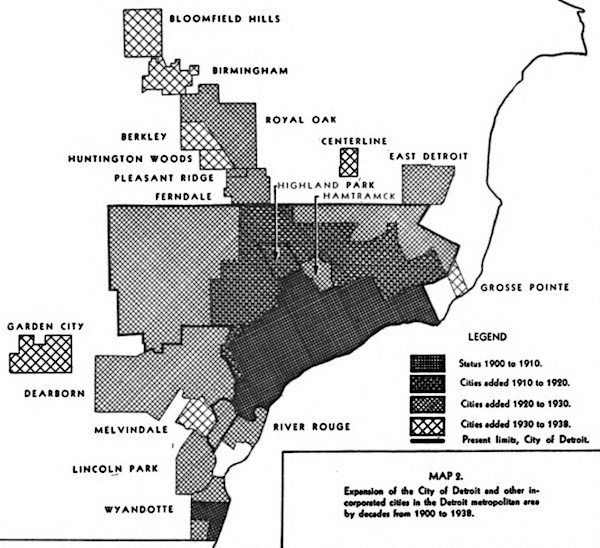
This map comes from a study titled, “A study of subdivision development in the Detroit metropolitan area” and determined that the subdivision of land outpaced population growth. The study determined that the region had an “abnormal amount of platted land” in relation to the overall population (“purely speculative”). The amount of vacant land parcels just within Detroit at the time of the study (1944) were estimated to be able to accommodate another 1 million people.
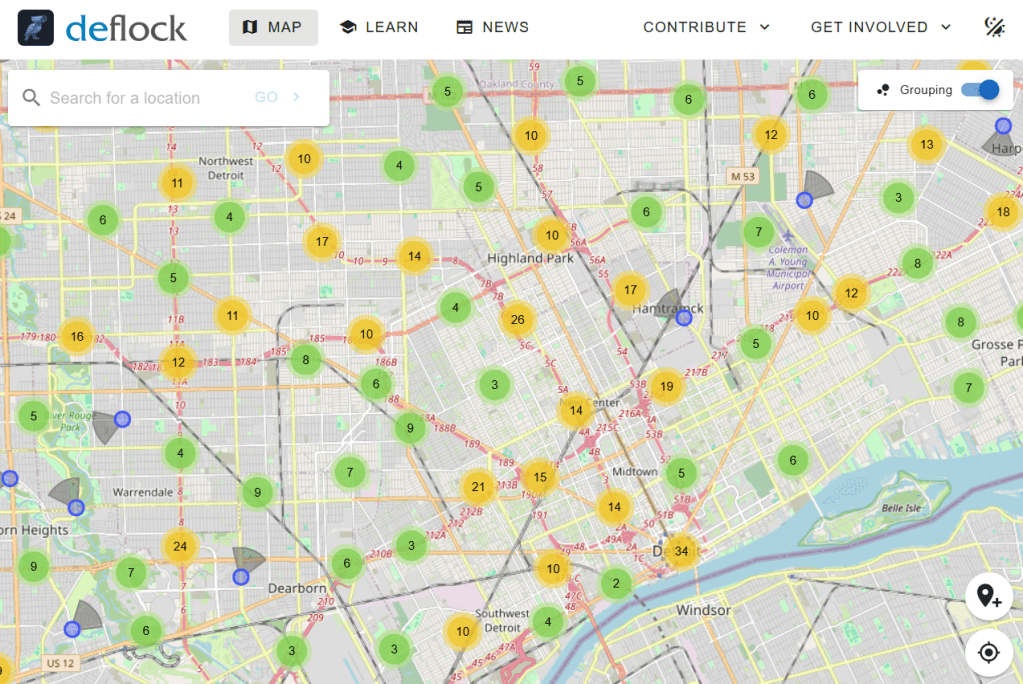
Growing concern over police surveillance technology has launched a crowdsourced site to track installations of the Flock Automated License Plate Reader (ALPR) cameras across the country. Most Flock devices in Detroit are near expressways and major intersections. There has been controversy over renewing Detroit’s contract with ShotSpotter gunshot detection technology that has not been proven to work reliably, lack of evidence that Project Green Light CCTV cameras reduce crime, and multiple instances of lawsuits from wrongful convictions supported by facial recognition.
The most successful effort that has reduced crime and murder in Detroit has been the Community Violence Intervention (CVI) program. Mayor Mary Sheffield has recently launched an Office of Neighborhood and Community Safety to anchor and expand these efforts that put community over technology as the key to repairing public safety.
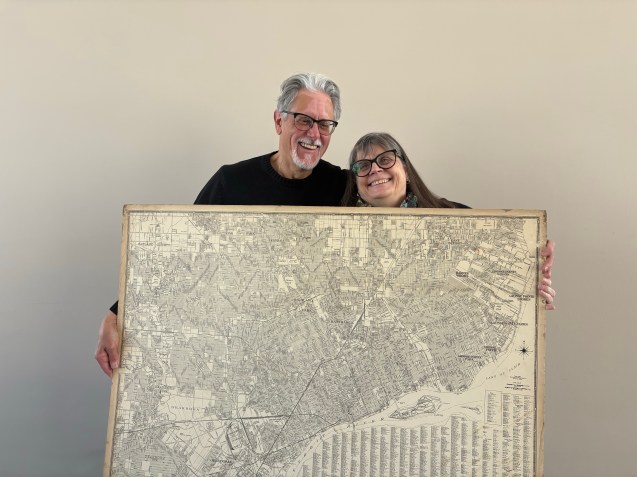
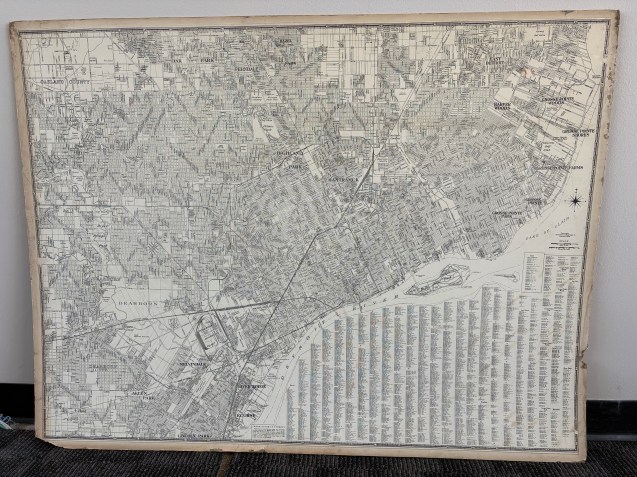
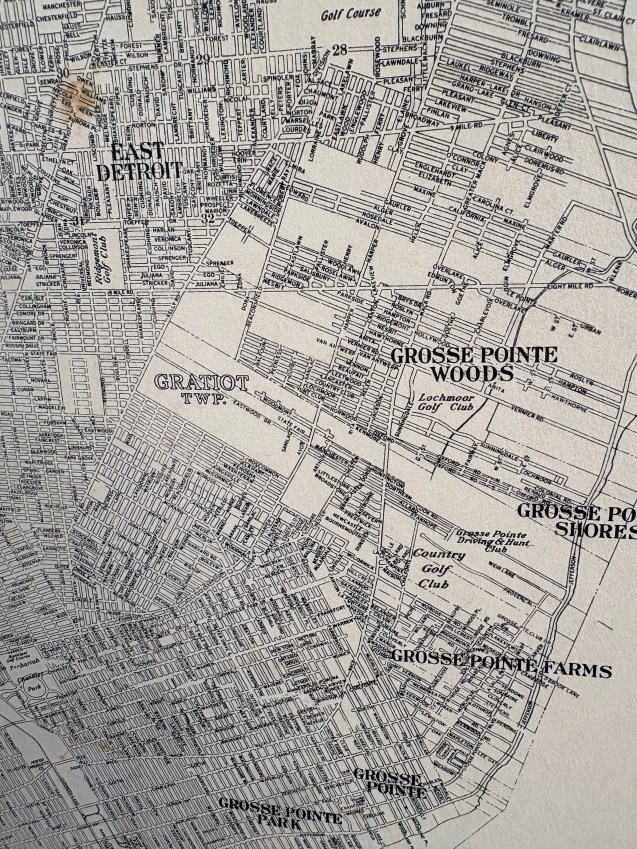
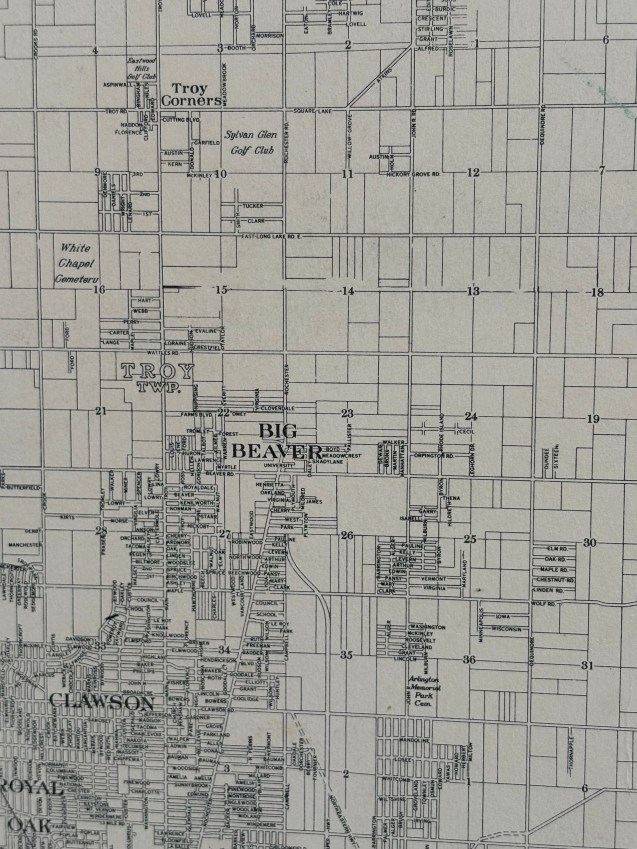
We have two maps from the National Lithograph Co. likely 1940s, but we’re not really sure. There are no expressways on the maps yet, not even the Davison Freeway (construction started 1941, opened 1942). General George S. Patton Park was officially named in 1946, but appears on this map.
Where did you find/acquire the map?
These maps were passed down through the family. Kathy’s grandfather worked for the Hygeia water filter company downtown. He had the maps hanging in his office and brought them home after retiring as Vice President of the company. The maps have since been saved in our basement with other Detroit memorabilia.
What made you hang it on your wall? What stood out to you? What details do you enjoy about the map?
Dave: The county map shows the region at pre-development before the suburban explosion after WWII. It’s fun to see city we know now look like small towns. Places the city in early time and we can imagine how it grew. Warren on this map is a tiny town, Troy doesn’t exist – its Big Beaver. Gratiot Township remains before being renamed as Harper Woods in 1951.
Kathy: See a lot of golf courses to the East and less neighborhoods. WSU is just Wayne University and simply a one block area before the campus expansion.
What in your background has drawn you to maps?
Dave: I’m fascinated by the past, archeology, and location – helps you to know where you are. My father had a grocery store in the 1930s on Forest in the mostly Polish neighborhood there and we’ve visited and explored some of those places before they were demolished.
Kathy: I got involved in Detroit history for the Tricentennial. Now I’m a tour guide for Preservation Detroit. My Grandfather grew up on Hastings. I also have one direct ancestor listed as part of Cadillac’s advance party.
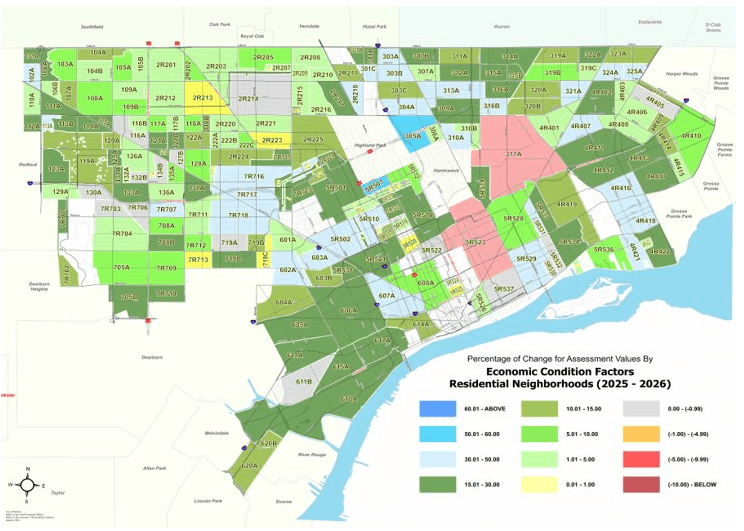
Like other property data watchers, I was surprised to see a $500M increase in property valuation for 2026. Thankfully Gratiot Labs has an analysis and write-up of how there are some serious issues with how the property data was used to update how Detroiters homes are assessed. Here are some excerpts:
“The property transactions used for this calculation, however, are based on questionable transactions that appear to involve affiliated entities by RealToken, inflating and distorting the property values of Detroit homes.”
“Normally, these would be legitimate sales that help Detroit understand the actual market value of homes for property taxes. But 70% of the qualified sales involve transactions where the buyer and seller and essentially the same entity, RealToken, and with nearly identical prices ($54,000–$56,000). These are transfers between two companies rather than typical open-market sales.”
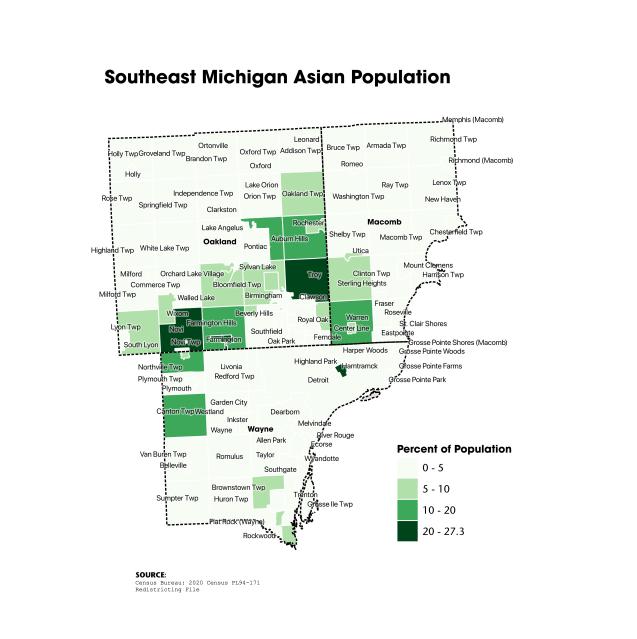
In 2020, Detroit most notable Asian community is a result of spillover from Hamtramck where a large Bengali immigrant population has taken root. Unlike many other major cities, Detroit no longer has any Asian ethnic neighborhoods. The urban renewal era saw Detroit’s original Chinatown labeled as a slum and demolished for the M-10 Lodge Freeway. The subsequent Chinatown on Cass in what was imagined as an “international village” didn’t sustain.
In the 1970s, Detroit had a large influx of Hmong refugees from Vietnam living in northeast of the city, but most have since relocated to Warren and Pontiac. The northern suburb of Madison Heights now has a greater density of Chinese restaurants and food retailers. Within the City borders there remains a sizable number of Asian residents located in Midtown likely due to academic activities with Wayne State University.
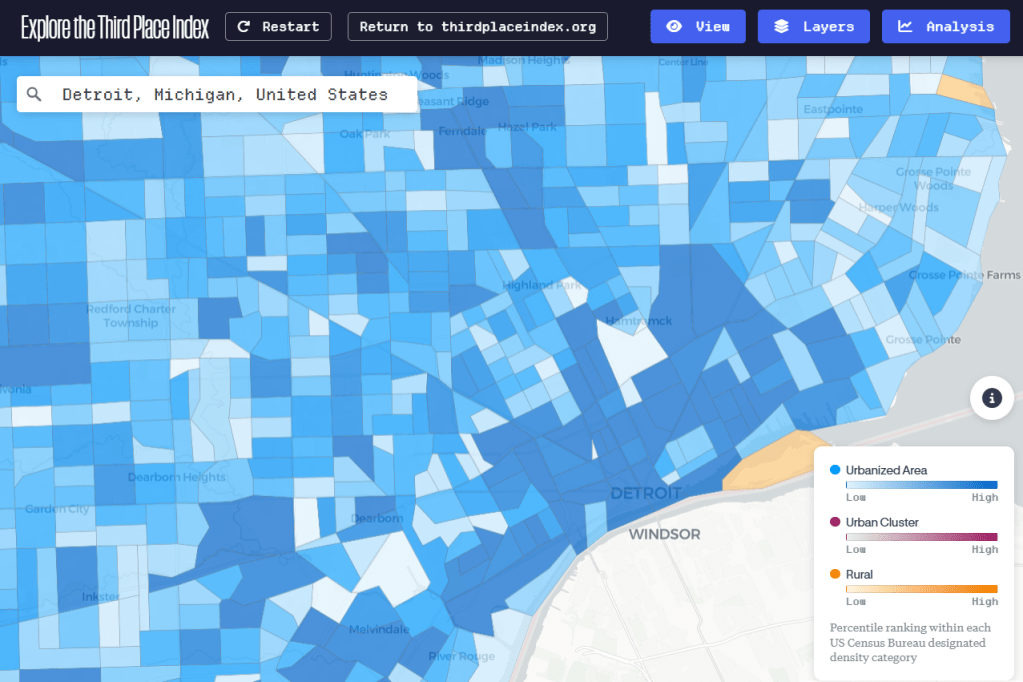
In the urban planning realm, third places or informal gathering places, are often discussed in relation to creating great places to live and reknitting the urban fabric of communities that have seen disinvestment. Evan O’Neil created this national index based on Open Street Map data to explore the density of third places.
The Third Place Index scores every U.S. census tract from 0–100 based on access to these types of spaces. This score determined by point of interest data queried from OpenStreetMap for each location type. Higher scores mean more places to connect and build community. Lower scores mean fewer options and more isolation.
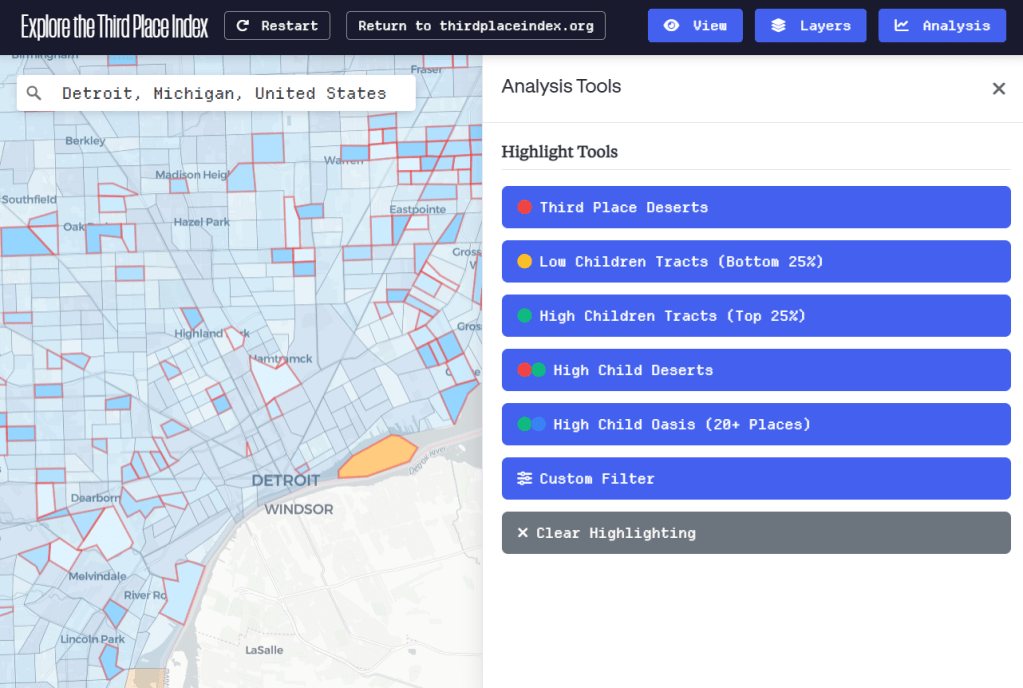
An interesting addition to just looking at density is an analysis feature to focus on “third place deserts” and the density of children across cities. In Detroit, third places are most dense in areas with low child populations and third place deserts appear dispersed all across the city. Looks like we need a lot more third places in Belle Isle!
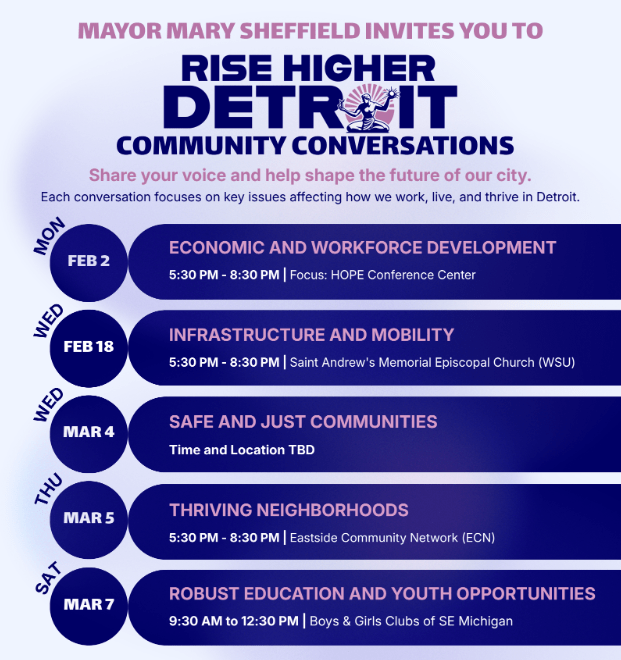
Rise Higher Detroit is Mayor Sheffield’s citywide effort to listen to residents and shape City decisions around what people are actually experiencing in their daily lives. Through Community Conversations across Detroit, residents come together in guided, small-group discussions focused on the issues that most affect how people work, live, and get ahead.
See more event info below and be sure to reserve your spot: 🗓️Thursday, March 5th 🕜5:30 p.m. to 8:30 p.m. 📍 4401 Conner St., Eastside Community Network
Welcome to our Data Forum where we will discuss the nonmotorized transportation system, how data is tracked, and how data can be used to improve connectivity and accessibility.
We’ll be joined by the Todd Scott, Detroit Greenways Coalition, Christina Debose of Socially Chrissy (“Detroit’s bold biking mom”), and Christina Peltier from the City of Detroit Complete Streets.
Don’t miss out on this opportunity to connect with fellow data enthusiasts and expand your knowledge.
WHEN: Friday, February 27th, 12:30-1:30pm
WHERE: Virtual
WHAT: Join us for our Data Forum where we will discuss nonmotorized transportation.
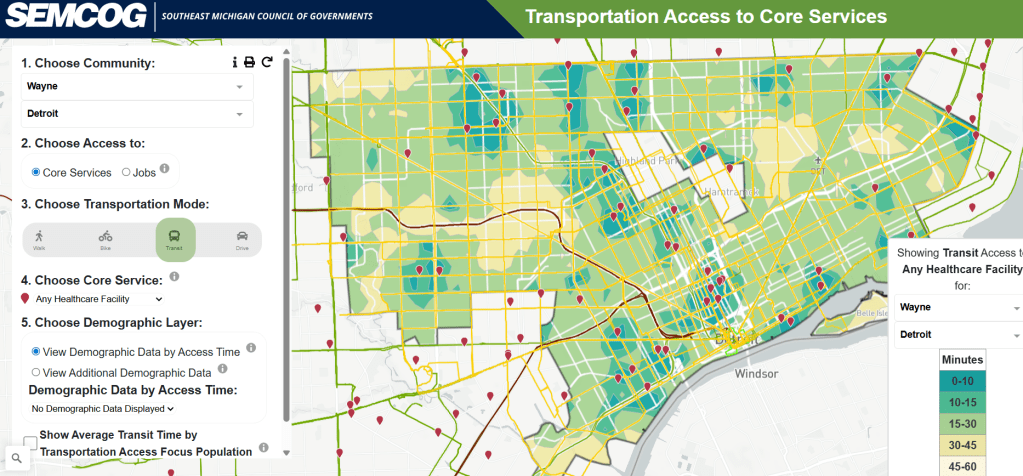
SEMCOG has released their updated analysis of transportation access to core services. The first study came out in 2015, so this is a timely update. I specifically shared the map of transit access to “any healthcare facility” because I think it accentuates the difficulties we have with both healthcare access and transit connectivity.
By examining accessibility as both a transportation and land-use outcome, the study illustrates how development patterns and transportation investments work together to connect people to opportunity. The findings can inform long-range planning, project prioritization, and policy development at the local and regional levels. The aim is to ensure Southeast Michigan’s transportation system supports and serves the diversity of residents and communities throughout the region, identifying where gaps in access exist and ways to improve and close these gaps.
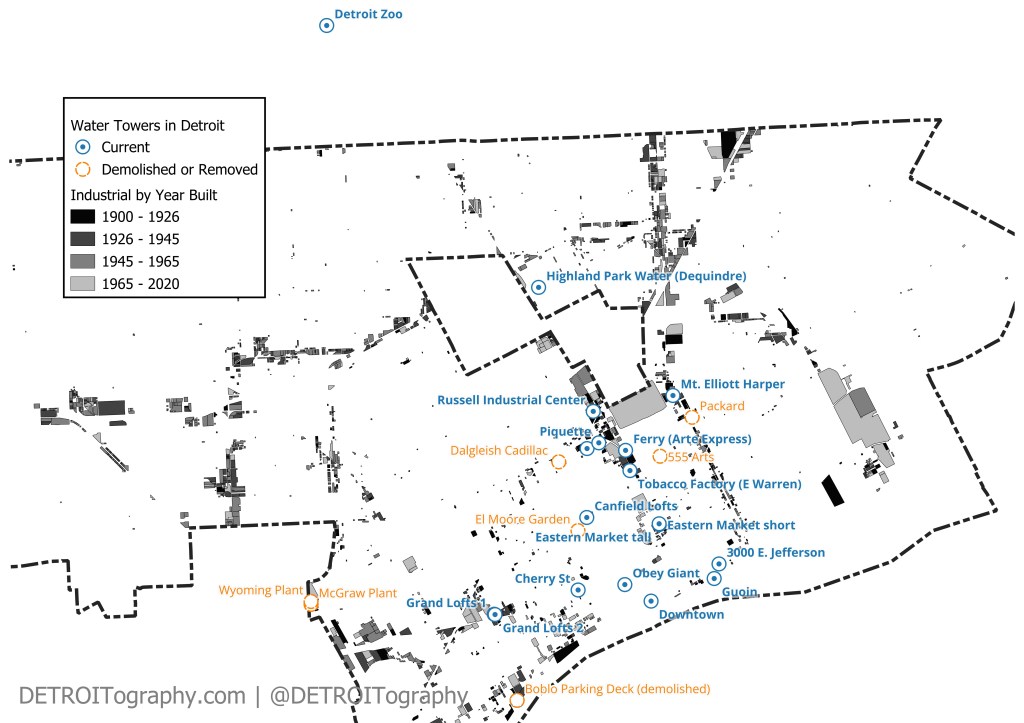
Someone asked if I had ever mapped out the remaining water towers in Detroit and now I have.
Historically, water towers were built to provide fire protection. Buildings were constructed close together making it easier for fire to spread across several buildings at once. For Detroit’s industrial sector that meant even higher risk of fire at a time when fire departments and services were rudimentary and often volunteer based. The infamous fire of 1805 was contained by a bucket brigade. Detroit hired its first paid fire crew in 1860. By 1900, Detroit had 476 paid firefighters and in 1922 fully transitioned from horses to motorized fire engines manufactured by Packard Motor Company.
In many cities, water towers were often the tallest structure because they were built on the rooftops of buildings. As a result water towers became directional markers and community symbols. Numerous changes, including deindustrialization and demolitions have removed many water towers from Detroit’s skyline. Notably the water tower on the Packard Plant was demolished, the Boblo Boat parking deck water tower, and other were repurposed. When Wayne State University began renovating the Dalgleish Cadillac dealership, the old water tower was saved and repurposed at the El Moore Lodge as an entryway to their garden.
The existing and demolished water towers in Detroit follow the historic industrial location pattern before the 1930s. Usually the first water tower people think of is the Detroit Zoo water tower with the great animal mural. To put this dataset together I started with the most photographed water towers in the city. There is a pair of water towers in Eastern Market along the Dequindre Cut that get photographed often and the water tower at the Packard Plant had been a favorite because it was so tall until it met the wrecking ball. An odd shaped water tower on Guoin Street (Rivertown) regularly makes it into images that place it in front of Downtown and there is a historic water tower right Downtown across from the Renaissance Center that makes for an epic image when juxtaposed with the rest of Downtown. Other notable water towers are the Highland Park water treatment plant tower, the water tower on top of the apartments at Cherry Street and Brooklyn in Corktown, and the water tower on top of the H&M store that Shepherd Fairey used for an Obey Giant installation when he came to make murals for Dan Gilbert.
Make it count! Detroit By The Numbers latest monthly segment on the Authentically Detroit podcast is live! We highlight significant data and numbers from the past month for Detroiters!
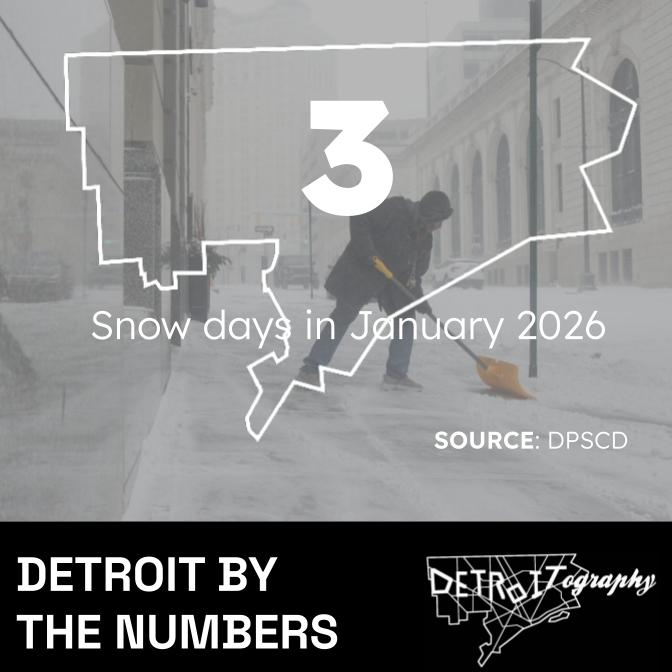
District-wide school closures for snow or cold weather this month, but snowfall totals are well below most years. (DPSCD)
1,827
Households signed up for 5,000 spots in the Lifeline H2O water assistance program. Households are not eligible if they have water bill debt. At its peak in the “Lifeline Plan” served 29,000 households. (Outlier Media/DWSD)
50%
Percent of Detroit Seniors (aged 65+) spend 30% or more of income on housing costs (The Conversation)
6%
Census estimates show Detroit’s population at around 637,000 with a high citizenship rate (96.7 %) and a relatively small foreign-born share (5.9 %) — but below the average of 13% for other large cities. (Census)
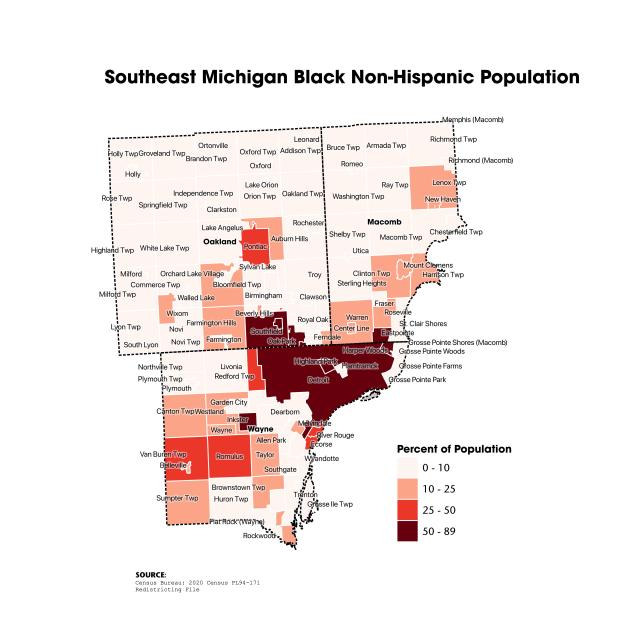
Present maps of race and ethnicity show historical migration patterns. The City of Detroit has the highest percentage of Black Non-Hispanic people of all municipalities in Michigan and is only surpassed by Jackson, Mississippi for highest percentage of Black population in the country. If you know some of Detroit’s history you can trace the migration of Detroit’s Black middle class into Southfield and more recent migrations into inner ring suburbs like Harper Woods, Eastpointe, and Oak Park. In recent years, Detroit’s Black population has been the largest source of population loss as families look for safer neighborhoods and better schools. Today’s Black middle class in the Detroit region reside in places like Lathrup Village, Farmington Hills, and Bloomfield Township.
The Detroit region has faced an on-going loss of population. Recent data and news has highlighted that the City of Detroit is slightly up in population (mostly around Greater Downtown) for the last few years, but the overall rate of population growth is still below the 2010 population total.
A number of inner ring and proximity municipalities also saw population loss since 2010, such as Ferndale, Livonia, Garden City, St. Clair Shores, and a number of Downriver cities.
We are closer to the 2030 Census than the 2020 Census now. Fingers crossed for more growth and opportunity in the next four years.
Join Outlier Media on Feb. 4 for a geography-inspired trivia night celebrating Detroit’s neighborhoods, history and culture. Created in collaboration with Alex B. Hill (DETROITography) and co-hosted by Outlier’s civic life reporter Briana Rice, this night blends maps, storytelling and local knowledge — plus FREE prizes.
💛 Outlier Collective perk: Members get their first drink on us. (Not a member? Donate $1+ before the event to join!)
Bring your friends, test your Detroit knowledge, and learn something new.
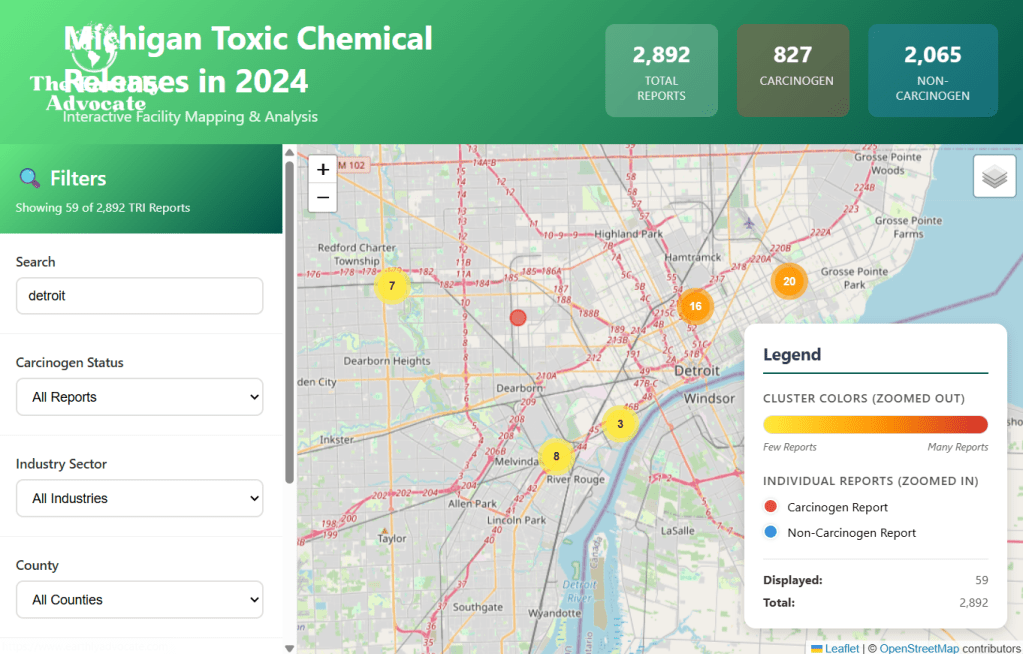
This map by The Earthly Advocate, Daja Elum, displays data from the Toxic Release Inventory (TRI) Program at the EPA, which has been under attack in recent years so I’m hoping the data is still reliable and maintained. The majority of toxic releases in Detroit came from the EQ Detroit (better known as US Ecology) facility near the former incinerator location and from the Stellantis Plant on the city’s Eastside.
This year, we invite artists, technologists, and researchers to submit proposals for the 2026 open call, focusing on the theme of “Networks and Connections.”
We seek innovative data-driven art that explores the intricate relationships, dependencies, and flows within Detroit’s complex systems, whether natural, social, or infrastructural.
Submissions should utilize publicly available Detroit Open Data or artist-generated datasets to visualize the city as a dynamic web of interconnected elements. This includes, but is not limited to, ecological systems like the Detroit River watershed and urban green spaces, social networks and community connections, or the infrastructure networks that support urban life and economy.
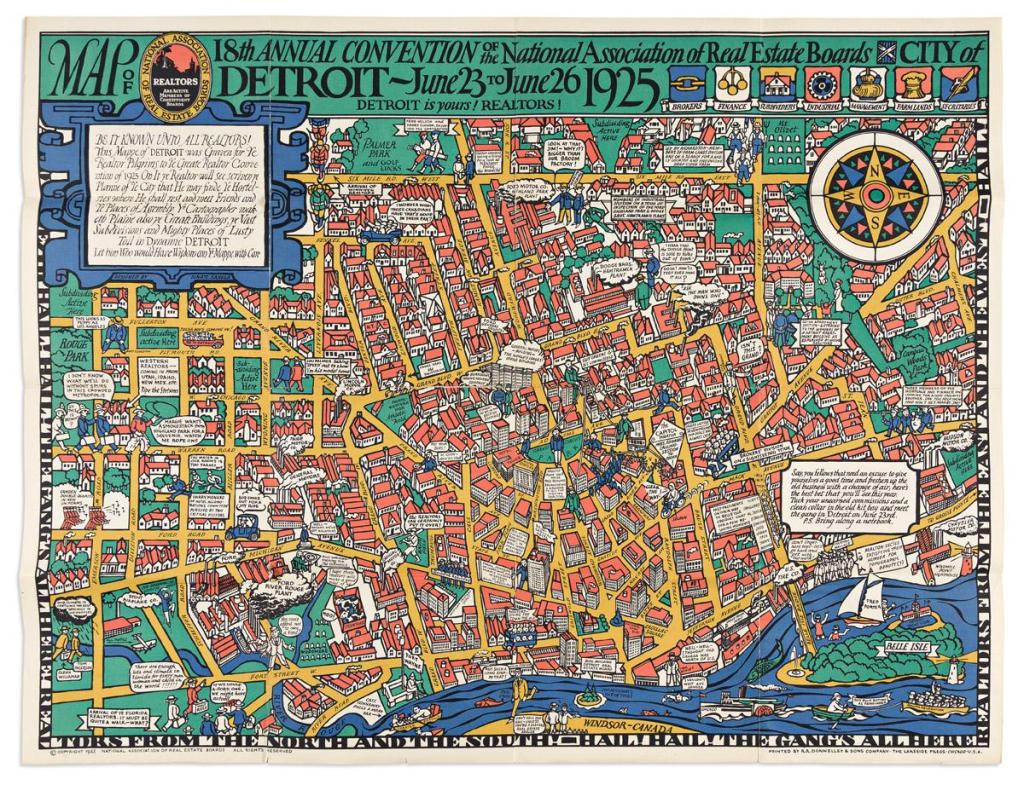
In 1925, the National Association of Real Estate Boards declared: “Detroit is yours! Realtors!”
On this map, the pictorial map people are saying a myriad of gems about the city and I wish I could transcribe them all:
“This looks as peppy as Los Angeles.”
“Well well I thought Old Canada was North of the U.S.”
“Look at that Jim! Why it’s bigger than our broom factory!” [looking at Ford Motors in Highland Park]
One interesting note added to many green “undeveloped” areas labeled as “Subdividing active here” since much of the city beyond Grand Boulevard was still vacant.
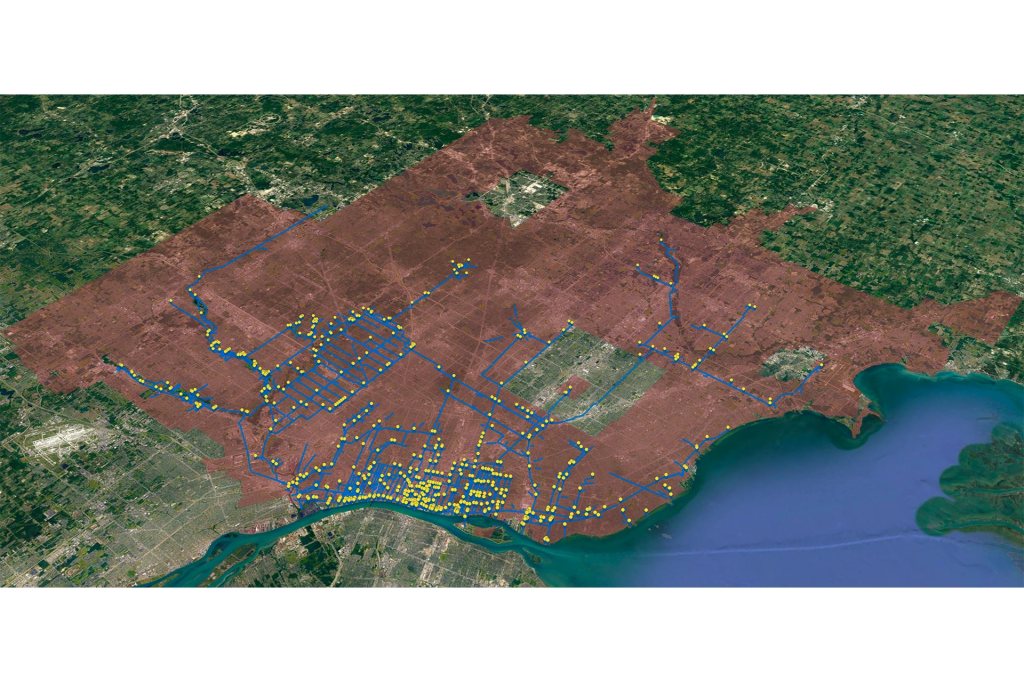
The University of Michigan Urban Collaboratory worked with the Great Lakes Water Authority (GLWA) in 2018 to better handle combined sewer overflows in real-time. More from the project:
… they found that Combined Sewer Overflows have been occurring when additional sewer capacity is available. Rather than increasing the amount of storage with costly infrastructure improvements, the research team was able to demonstrate their ability to use a real-time control approach to significantly improve the existing GLWA wastewater and CSO management system by reducing both the occurrence of CSOs and peak flows going to the treatment facility.
Welcome to our Data Forum where we will discuss the education system, how data is tracked, and how data can be used to improve student outcomes.
We’ll be joined by the Jeremy Singer, GO DATA Commissioner, Stacey Brockman of WSU’s Education Leadership and Policy studies program, and Titus Scott from the Skillman Foundation.
Don’t miss out on this opportunity to connect with fellow data enthusiasts and expand your knowledge.
WHEN: Friday, December 19th, 12:30-1:30pm
WHERE: Virtual
WHAT: Join us for our Data Forum where we will discuss education data and uses.
Make it count! Detroit By The Numbers latest monthly segment on the Authentically Detroit podcast is live! We highlight significant data and numbers from the past month for Detroiters!
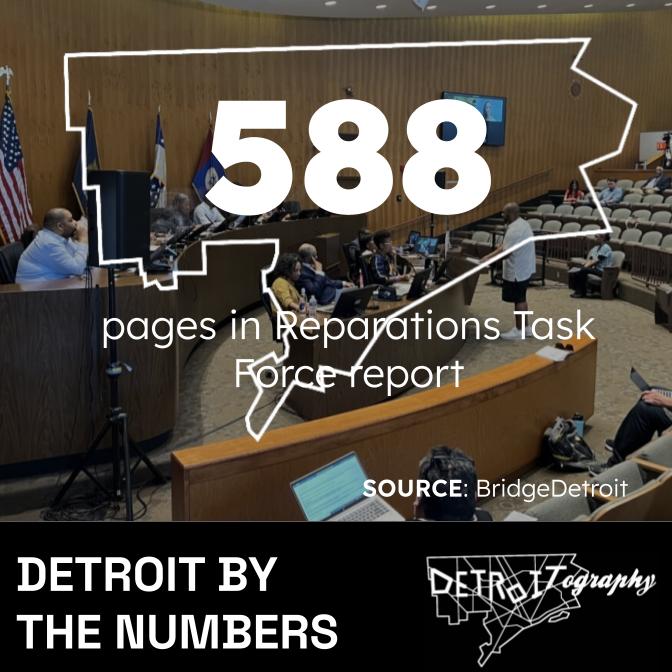
Number of pages in the recent Detroit Reparations Task Force Report (BridgeDetroit).
36.6%
Percent of Detroit households that rely on SNAP/Food Stamps to put food on the table. Among households with children the rate is 25.9%. (U.S. Census)
$63M
Amount invested in home repair interventions in 2024. Most of the funding came from ARPA (43.5%) and were utilized for roof repairs. In all 3,058 home repair interventions were conducted at 2,628 addresses. (Detroit Home Repair Census)
11,021
Research-grade observations within the city of Detroit on iNaturalist, a social network for tracking biodiversity indicators like animal sightings, plants, and other observations from nature. (GBIF)
Contact
Submit a map or just get in touch. Thanks for following!






 DETROITography