Welcome to our Data Forum where we will discuss the arts and creative institutions in the city and their connections. Join us online for lunch-and-learn filled with insightful discussions, tips, and tricks on all things related to the data.
We’ll be joined by the Kevin Gilboe from DesignCore, Steve Panton of Essay’d, and Nafeesah Symonette from Detroit Excellence in Youth Arts (DEYA).
Don’t miss out on this opportunity to connect with fellow data enthusiasts and expand your knowledge.
WHEN: Friday, August 15th, 12:30-1:30pm
WHERE: Virtual
WHAT: Join us for our Data Forum where we will discuss arts and the creative ecosystem in Detroit.
I’m so excited that Detroit By The Numbers will be a new monthly segment on the Authentically Detroit podcast! We’ll highlight significant data and numbers from the past month for Detroiters!
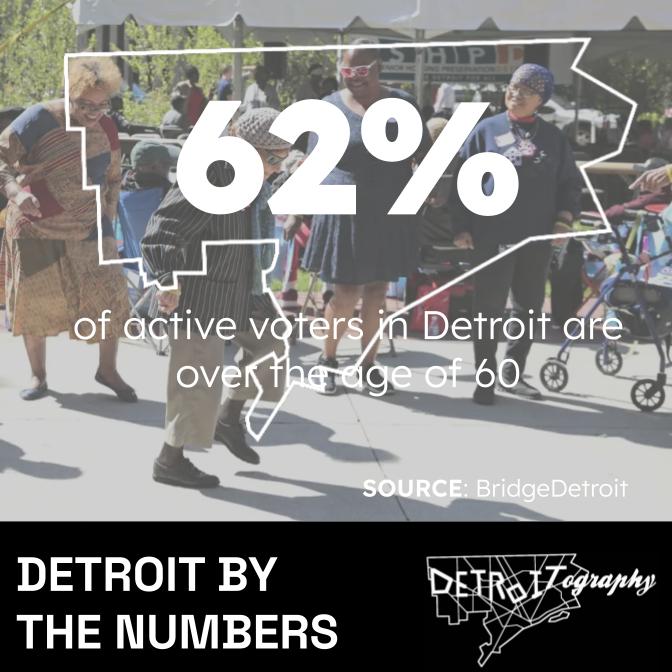
percent of active voters are aged 60 or over (BridgeDetroit). If you need to check your voting options and polling place visit VoteDetroit.org
163.5
acres of land that will be devoted to Detroit’s solar neighborhoods. The largest solar array to date was 10 acres at O’Shea Field. The new “solar neighborhoods” will take up space as large as Downtown Detroit. Check out our impact assessment on heat effects, tree canopy, and impervious surface (DETROITography). Bonus: check out our recent Data Forum on Clean Energy (Youtube)
40
city buses went out of service in the last 2 weeks. DDOT has cleared the hurdles of low numbers of bus drivers and bus mechanics, but many buses on the fleet are still aging out. The loss of the 40 buses has caused significant service disruption. (Transit Riders United)
26%
the low estimate of homeowners without home insurance in Detroit. The higher estimate is 41% of Detroit homeowners without home insurance. 18 of the 25 ZIP codes with the highest home insurance premiums are located in Detroit. Crime rates, credit scores, and the age of homes factors into the high premiums, but others have likened it to modern-day redlining. (Outlier Media/DetroitData)
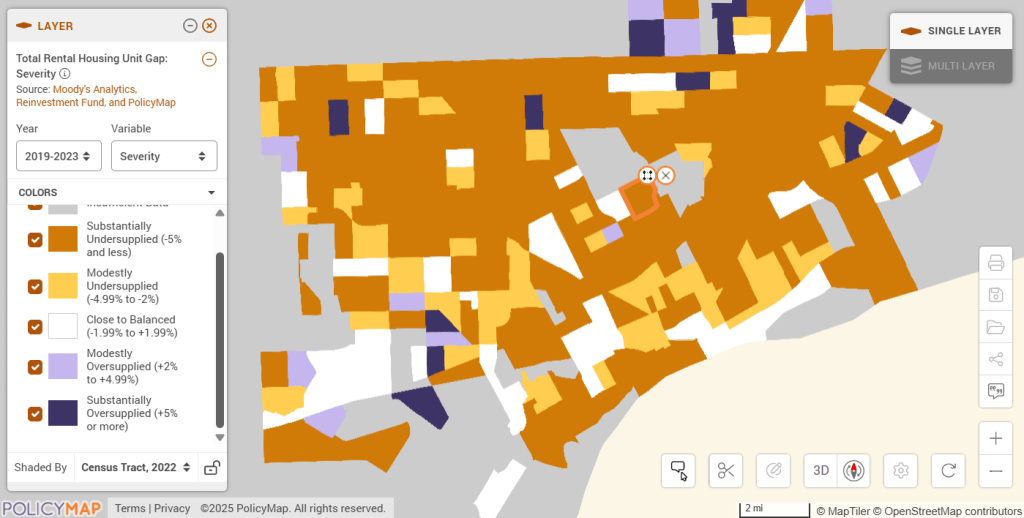
Moody’s may have increase Detroit’s credit rating over the years, but Moody’s Analytics still recognizes the difficulties and gaps in serving Detroiters. Rental housing in Detroit in particular is an on-going discussion with efforts to finance “affordable housing,” renovate formerly vacant homes, and improve quality of property management while at the same time reducing requirements on landlords.
The rental housing gap as defined by Moody’s is:
The total number of renter housing units below or above expectation is the difference between the current number of renter vacant units in a census tract and the expected number of renter vacant units in a “normal” market.
Citywide, nearly all Census Tracts are considered to be a “substantially undersupplied.” Big data caveat here is what Moody’s considers to be a “normal market” because Detroit has the furthest thing from a normal housing market and I couldn’t even predict when that might start to change. Still today, there exists the possibility of purchasing a home for $1,000 as well as a Downtown condo for over $1 million. The abnormal housing market data also needs to be paired with the fact that most Detroit households are housing burdened, where they are spending 30% of their income on their housing needs.
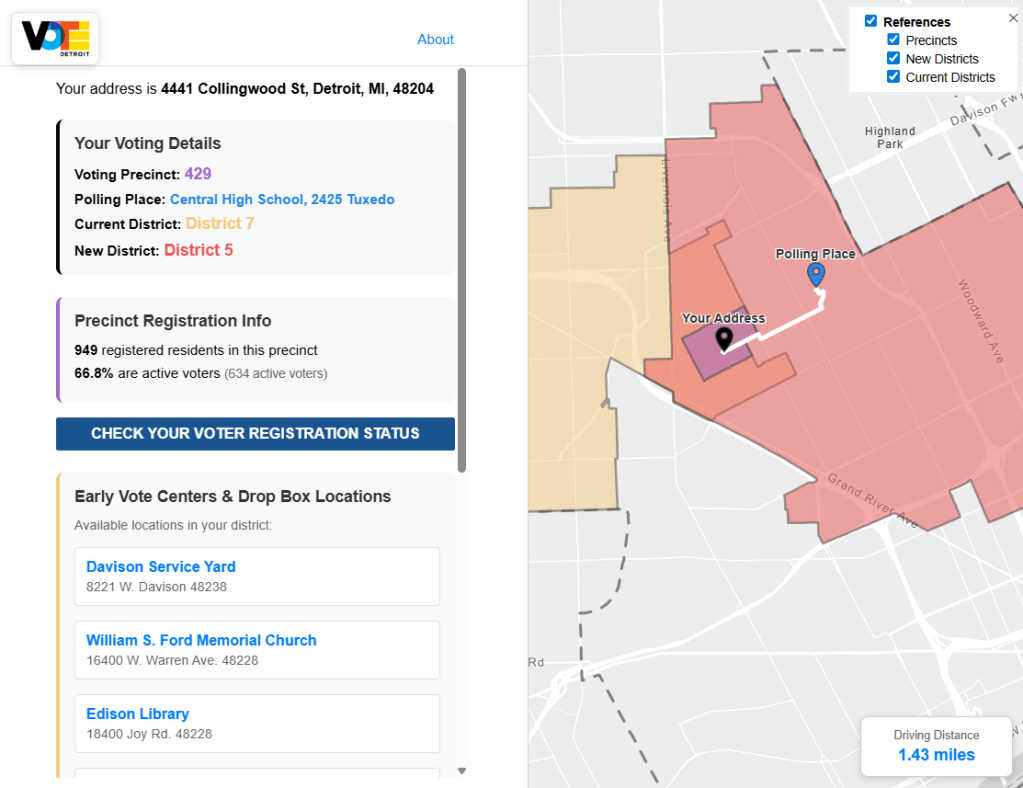
Web application developed by Marie Yu and Aditya Tambe for DETROITography
Knowing where to vote and how to get there should be the easy parts of voting. Democracy depends on engagement and Detroit has relatively low levels overall from the loss of city services, emergency management, and general apathy towards local government. We’ve built a tool that helps anyone work through their voting options based on their address: VoteDetroit.org
“Detroit’s future demands a functional and dependable government. Change – real change – can only happen when we start making the connection between voting and quality of life. Only through rigorous, informed participation will we say our city – our democracy – matters. The time is now. Every city resident needs to be here, be informed and be heard.”
The Department of Elections should be building these tools and making voting information publicly available. Thanks to Malachi Barrett for FOIAing the 2025 Primary Polling Places and many internal city government employees or vetting and verifying data that should be reliable open data.
The VoteDetroit.org tool allows you to check if you have been redistricted into a new City Council District as well as check your assigned polling place based on your voting precinct. Early in-person voting is available at the Department of Elections starting June 26th until August 4th and at Early Voting Centers across the city on July 26th until August 3rd.
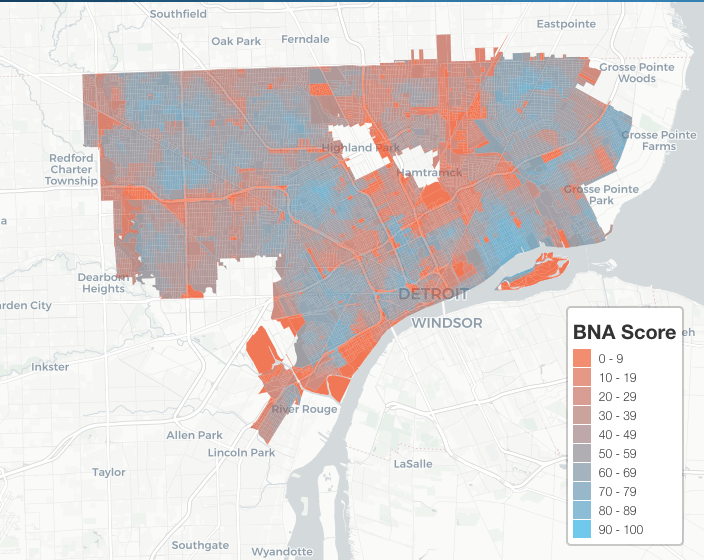
The 2025 City Ratings are out from People for Bikes. In the past, Detroit has not scored very well but some methodological changes have helped give a clearer picture of where Detroit stands among other global, United States, and Midwest regional cities. One area that dings Detroit is the presence of bike lanes with parking, which is true for almost all bike lanes in the city. The difference is that Detroit has the bike lane along the curb and car parking next to the roadway – more ideal for people on bikes.
The bike network in Detroit has some clear wins with well connected neighborhoods, but what appears to be more islands of bikeability rather than a connected city until the Joe Louis Greenway is completed near the end of 2030. I think most of my friends on bikes often are coming from Hamtramck which has almost no “bike network” connecting to Detroit.
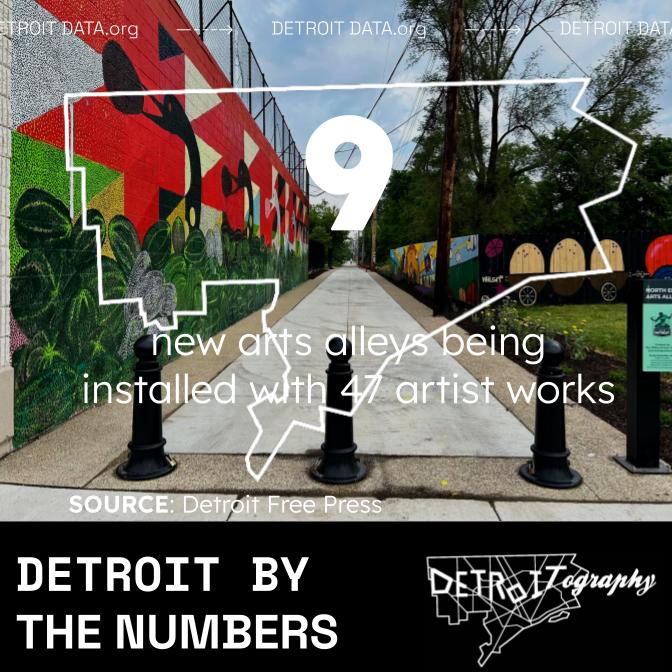
city-sponsored Arts Alleys over the next month and has commissioned 47 artists to install art in the alleys (City of Detroit)
31
updated polling places for the 2025 Detroit Primary on August 5th. Check your polling place and precinct at: VoteDetroit.org (DETROITography)
2,519
families displaced in Detroit’s Black Bottom area with 92% being families of color. The total number of people is unknown, but Rod Arroyo, planning professional consulting for the MDOT I-375 project estimates 36,000 people. (Renewing Inequity, BridgeDetroit)
$50,000
City of Detroit awarded funds from Bloomberg Philanthropies to better merge property data into one common database and will compete for $1M global prize (Detroit Free Press)
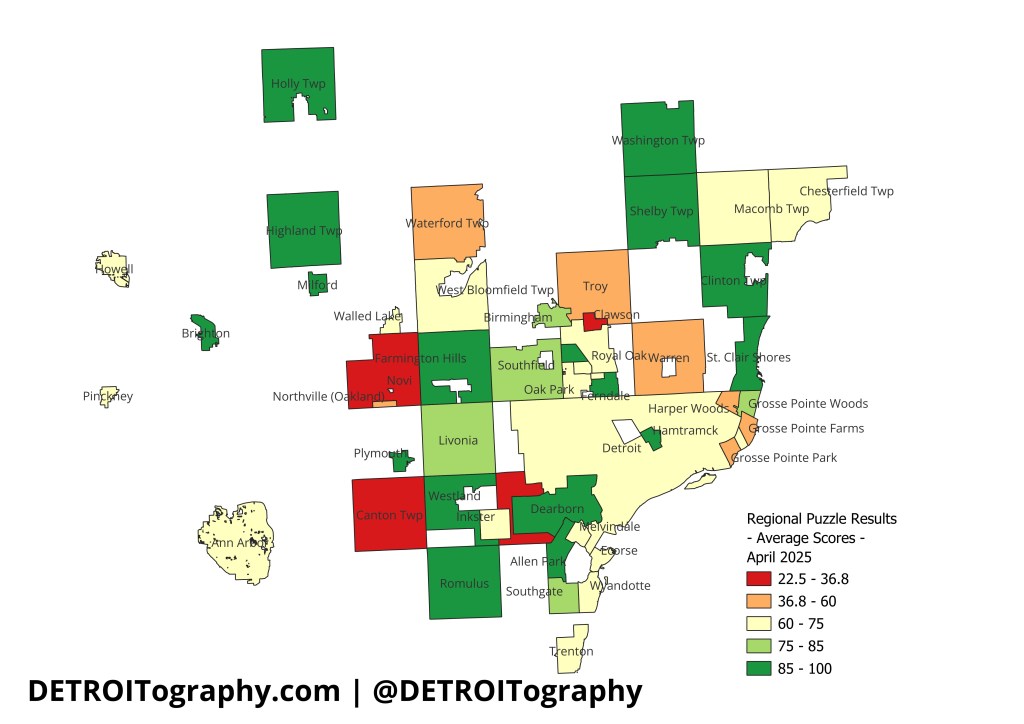
Since launching the map puzzle in September 2024, we’ve had almost 400 puzzle submissions from cities and municipalities across the 7-county region. The puzzle asks users to place all the municipalities correctly that border the City of Detroit. The average results are presented here with the caveat that small numbers of people have submitted from certain areas.
What stands out is that Detroit scores poorly in correctly identifying its own neighbors. The Grosse Pointes score even worse than Detroit, while western Wayne County areas really know their region well. Hamtramck does very well, but maybe that’s because everything is a border to residents there?
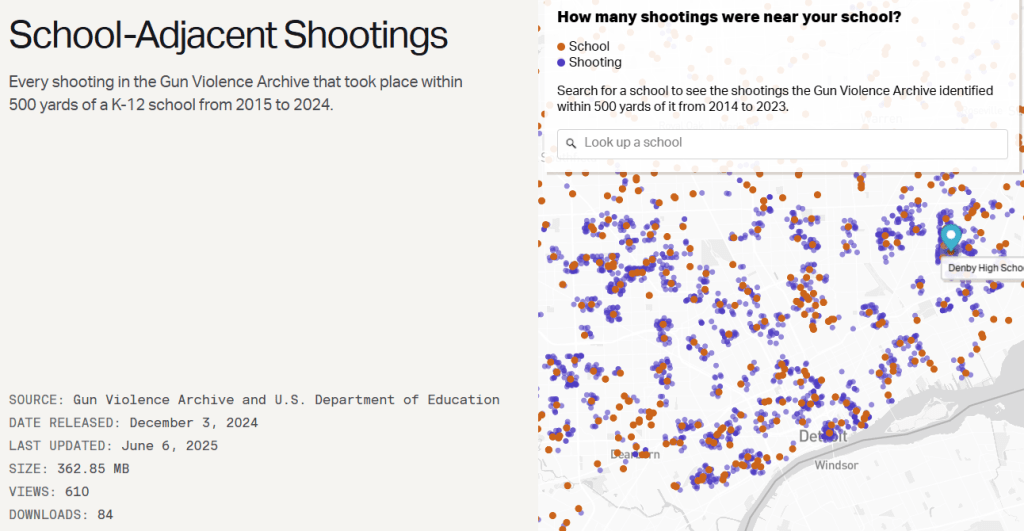
Gun violence affects so many young people in Detroit and the trauma of experiencing violence and losing someone to violence has lasting effects. I had this exact analysis in my head for a number of years, but glad to see team at The Trace tackling it across the country. On the map you can search for a school name and see how many shootings happen within 500 yards.
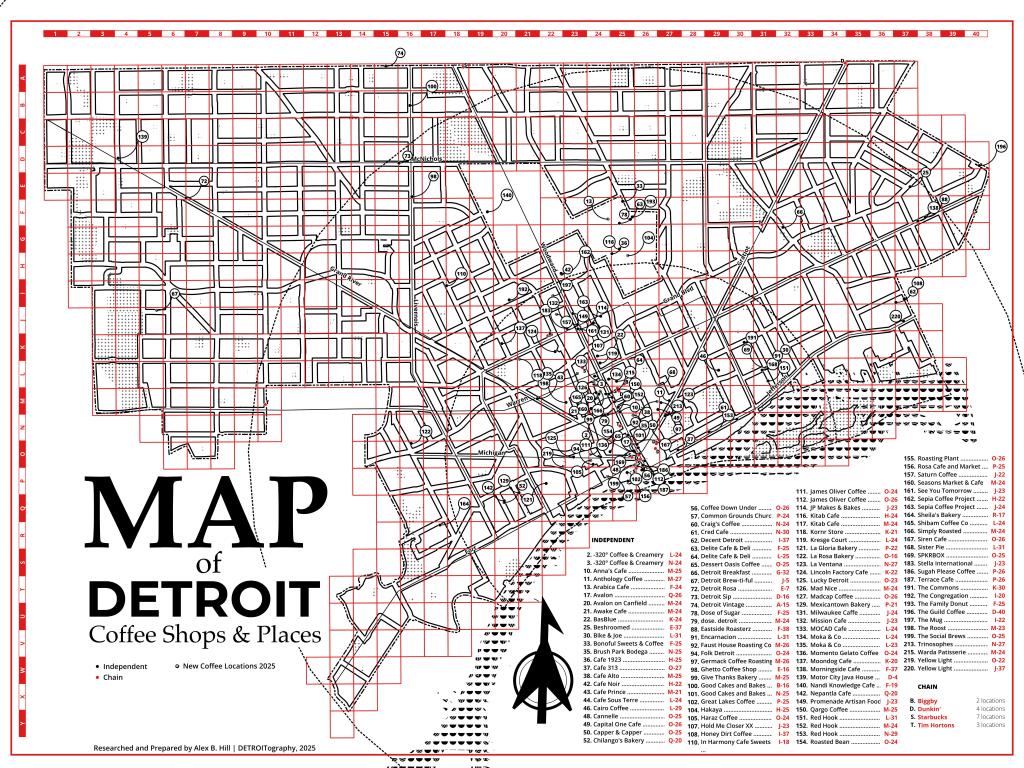
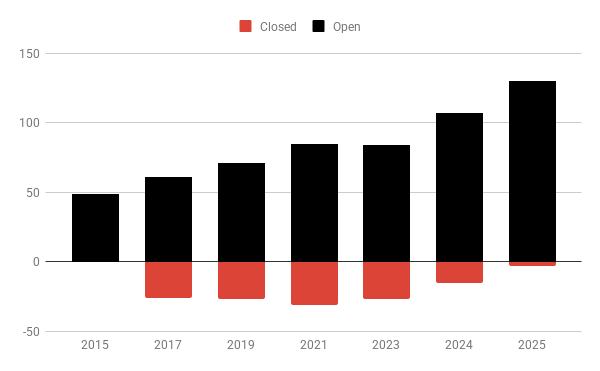
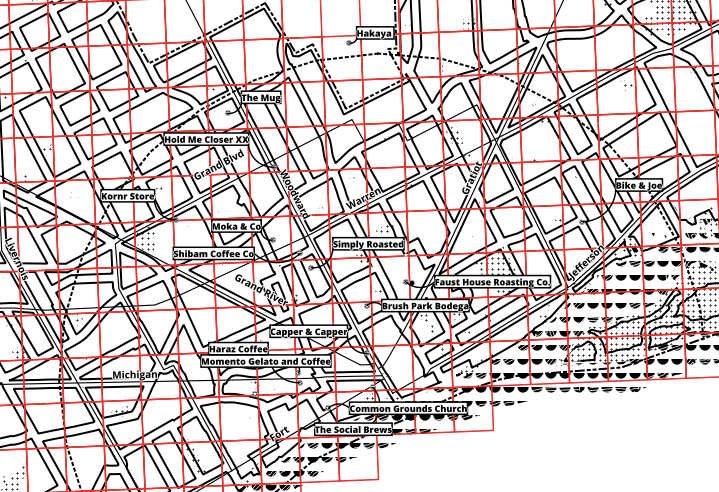
The ever constant search for coffee around the city continues.
Since last year there have been 20 new coffee shops and only 3 closures since I last updated the map in 2024. This is the smallest number of closures year-over-year since 2015 which is why Detroit has the greatest number of coffee shop ever with 130 coffee spots. Almost all of the new coffee shops opened within a 3 mile radius of Downtown.
I most excited about the spot that used to be Frenchie’s across from Sister Pie that is now Bike & Joe, bike repair shop and place to grab a cup of coffee. Moka & Co. has such an exciting range of coffee options from across the Middle East that I might just have to keep trying something new. Shibam is located right inside the new Hilberry gateway on WSU’s campus. The Woodward Corridor is getting two very coffee-y named spots “Simply Roasted” and “The Mug” that seem like they might become staples of caffeine acquisition.
Do you want a physical print of this map? We’ll notify you when the pre-orders are open!
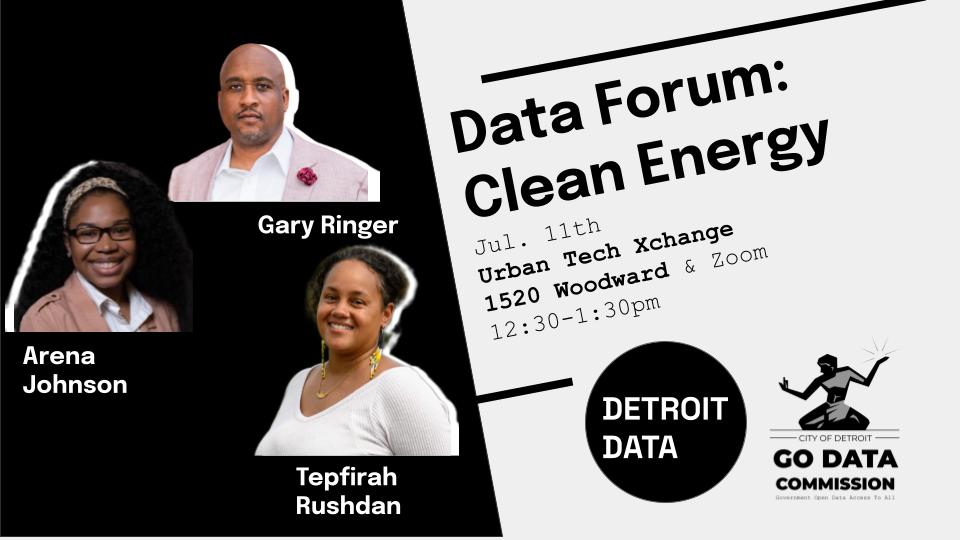
Welcome to our Data Forum where we will discuss clean energy advancements in Detroit. Join us in-person or online for lunch-and-learn filled with insightful discussions, tips, and tricks on all things related to the data.
We’ll be joined by the Tepfirah Rushdan, Director of the City of Detroit Office of Sustainability, Gary Ringer, Executive Director of Joy-Southfield CDC, and Arena Johnson, Climate Equity Program Manager at Eastside Community Network.
Don’t miss out on this opportunity to connect with fellow data enthusiasts and expand your knowledge.
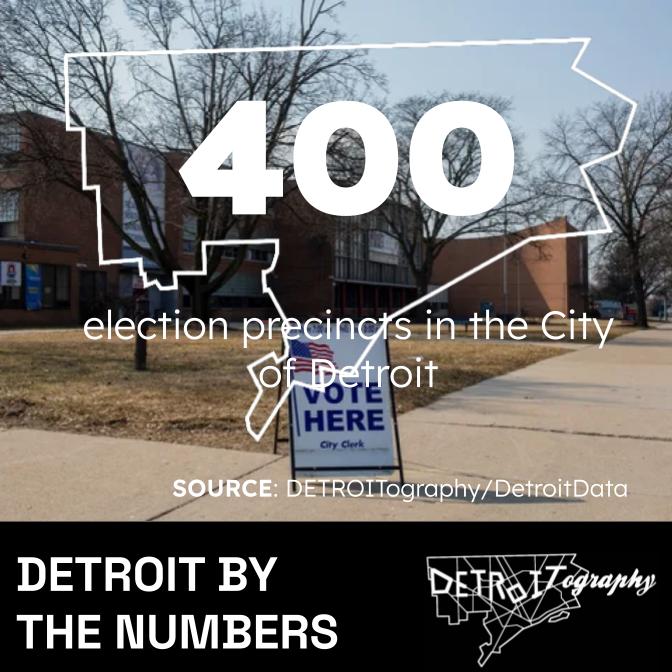
election precincts (cleaned up version) down from 502 precincts in the 2020 election and 450 in the 2022 election with 401 polling places, yet some people travel more than 3 miles past 6-7 polling places to reach their assigned polling place (DETROITography)
Welcome to our Data Forum where we will discuss City, County, and Hospital health assessments in Detroit. Join us online for lunch-and-learn filled with insightful discussions, tips, and tricks on all things related to the data.
We’ll be joined by the Tiffani Stewart and the Detroit Health Department team releasing their latest Community Health Assessment (CHA), Katerina Stylianou sharing the most recent Wayne County health assessment results, and Ally Rooker from Henry Ford Health to share how hospitals engage in Community Health Needs Assessments (CHNA).
Don’t miss out on this opportunity to connect with fellow data enthusiasts and expand your knowledge.
WHEN: Friday, June 13th, 12:30-1:30pm
WHERE: Virtual
WHAT: Join us for our Data Forum where we will discuss City, County, and Hospital health assessments in Detroit.
Voting in Detroit is not known to be easy and the numbers of voters reflect that difficulty. Election Day confusion is well-known and documented even amongst regular voters. Polling places have changed and in some cases changed again. In 2020, the City Clerk noted that some 40,000 Detroiters were subject to a polling place update two weeks prior to the election. A result of the 2024 statewide redistricting led to some 300,000 Detroiters facing new polling places along with their new represented districts in the State House and State Senate.
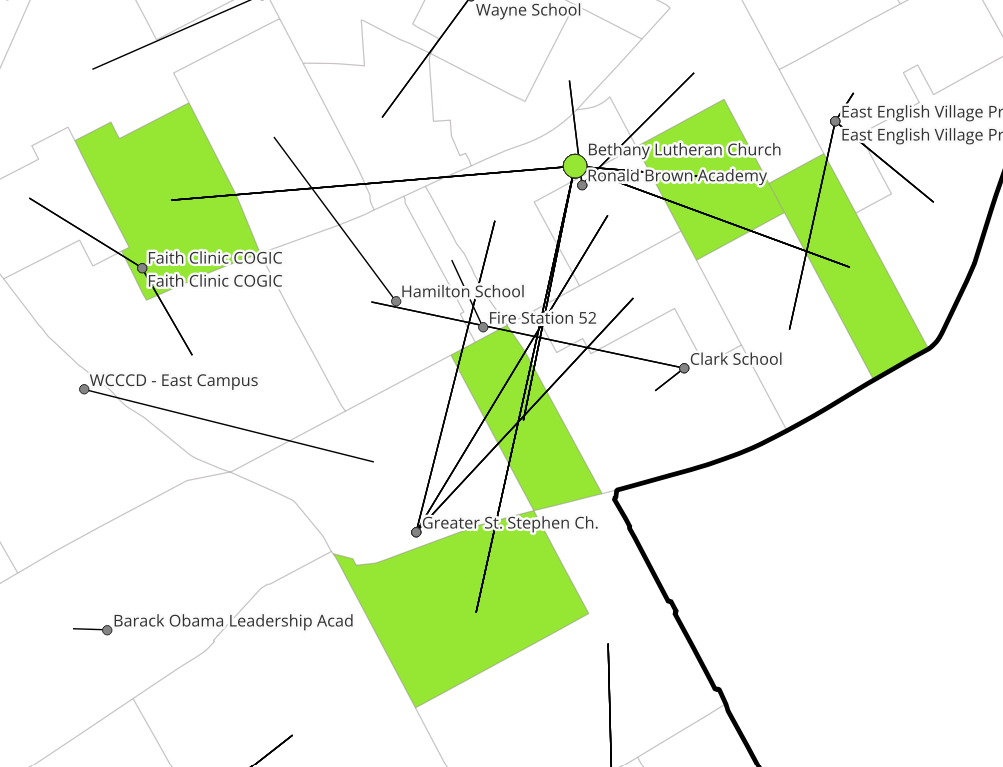
As the map shows, the geography of voting in Detroit is far from being cleared up. The lines represent how far flung some Detroiters are from their polling place, in some cases more than 3 miles away. Detroiters in many cases will be traveling past multiple other polling places before reaching their assigned polling place. Other polling places look like a star because Detroiters are being assigned in every direction to come vote there.
Among the oddest polling place assignments is that of Sampson Academy where Detroiters may pass three to seven different polling places before reaching their assigned polling place at Sampson Academy.
Bethany Lutheran is a great example of the star pattern of polling place assignments. Oddly, another polling place is right across the street at Ronald Brown Academy. Detroiters come from all cardinal directions to vote.
The last example is a little bit of both where Detroiters in the same precinct as Mason School get to vote there, but then a random set of other precincts must vote there as well. The presence of Farwell Rec Center right next to Mason School complicate clarity and this area really represents the crisscrossing polling place geographies.
Are you prepared to vote in the August 2025 primary and the November 2025 general election? Has your polling place changed regularly?
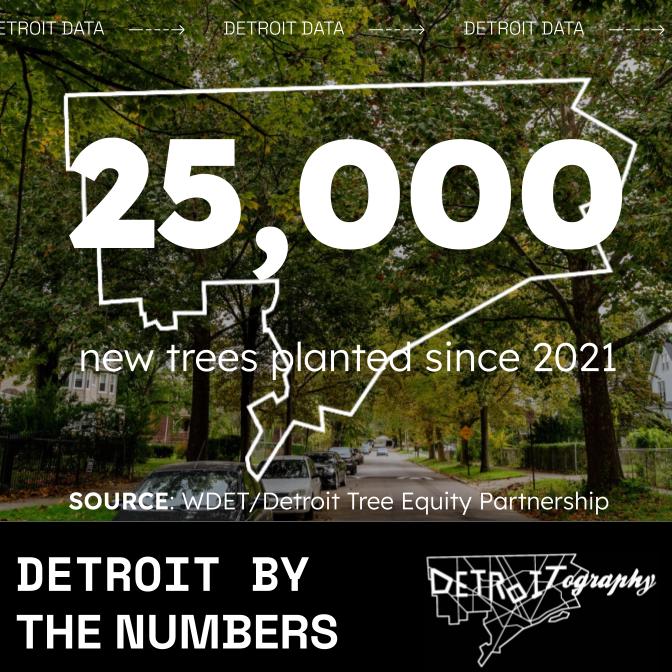
trees planted as part of the Tree Equity Partnership’s goal of 75,000 by 2027 (WDET)
56
mentions of “neighborhood” by Mayor Duggan in his State of the City speech in 2024 after a previous high of 43 in 2015 (DETROITography/Ted Tansley) Check out the data on DetroitData.org
28th
round of Motor City Match awards to 13 new brick-and-motor businesses (Detroit Chamber)
Welcome to our Data Forum where we will explore how race and ethnicity data are captured and tracked as well as improvements in the works. Join us online for lunch-and-learn filled with insightful discussions, tips, and tricks on all things related to the data.
We’ll be joined by the Kristine Ajrouch, professional professor at Eastern Michigan University working on Middle Eastern-North African data disaggregation locally, Ashley Williams Clark is the Vice President of Detroit Future City (DFC) and the Director of the Center for Equity, Engagement and Research (the Center), and Noah Urban from Data Driven Detroit.
Don’t miss out on this opportunity to connect with fellow data enthusiasts and expand your knowledge.
WHEN: Friday, May 16th, 12:30-1:30pm
WHERE: Virtual
WHAT: Join us for our Data Forum where we will explore how race and ethnicity data are captured and tracked as well as improvements in the works.
Join the annual and unofficial Detroit Regional Transit Fantasy Support (DRTFS) Group. Come see the great transit fantasy maps of the Detroit region and make your own! Propose people mover expansions or subway tunnel routes. Rocket buses or rail lines. We’ll focus the evening with Transit Riders United (TRU) sharing steps we can all take to improve mass public transit in the Detroit region.
WHEN: Wednesday, May 14th, 6:30-9pm
WHERE: North End Taproom, 111 S. Main, Royal Oak, MI
WHAT: Meet others who fantasize about regional transit, look at cool maps, make your own map of the people mover expansion!
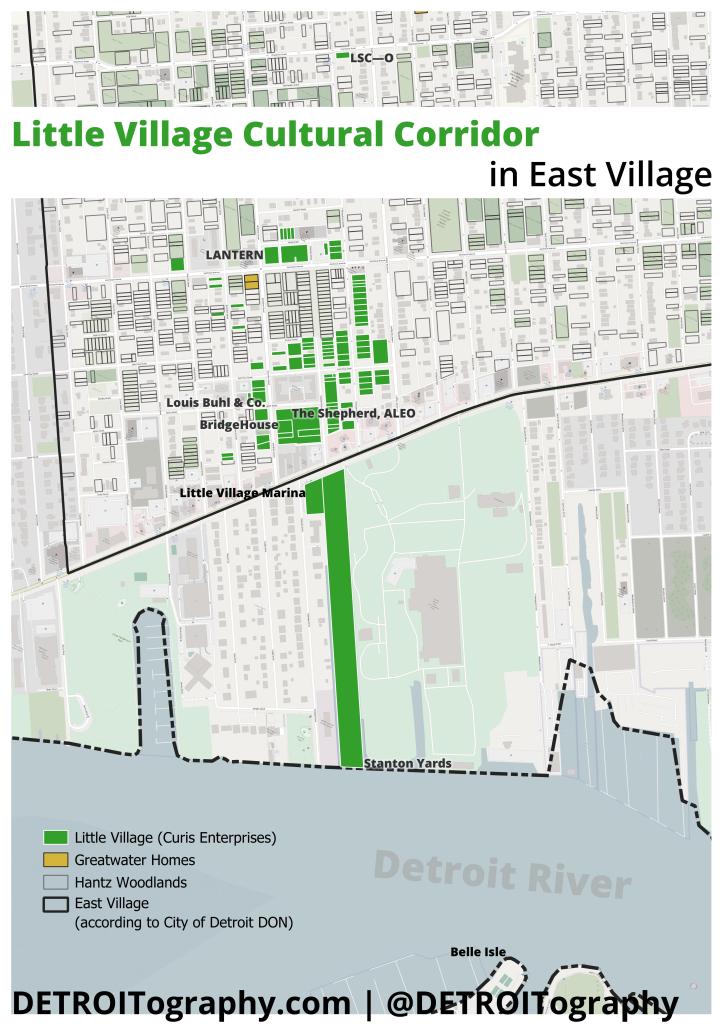
This new arts focused effort claims to be attempting to bring the redevelopment of Detroit beyond Downtown. The effort is spearheaded by the Library Street Collective owners Anthony and JJ Curis. The LLCs associated with Little Village share an address with Curis Enterprises, owned by Michael Curis, Anthony’s father. Michael Curis has been engaged in real estate and community development since 1986 and developed Mack Alter Square, Shops at Woodward Place in Highland Park, and Riverbend Plaza near the Detroit/Grosse Pointe border. The separate LLCs associated with the Little Village development control almost 100 properties on the Eastside including a historic church and a marina with riverfront access.
Little Village is anchored by The Shepherd, a historic church ground that has been reimagined as an arts hub. The grounds includes a Tony Hawk skatepark, Charles McGee Legacy Park, and artist housing in the former rectory building, now called ALEO. Adjacent to The Shepherd is BridgeHouse, comprised of two former residential homes now connected by a decking system with plans for a Warda Patisserie location. Louis Buhl & Co. is a contemporary art gallery located in the former convent building. The LANTERN building hosts PASC disability arts organization, Signal Return print shop, Collect beer bar, and Cafe Franco. LSC—O is the “Library Street Collection – Outpost” for gallery operations. The biggest effort looks like it will be re-imagining a 13-acre marina site with multiple former warehouses into the Little Village Marina and Stanton Yards.
In the 2012 Hantz Woodlands land grab, the City of Detroit sold 140 acres at 8 cents per square foot to Southfield-based finance entrepreneur, John Hantz. In 2021, it was reported that Hantz sold off about 100 of his properties for $2.8 million. The majority of the Little Village properties were purchased from Hantz Woodlands LLC between 2021 and 2023. I’ve heard mixed discussions as to whether this is gentrification, a furthering of the land grab, or important redevelopment work. Since much of East Village is vacant lots owned by Hantz Woodlands there isn’t much to go on and there aren’t many neighbors to ask. Little Village has actively engaged the Villages CDC, East Village Association, and other neighborhood groups. A nearby effort by Greatwater Homes (Greatwater Opportunity Capital) is also the first residential home development project in Detroit in many years with a focus on Fischer Street near the Little Village development.
I am intrigued and will watch to see how this effort plays out. Based on past efforts by Anthony and JJ Curis, I have no doubt that Detroit’s Eastside will become a hub for artists visiting Detroit and hopefully a platform for Detroit artists to launch themselves into the national art scene.
Updated 04/05/2025:
Text edited to clarify that Curis Enterprises and LLCs associated with Little Village development are not connected, but do share a mailing address.
Welcome to our Data Forum where we will explore themes from the Mayor’s State of the City address and the data points within them. Join us online for lunch-and-learn filled with insightful discussions, tips, and tricks on all things related to the data.
We’ll be joined by the Detroit Next podcast team, Bryce Huffman and Malachi Barrett, both from Bridge Detroit and Data Analyst, Ted Tansley.
Don’t miss out on this opportunity to connect with fellow data enthusiasts and expand your knowledge..
WHEN: Friday, April 11th, 12:30-1:30pm
WHERE: Virtual
WHAT: Join us for our Data Forum where we will explore themes from the Mayor’s State of the City address and the data points within them
This map shows where 8 Mile and I-94 meet towards the Eastside of Detroit and the Grosse Pointes. This might not be the best example of broken social connections based on the divided history of the area and the systematic barriers put in place to keep the Grosse Pointes insulated.
The authors do note Detroit as an example of highways acting as an interracial barriers during the urban renewal era. I’ve noted time and again how many of these projects erased ethnic and culturally significant enclaves in the city from Black Bottom, Paradise Valley, and Chinatown. I can’t help but think of the legacy of these broken social connects as much of the westside of Downtown remains as parking lots and vacant spaces.
WHAT: Come hang out with Detroit’s shadow geography department (that’s us) to talk Detroit, maps, and geography. Inside scoops, free snacks, and coffee!