
by: Ted Tansley, Data Analyst
Mike Duggan’s tenure as Mayor of Detroit has been focused on data. The number of residents in the city, number of demolitions, number of jobs brought to the city, number of affordable housing built or preserved. All data points get brought up in his yearly State of the City address where he makes his case to the public that he and his team have been doing a good job as stewards of the city. What we wanted to do is to analyze the twelve speeches he made over the course of his mayoral career to see what, if any, patterns arose.
The first step was to get those speeches into a machine readable format. Now, the city only had one of Duggan’s speeches transcribed for public access, so we sought other methods. We landed on two transcription options that seemed most reliable. One, the built in YouTube transcription which we downloaded and converted to a text (.txt) file. The other, using a publicly available general-purpose speech recognition model from OpenAI, called Whisper, which allowed us to feed it audio files to transcribe them.
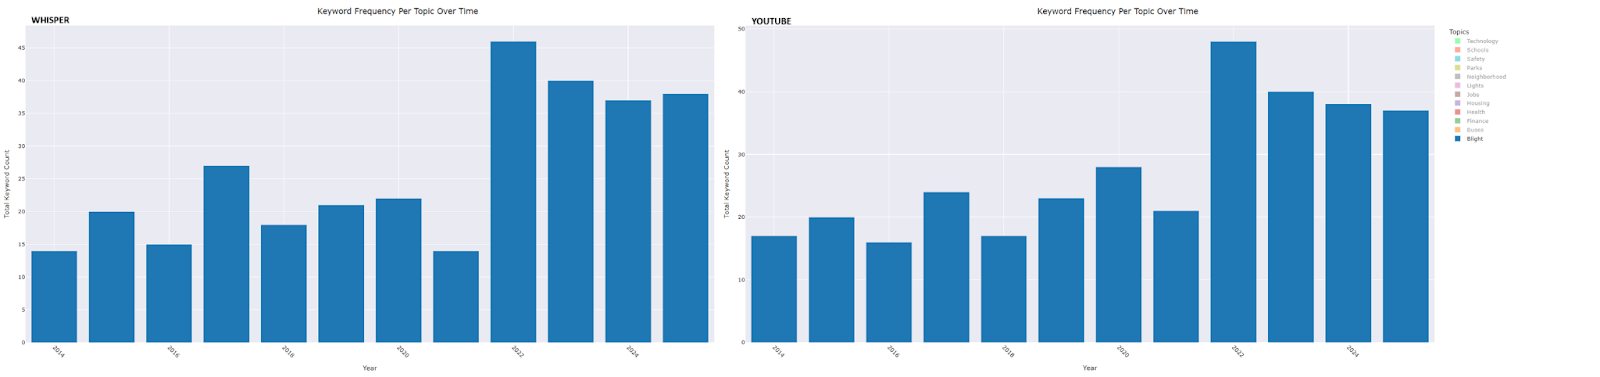
When it comes to the selection of our audio sources, there was a challenge we came across that is worth noting. For the year 2019, there were two videos of the speech. One, more complete, but did not have an available transcription. The other had a few moments of the start of the speech cut off, but had the built in YouTube transcription. When you see data presented, we will have both YouTube and Whisper alongside one another where YouTube has the slightly cut off transcription and Whisper includes the full audio.
With the transcriptions from both sources in hand, we had to make them machine readable and formatted for our needs. We took the following steps:
- Put all the text into lower case
- Removed punctuation
- Tokenized the text. Meaning we split each file down into individual words.
- Applied lemmatization on the tokens. Meaning we broke words down into their base forms. For example, a word like “jobs” would become “job”.
Doing this preprocessing work made the text machine readable and allowed us to run analysis on them. This effort is considered Natural Language Processing (NLP) which is a field of Artificial Intelligence (AI) . While there are lots of ways to process text and analyze the information in it, we performed exact keyword matching. This method takes a key/value pair and matches the keywords as they show up in the text. It also allows us to block the count of some keywords to prevent the overcounting in instances where it doesn’t make sense. For example, our category of “Parks”, we wanted to block place or street names like Asbury Park or Brush Park as they represent something other than the park mentions we were looking to capture.
Now, running an exact match keyword analysis has its strengths and weaknesses to it. The fact that it doesn’t partially match up on terms is great. Especially if you’re looking at a word like “bus”, for example. This method also allows for quick visualization and a straightforward count of the keyword value matched and associated topic key. Additionally, this process makes it accessible for interested individuals to develop their own key/value pairs to run analysis that fits their needs or interests. The weaknesses on this are that there is no semantic or contextual understanding of the matches. Phrases like “ they’re doing a good job” vs “ we’re getting more jobs to Detroiters” or “it is a great park” vs “where you go to park” will get counted the same. Additionally, there is some ambiguity that comes where a place is more than one thing. Palmer Park, for instance, is a neighborhood and a park. Knowing when to count or not count isn’t possible with this method. Lastly, we’re limited by the key/value pair dictionary. We can’t capture everything which can lead to some things being missed as a result. Notably absent is a topic on water. This can be challenging as water is a dynamic topic which could range from drinking water to flood water without a clear distinction of which.
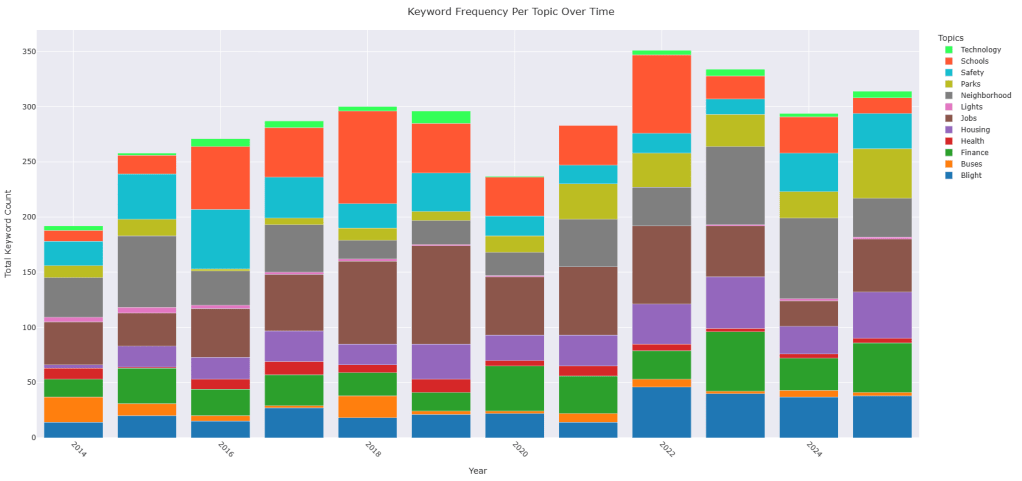
What we can see are some interesting alignments between the topics mentioned in the State of the City speeches and events occurring in Detroit at the same time. In addition to the consistent growth in keyword counts for Housing, Parks, and Finance over the years, we observed the following trends:
- Blight: The topic count reached its lowest point in 2021—the year Proposal N was enacted—followed by the highest recorded counts in subsequent years.
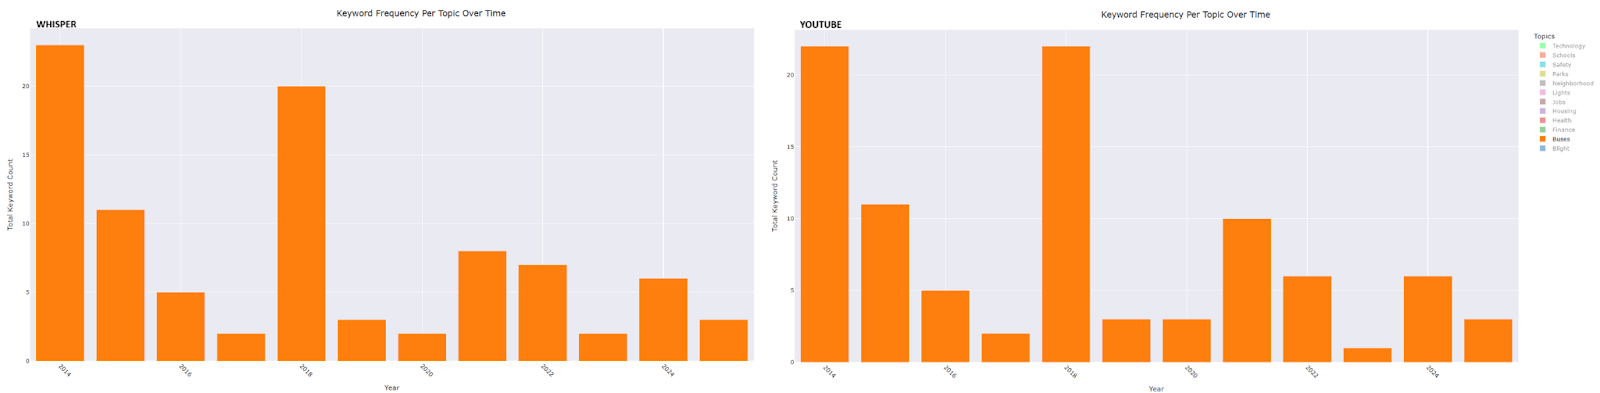
- Buses: Peaks occurred in 2014, the year after the formation of the RTA, and again in 2018—the year the ConnectTen bus network was launched, DDOT underwent rebranding, and bus routes were renumbered.
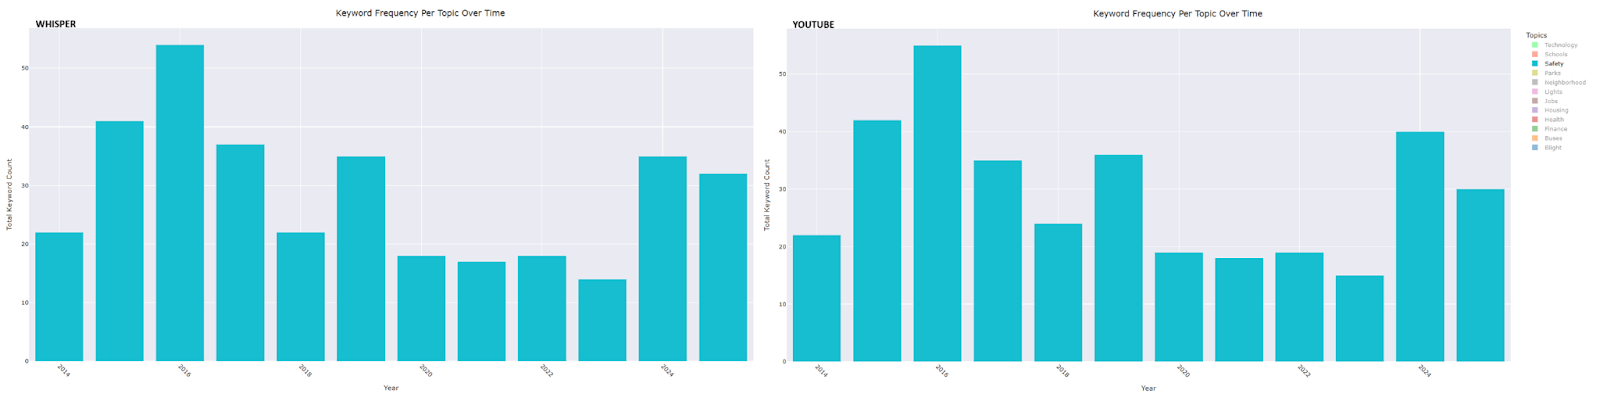
- Safety: A peak in 2016 aligns with the launch of Project Greenlight, another in 2019 corresponds with the expansion of the Real Time Crime Center, and a further peak in 2024 coincides with the achievement of response time goals for the Fire/EMT Department.
- Jobs: Initially, the keyword frequency tracked closely with the employment rate and the number of residents employed from 2015 to 2019. However, during the COVID years and in the post-pandemic period, the frequency diverged from these metrics.
- Neighborhoods: As a topic, it started out among the highest the first two years, then trended downward the following five years only to grow from its lowest point leading to his 2021 run of “every neighborhood has a future” , a seemingly direct response to criticism.


Our analysis reveals that Mayor Duggan’s emphasis on numerical metrics in his State of the City speeches is not merely a rhetorical device but forms the backbone of his public narrative. By systematically examining these speeches through exact keyword matching, we see how his presentation of data aligns with broader city events and initiatives. This numerical approach provides a quantifiable, yet mostly directional record of his tenure and invites further discussion on how data is employed to communicate policy achievements.
Discuss these data trends and more at our upcoming Data Forum!

Thank you for organizing this important data forum and thank you for keeping me on your mailing list. I look forward to your presentation on April 11.
Pingback: Detroit By The Numbers: April 2025 Data Roundup | DETROITography