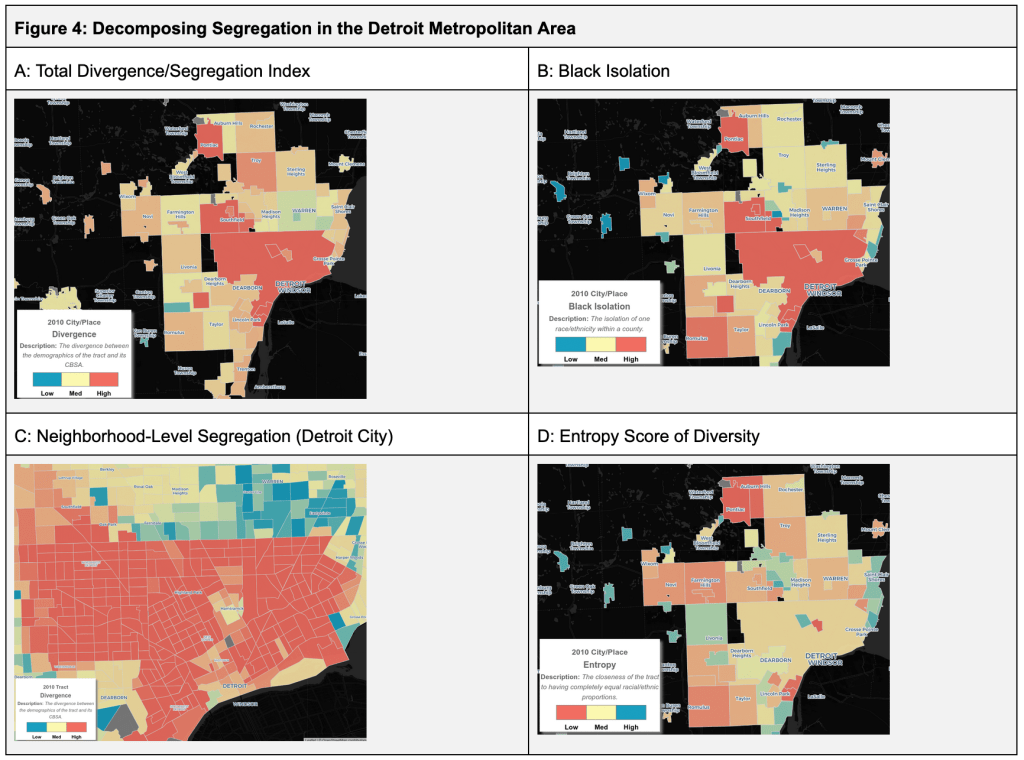
There are many different methods to calculate and describe segregation of cities. Detroit is regularly noted as one of the most segregated cities, but what is often left out is the regional context or the fact that the data calculation of segregation requires comparison to regional data. The Othering and Belonging Institute (OBI) has put together both an excellent interactive tool and a useful technical appendix.
The Dissimilarity Index is the most commonly used index, but only displays dissimilarity between two racial groups at a time. The Divergence Index (A) is preferred by OBI because it compares the relative proportions of racial groups at various geographies. Isolation and Exposure Indices (B) help us observe the degree of racial residential segregation experienced by different racial groups, but again can only indicate the exposure of one group to another. The Entropy Score (D) best demonstrates racial and ethnic diversity within a given geography. It is becoming more frequently used to describe segregation, but does not actual measure segregation.
