by: Stephen Lindley, Wayne State University (Final Project, Intro to GIS, Fall 2020)
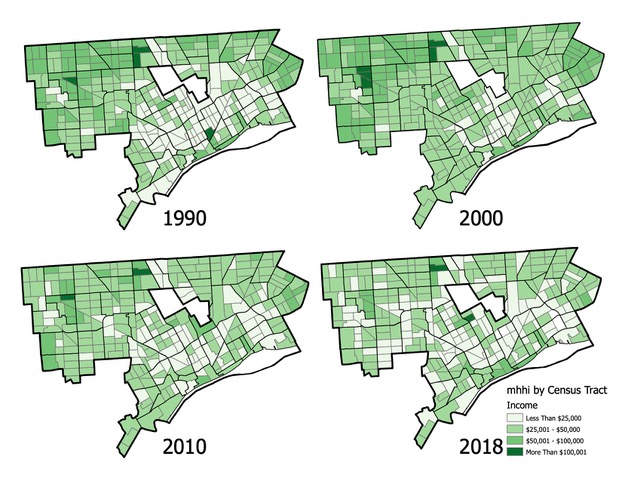
The population of Detroit has been in decline since the late 1950s. What was once the fourth-largest city in the country has steadily lost population for more than half a century. This series of maps looks at changes in the median incomes across census tracts in Detroit from 1990 to 2018.

In 2000, the median household income in Detroit was $40,128, an 18% increase from 1990. The national inflation-adjusted median income was $61,492, almost 50% higher than in Detroit. The population had decreased by 8.1% to 945,471, but numerous neighborhoods across the city showed gains in income and prosperity over the ‘90s.
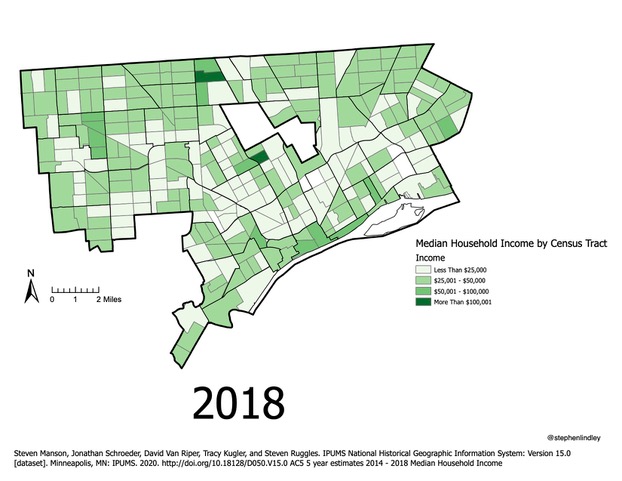
By 2018, the city’s population had declined to 672,662 and median household income had dropped to $28,189. Meanwhile, the national median household income was $63,179, almost 125% higher than Detroit.
This birds eye view of the city over roughly 30 years provides only a broad overview, but is formative to understanding and addressing how far the city continues to lag behind. It will be telling to observe if the next point in this series will become even lighter than the 2018 version or if neighborhoods across the city will exhibit growth and a resurgence towards the levels seen in 2000.
