by: Steven Wiltse
I pulled the election results from the respective County Clerk websites. Oakland, Washtenaw, and Macomb came somewhat preformatted in tables to be easily copied into excel. Wayne on the other hand was scans of printed PDFs that required hand coding. It’s also worth noting that Oakland, Macomb, and Washtenaw were posted online within days of the election, while Wayne took over a month. Using a shapefile of Michigan’s 2016 voter precincts, I joined the combined excel of Washtenaw, Oakland and Macomb, and entered in Wayne’s precinct by precinct. Because the precincts shapefile comes with both community and precinct ID fields it was easy to match up the smaller communities for the join (after some more excel work). Detroit was the only hiccup, as it was the only community with precinct identifiers that weren’t already in numeric order. That was solved by just pulling out the last three digits of the Detroit precincts and resorting. Lastly, because Detroit operates in-person absentee voting, I was not able to map those results as they lacked spatial references.
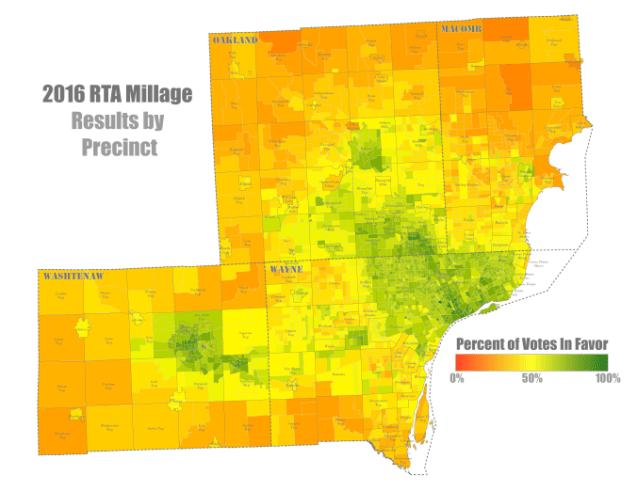
Once the yes/no counts were in I was able to add fields to do the calculations of Yes % support and the Yes/No results. Someone ended up asking a question online about density related to yes votes, so I added another field calculating the votes per sq/mile of the precinct (which gives a similar green to red pattern as the results).
