Map: Concentration of Obesity in Detroit

Screen Shot 2015-09-21 at 9.24.41 AM

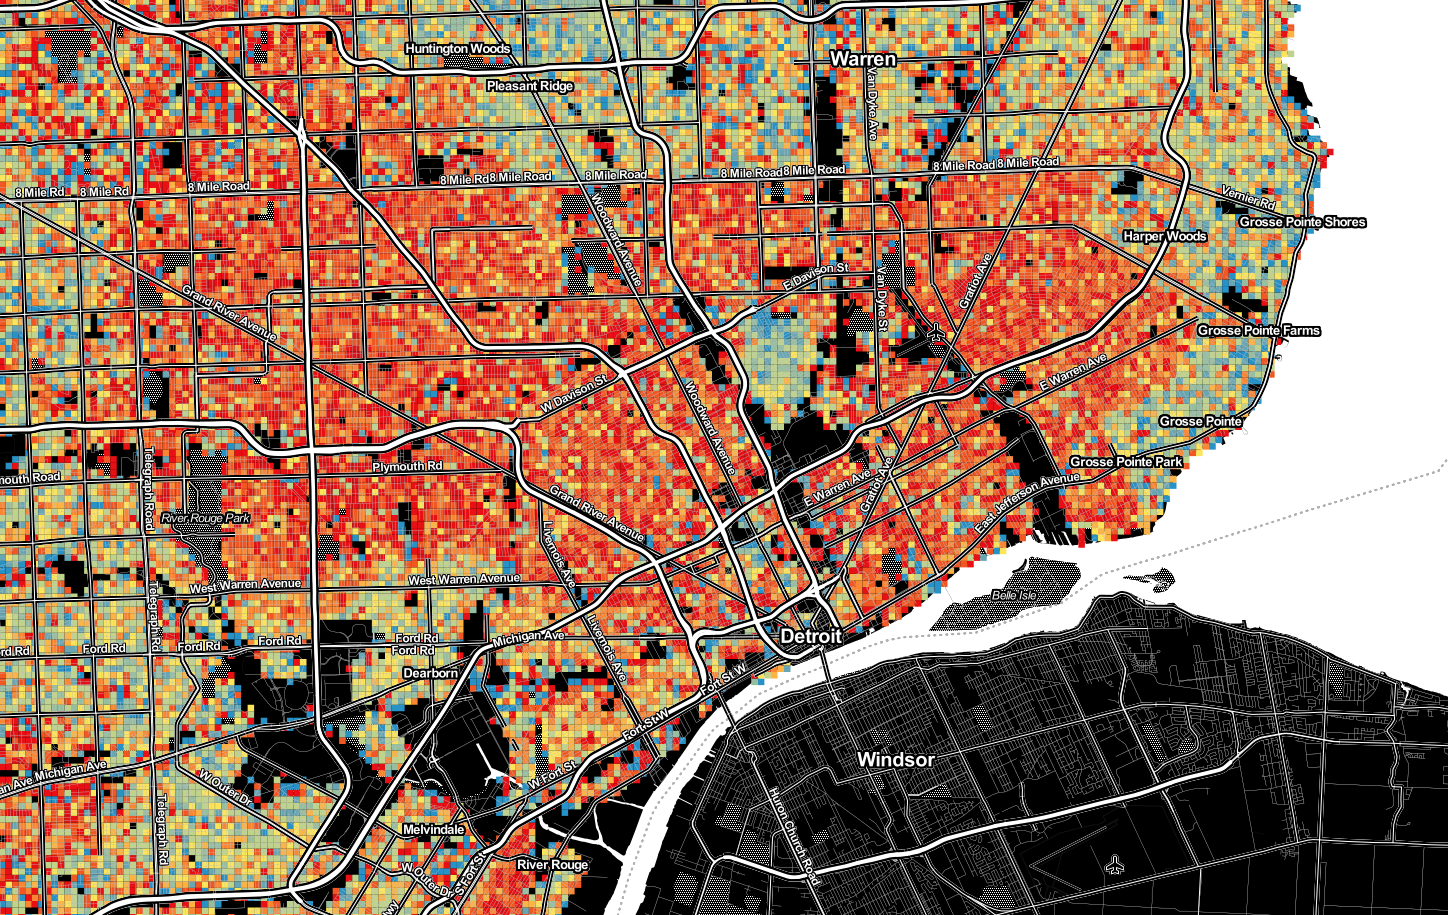
Synthetic MicroData and RTI put together a new map to show the estimated percent concentration of obesity among the adult population in the US on a 250m grid.

Data used to create the concentration index were determined by dividing the population over 20 years old divided by population with BMI greater than 30.0, multiplied by 100.

Leave a Reply

Fill in your details below or click an icon to log in:

WordPress.com Logo

You are commenting using your WordPress.com account. Log Out /  Change )

Facebook photo

You are commenting using your Facebook account. Log Out /  Change )

Connecting to %s