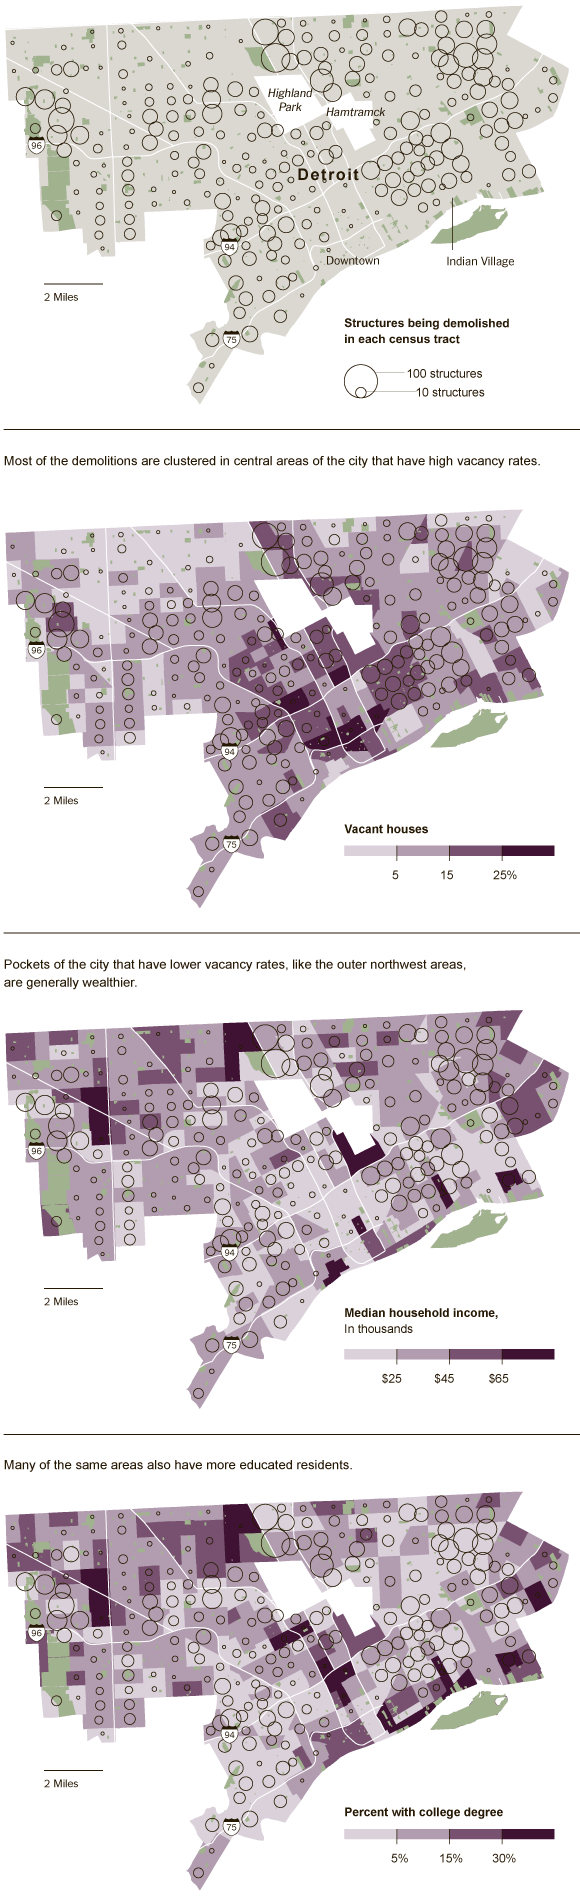
The New York Times completed a series of maps about shrinking Detroit in 2011. They looked at where structures were being demolished and where vacant houses still stood. They posited that the city was looking for which neighborhoods to save in the process and also created maps looking at median income and college degrees.
These are nicely designed maps and help to show the contrasts of the city where problems reach all corners, but funding and solutions are more concentrated and disparate.
