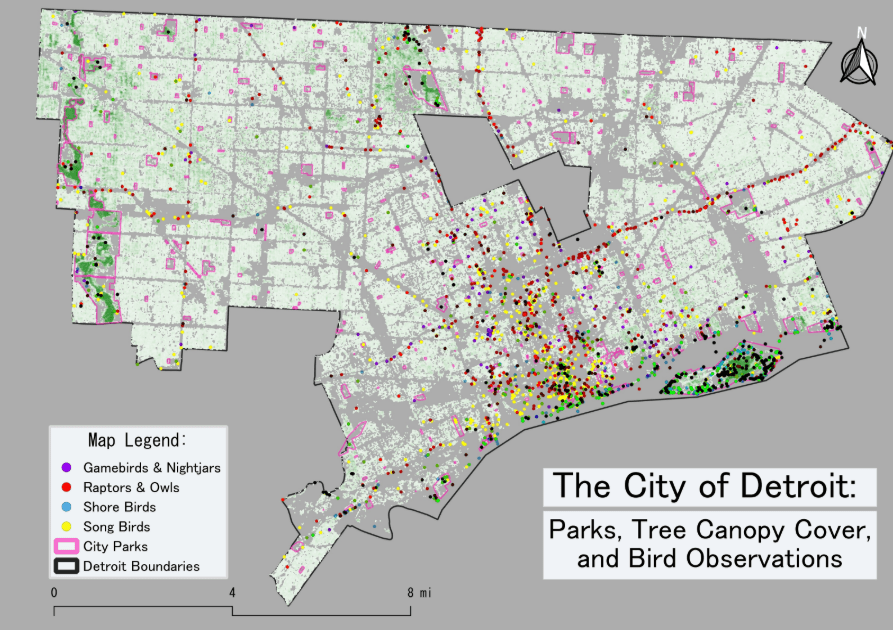
Showing a map of the City of Detroit with an overlay of tree canopy cover and highlighting the boundaries of city parks. Further, there are over a quarter million points on the map representing bird observations that have been submitted to the eBird application. The legend shows the exact colors of the point data. Where alternative colors arise (e.g. green or black dots), it is a result of multiple points overlaying one another. Additionally, the bird observations were grouped up into like “”order”” to try and consolidate the dataset into a more manageable layer grouping.
My map explores the connections between where people observe birds, the natural habitat we provide, and the marks left in the landscape where tree canopy is missing. You may find city parks with little to no canopy—and thus, no bird observations—while in other areas, clusters emerge where urban prairies offer the perfect landscape for sightings. However, the links between human habitation, visitation preference, and observation frequency inevitably biases the visualization towards where more people live and where they visit.
This map was the winning professional entry of the Visualizing Detroit: The Art of Data competition and exhibit in March 2026.
