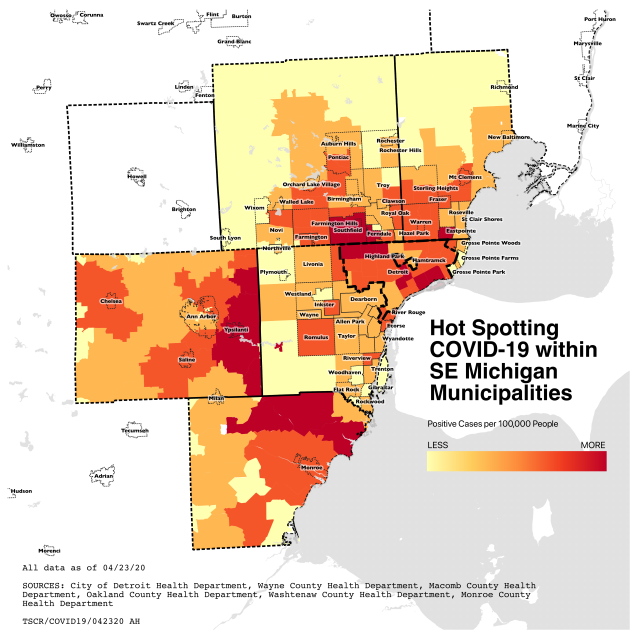
I have to start with the caveat that I strongly dislike (hate is a strong word) ZIP Codes with a passion for mapping out any data, but desperate times and desperate measures (be on the lookout for an improved spatial process soon). Not all of eastern Washtenaw County is a hot-spot nor is all of northern Monroe County. Ypsilanti and Carleton are likely hostpots.
ZIP Code has become an default for municipal governments and in particular for health data. I assume because of the perceived “safety” of releasing case data that might be impossible to pinpoint within a ZIP Code rather than say a smaller geography like a Census Block Group. There still remains the possibility that there are only 10 houses in a ZIP Code and you could easily determine which of the 10 has a case of a particular disease.
At any rate, all the counties in the Southeast Michigan Council of Governments (SEMCOG) region are publishing a data dashboard that includes case counts at the ZIP Code level. However, not all of them present the data in the same way.
- Detroit only offers a map image by ZIP, no machine readable data tables.
- Wayne County locks down their data dashboard and reports at the “community” level, which thankfully in Wayne County (except for Dearborn) largely matches with ZIP Codes.
- Oakland County includes death counts. They normalize by cases per 10,000 people
- Macomb County has a detailed dataset of daily new cases, but reports limited data at the ZIP Code level beyond a case “count”
- Washtenaw County shares a “frequency” of cases by ZIP Code
- Monroe County shares case counts
- Livingston County shares a map, but the dataset API isn’t open to the public so was dropped when I made the map
ZIP Code data may be more geographically specific than County, but still needs more nuance and clarity.

Thank you very much for this information. It would be very helpful if the state department of health provided information about the number of cases and number of deaths by census tract. It would be straight forward to use 2018 ACS data to ascertain correlated of the pandemic. Are there some surprising and unexpected areas with very low or unusually high apparent rates of Covid19 infection.
Pingback: Detroit Region COVID-19 Hotspots by ZIP Code – PHOENIX