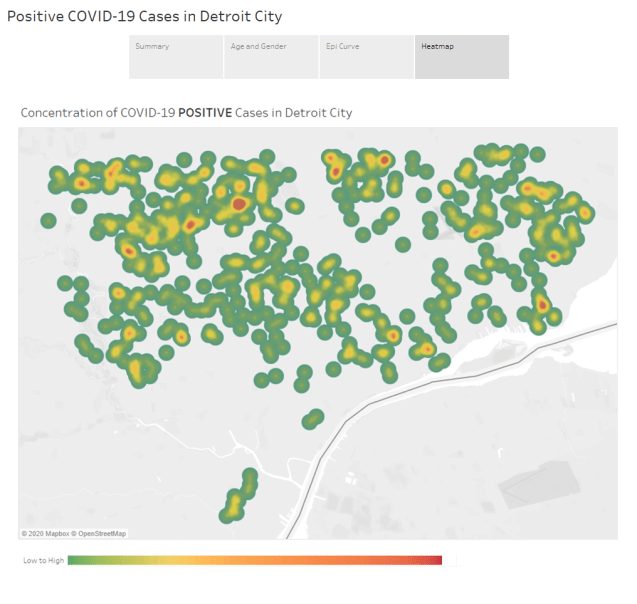
 This map was downloaded from the City of Detroit Coronavirus webpage on 03/29/20 after the latest 3pm update by the State of Michigan Department of Health and Human Services (MDHHS).
The City of Detroit’s coronavirus data are being tracked with a Tableau dashboard that include a heatmap of individual cases that I assume map on to individual patient addresses.
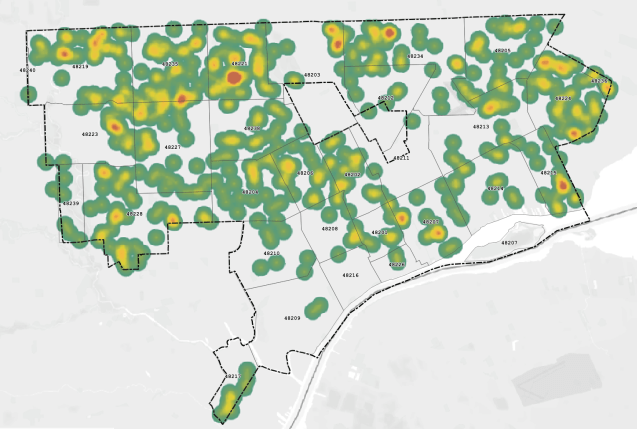
The map, as many have already noted, follows population density patterns in Northwest and Far Eastside Detroit, however there is a major gap in Southwest Detroit. From past work on asthma medication management I wouldn’t be surprised if similar issues of care access, documentation concern, and language barriers are exacerbating coronavirus impacts in Southwest Detroit where a major risk factor – air pollution – is also prevalent.
EDIT: Map with geographic references.