
by: Steven Wiltse, Martin Denicolo, Zachary Manning, Kevin Zhang, Tess Parr – City of Detroit
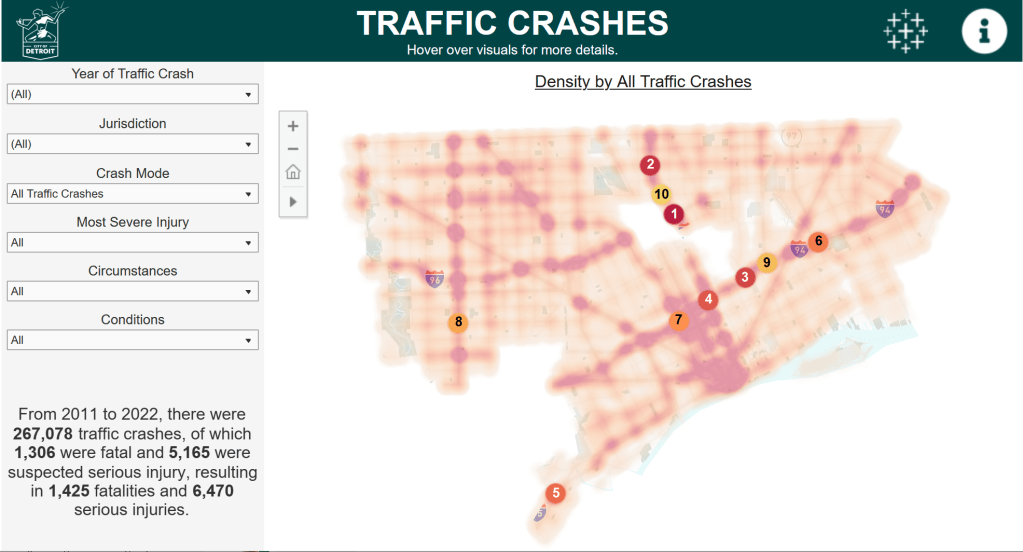
The City of Detroit has launched its Open Data Portal Analytics initiative in order to increase public access and understanding to valuable data and information that is posted on the Open Data Portal as raw datasets.To that end, the Traffic Crashes dashboard was built to visualize 267,078 traffic crashes that occurred in the city of Detroit from 2011 to 2022. The dashboard’s visual elements include a heatmap of traffic crashes with top 10 intersections, a highlight table of crashes by time and day of the week, and a histogram of crashes by type.Users can apply filters on the dashboard to explore deeper trends in the data. Drill-downs include the road jurisdiction, modes involved (e.g. automobile, pedestrian, bicycle, etc.), most severe injury to occur, circumstances involved in the crash (alcohol/drug use, red light running, speeding, etc.), and conditions at the time of the crash (rain/wet, snow/ice, dark-unlighted, etc.). The filters dynamically change all the elements on the dashboard, including written descriptions.The Traffic Crashes dashboard was built in Tableau Desktop and embedded in an ArcGIS Experience Builder application.
