
by: Gene Estrada, Detroit River Story Lab, University of Michigan
This map was created by the Detroit River Story Lab at the University of Michigan, Ann Arbor. Our goal is to estimate the total amount of greenhouse gas emissions (i.e., create an emissions inventory) for the Detroit River Corridor. We created this online, interactive map as an accessible tool for anyone interested in understanding carbon emissions at a local level. We are currently working with local educators in Detroit-area schools to include the use of this tool in school curricula.
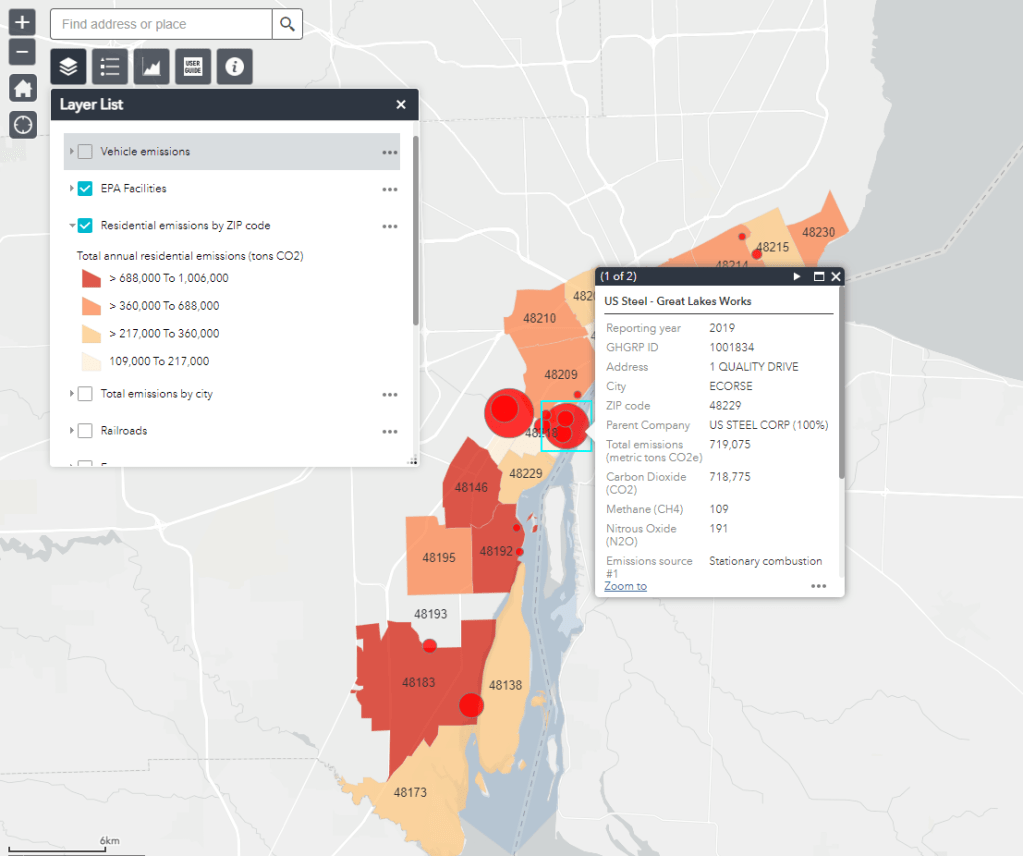
To create this map, we collected carbon emissions data from a multitude of sources, including the U.S. Environmental Protection Agency’s Greenhouse Gas Reporting Program, the Database of Road Transportation Emissions, the U.S. Army Corp of Engineers, and more. Each carbon emissions source (facilities, vehicles, river cargo shipping, etc.) is displayed as its own map layer, which users can toggle on and off, and contains detailed information available the carbon and other greenhouse gas emissions associated with that layer and components within the layer. A full list of data sources, with links, used to create this map, and a summary of the approach we used to construct the map, can be found in the About tab.
We implore users to explore the map layers and look for patterns in the spatial distribution of emissions. We also provide layers showing major freeways, railroads, and U.S. Census data to encourage users to look for associations between infrastructure, demographics, and carbon emissions in the Detroit River area.
