
by: Sophia Casab-Casab
Exploring Detroit’s data set whilst taking into account its fascinating historical narrative, I knew I wanted to take these concepts hand in hand and present a project that had a compelling message. But there’s a crucial step in between—making sense of the data. This transformation is not just about presenting numbers and figures; it’s about crafting visual metaphors that resonate with our collective understanding. I delved into the dataset with a guided vision of how cities work, how and where its population tends to flourish, where essential services and parks thrive, and how these elements intertwine to impact the quality of life. These themes were carefully chosen to serve as the compass for my exploration of the data.
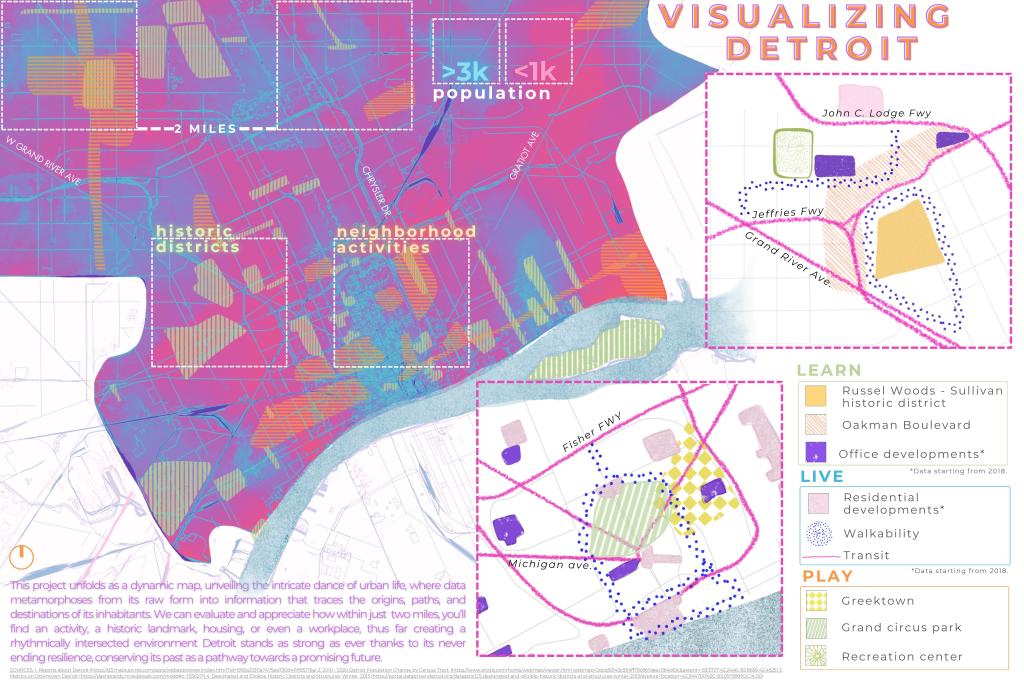
WORK: In this city, work and life are interwoven in a tapestry that celebrates and embraces diversity within its myriad activities, ultimately enhancing the quality of life.
PLAY: The city’s heartbeat pulses through the various activities that grace its streets, offering an insightful glimpse into its vibrant soul.
LEARN: By charting the historical districts, we embrace the past as a guide toward our future. A city’s strength etched by persevering its historical landmarks, parks, and constant evolution.
LIVE: Our lives are inextricably intertwined with the myriad offerings of this city, creating a rhythmic symphony of experiences and opportunities.
This project unfolds as a dynamic map, unveiling the intricate dance of urban life, where data metamorphoses from its raw form into information that traces the origins, paths, and destinations of its inhabitants. For urban planners and city leaders, these insights can reveal hidden structures, eventually finding a tool to shape and improve their communities. Some elements may remain open to interpretation, but therein lies the beauty and potential of art itself. In conclusion, data serves as the cornerstone upon which we construct our understanding of the world, a bridge between history and the present, a canvas for our artistic expressions, and a compass guiding us toward a brighter, more informed future.
Dataset(s) Used: – Reports about Detroit – 2010 – 2020 Detroit Population Change by Census Tract – Designated and Eligible Historic Districts and Structures, Winter, 2013
This map was part of the Visualizing Detroit: The Art of Data competition and exhibit in November 2023.
