
Understanding occupancy and vacancy in Detroit is a constant data battle. The known crises of low home mortgage origination, large-scale evictions, and property speculation make Detroiters unduly mobile having to secure housing by various means and face multiple barriers along the way.
The last subjective assessment of occupancy in Detroit came with the 2014 Motor City Mapping project, but relied on responses of surveyors. The City’s current in-house streetview imagery could be used to do the same, but might not capture indicators like utility turn-ons. The DLBA used to run a quarterly “occupancy index” model that included DTE account information to better assess occupancy, but as far as I have heard the data sharing agreement fell apart years ago.
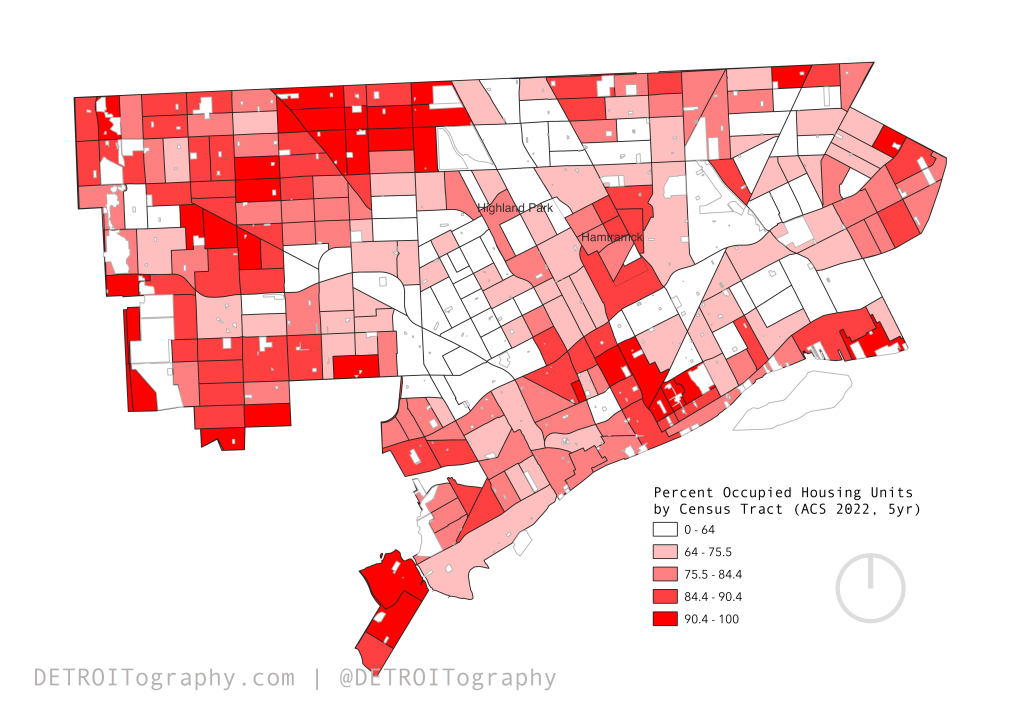
The next best option is Census data on occupied housing units or USPS data on vacancy. I try to opt for the more positive data indicator with where people are in housing. We see a familiar pattern that maps onto the population dense clusters across the city.

Pingback: Detroit By The Numbers: July Roundup | DETROITography
Pingback: Map: Households with No Internet 2021 | DETROITography