
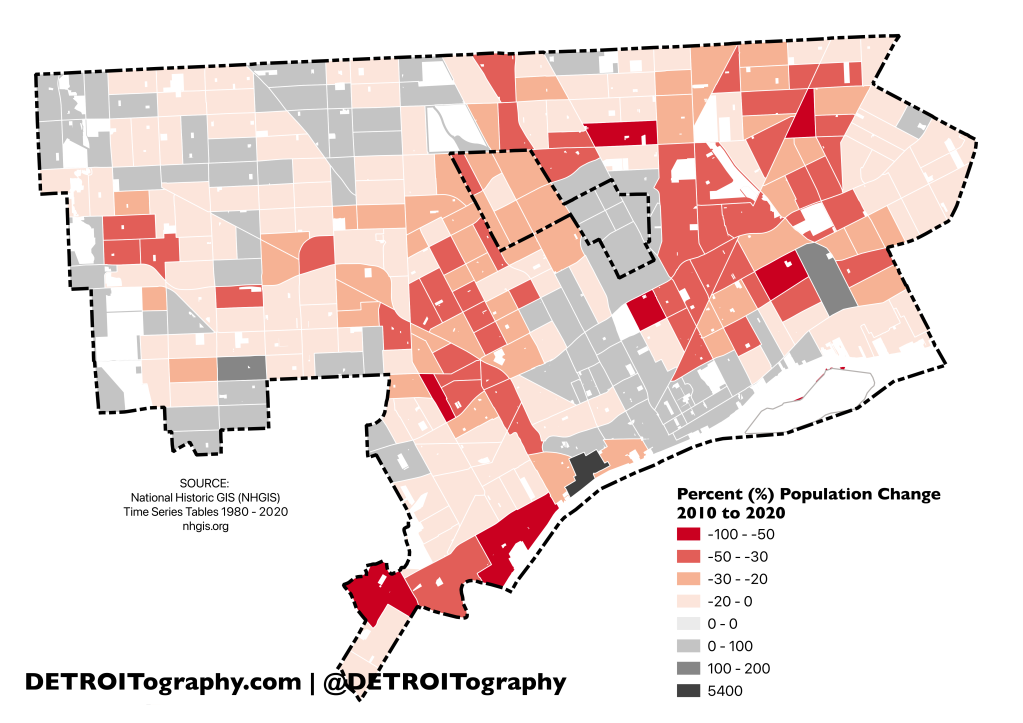
Sometimes I make a map because I’m unhappy with what exists out in the data-sphere already. This is an instance of that exact scenario. A local organization put out a map of population change between the decennial censuses (censi? censai?) using a poorly chosen color scheme and a misleading legend and data categories. What really stood out most was that there was 5,400% (WTF) increase in population somewhere in the city. I assumed it had to be an error or a mistake, but I also could not tell from the map where such a massive population increase occurred.

There was a single census tract in the Hubbard-Richard/Corktown/West Side Industrial area that gained significant population since 2010. I racked my brain for a long time trying to figure out why or what developments contributed to the area going from 4 people in 2010 to 220 in 2020. I had to reach back in time and recall that many of the empty warehouses were converted into lofts. The Hudson (2011) was one of the first with about 80 units, then The Coat Factory Lofts (2014) with 62 units, and most recently The Assembly (2019) with 32 units. Most of the units are one bedroom with a handful of two and three bedroom units. In all the 174 units house an estimated 240 people.
What had been a relatively empty industrial and warehouse square of the city now houses quite a few more people. New amenities like the West Riverfront park and even more housing are coming soon as Ford Motor Company redevelops the train station.
