
by: Ted Tansley, Data Analyst
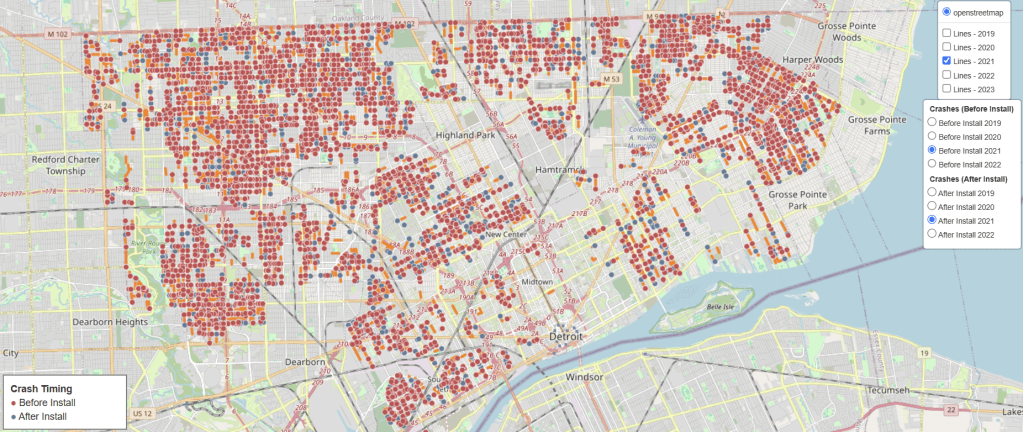
The city of Detroit has been installing thousands of speed humps all around the city in the last couple of years, but are they having any measured impact on the safety of our streets? To look, we took publicly available data of locations where speed humps were installed, combined it with SEMCOG’s crash data, and analyzed whether crashes increased or decreased after the installation of the speed humps.
Getting the Data:
The speed hump data we gathered needed some additional work to be usable. It didn’t natively have geography data when pulled via python, so we needed to run it through QGIS first. Additionally, there were a mix of indications as to whether the hump was installed and when. What we did was remove any speed humps that were marked as either a “poor candidate” or “rejected by residents”. We also created an approximate installation year column which takes the oldest year from the several columns that had years included. This was to keep cohorts together and to avoid a reinstallation or replacement speed hump being counted in a different year. Additionally, for values without years in any of the columns, we filled in with year 2019 as the vast majority were labelled “installed in previous years”.
What was left was a dataset consisting of linestrings, representing roads, where speed humps were likely to have been installed. There wasn’t enough available data to indicate just how many speed humps there were.
| Install Year | Linestring Count |
| 2019 | 459 |
| 2020 | 1063 |
| 2021 | 3663 |
| 2022 | 1952 |
| 2023 | 22 |
With the crash data, we filtered to just crashes labelled as having happened in the City of Detroit and also dropped values that didn’t have geography coordinates included in the pull. This did, however, lead to a slight difference in the total crash amounts (0.49% less than the original total).
Merging it Together
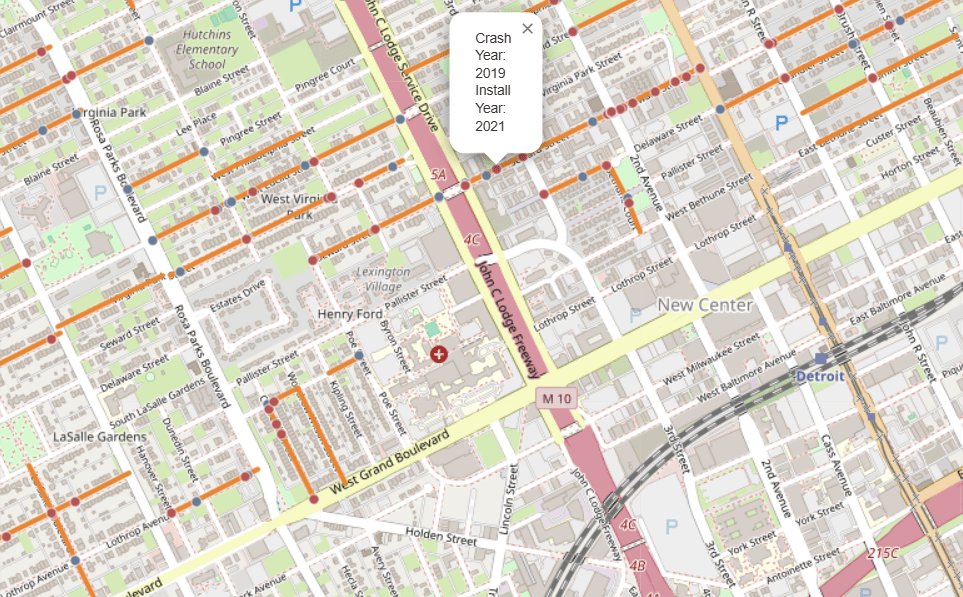
Then, we merged the datasets together with two major parameters to ensure that we’re attributing the right crashes to streets with installed speed humps.
- Only included crashes that intersected within 5 meters of the linestring.
- Only included crashes that also shared the same base street name as the linestring.
This was done to keep the crash data relevant to the location of where speed humps were installed and to reduce the influence of crashes that have happened at intersecting streets from being represented which would have been picked up with the buffer alone.
Crash Analysis
Now, to analyze the impact on crashes. To do this, we split up each installation year into their own performance cohort. With each installation year having a different spread of analyzed years to try and quantify the impact given the limitation of crash data years we have currently available. Year 2023 was excluded due to not having 2024 year crash data

| year | N | total_before | total_after | t | p |
| 2019 | 435 | 1267 | 1292 | 0.46 | 0.6478 |
| 2020 | 992 | 2242 | 2013 | -3.23 | 0.0013 |
| 2021 | 3555 | 7178 | 2513 | -17.27 | 0.0000 |
| 2022 | 1835 | 1542 | 1063 | -8.81 | 0.0000 |
The analysis we ran indicates that the speed humps are impacting crash frequency in the locations of their installation. With most installation groupings showing declines in crashes and the 2021 cohort showing a very significant reduction in crashes in the areas of speed hump installation.

If we were to add up the count of crashes before and compared to the count of crashes after, we get a total percent reduction in crashes of 22.2%. A number that looks great, but could be misleading given that we’re not factoring in the crash decline trend after the surge in crashes during the COVID-19 pandemic and we don’t have more granular data due to speed humps not having a more precise date of installation. Overall, this is a good foundational analysis to have to be able to check and update as each data year in crash data comes through.
ANALYSIS CAVEATS:
- Installation years are an approximation based on the lowest year found across several columns that included reference to an installation year. Instances without a year and were not filtered otherwise were given the year 2019.
- SEMCOG’s crash data set for the city of Detroit was missing geography coordinates for ~1,100 values upon pulling the data from their server. These were removed from the analysis.
- Crashes from the year of installation were excluded in the analysis of each cohort. This was due to not having an exact installation date and a desire to evaluate the before directly against the after installation years.
- Since crashes need to line up by geo coordinates and by the street name, naming conventions of the street name across datasets could lead to a slight undercount for instances where the street name is sometimes prefaced by a cardinal direction label or other non-standard naming variations.


As a lifelong Detroit resident, I think it was ridiculously overzealous and unnecessary to install a bump on each and every street, not to mention what it will do to the cars.
Every street in Detroit is not a speed zone and residents were not asked – I woke up to find they were installing a bump without even notifying us when/why it was happening.
What a waste of dollars that can be better spent…elsewhere.