
by: Nathan Wittenberg, Wayne State University
Embarking on this project has been a fascinating journey for me. As a Hispanic male from California, relocating has somewhat severed my connection to my roots. In my California days, I was surrounded by a community that shared my heritage, but in my new home, it’s a different story—Taco Bell and the occasional Hispanic food truck provide a glimpse of familiarity. This endeavor became an opportunity for me to delve into the intersection of my heritage and my current city. Opting for a minimalistic aesthetic was a conscious decision—I wanted the focus to remain on the data without overshadowing it. Navigating the color scheme posed its own challenge; I aimed for distinct colors to ensure each district stands out unmistakably. It’s been a project that not only explores demographics but also pushes my creative boundaries in unexpected ways.
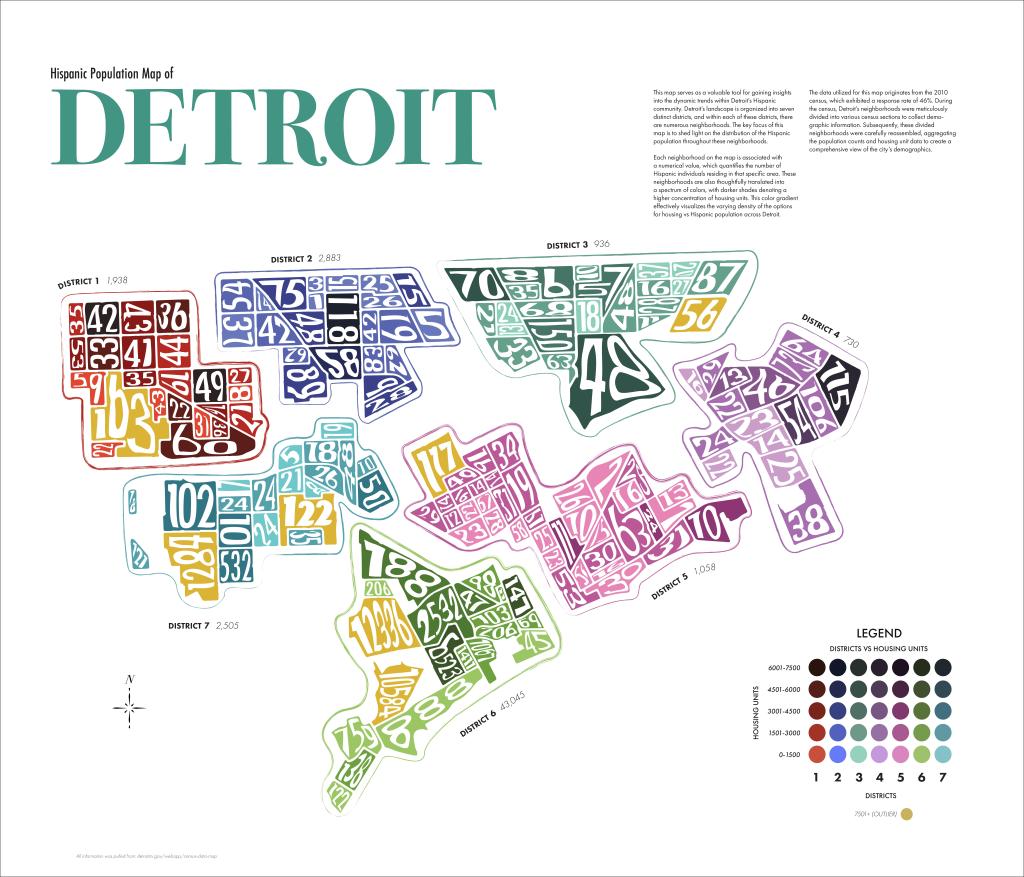
Dataset(s) Used: – Census Data Map
This map was part of the Visualizing Detroit: The Art of Data competition and exhibit in November 2023.
